
Introduction
It is a well documented fact that photocopiers introduce some degree of distortion, linear or otherwise, and/or noise to each copy generation they produce. This study explores the nature of the distortion as it relates to the characteristics of both the original writing being copied, and the technology being used to do so. As the changes introduced to each generation are almost always too subtle to be easily quantified, an approach was adopted in which multiple generations were made in an effort to “amplify” the effects. A small trial run of this process was originally conducted using only two machines, one analog and the other digital. This helped to establish the useful range of several parameters including the number of generations and whether or not there was value in running the experiment using different coloured inks and writing speeds. In addition, some pitfalls in the initial design of the test page were discovered and corrected before the larger run. The balance of this paper will deal primarily with the latter, more extensive testing – though the results of both are included in the graphics interface ultimately created.
Method
A single master sheet was prepared using a design that employed four reference marks for each of the areas in which signatures were to be executed, as well as nine additional reference points for the overall page. In addition, space was provided along the top to indicate the copy generation, machine identification code and density setting. The master page was then printed on photo quality paper at 1200 dpi. Using two different pens, a black rollerball and a blue ballpoint, both a slow, heavy signature and a lighter, faster variation were executed. This approach allowed the exploration of the impact of original image colour as well as line thickness on the copying process. The final master sheet thereby contained four original signatures, 25 reference marks, and space for information along the top (Figure 1).
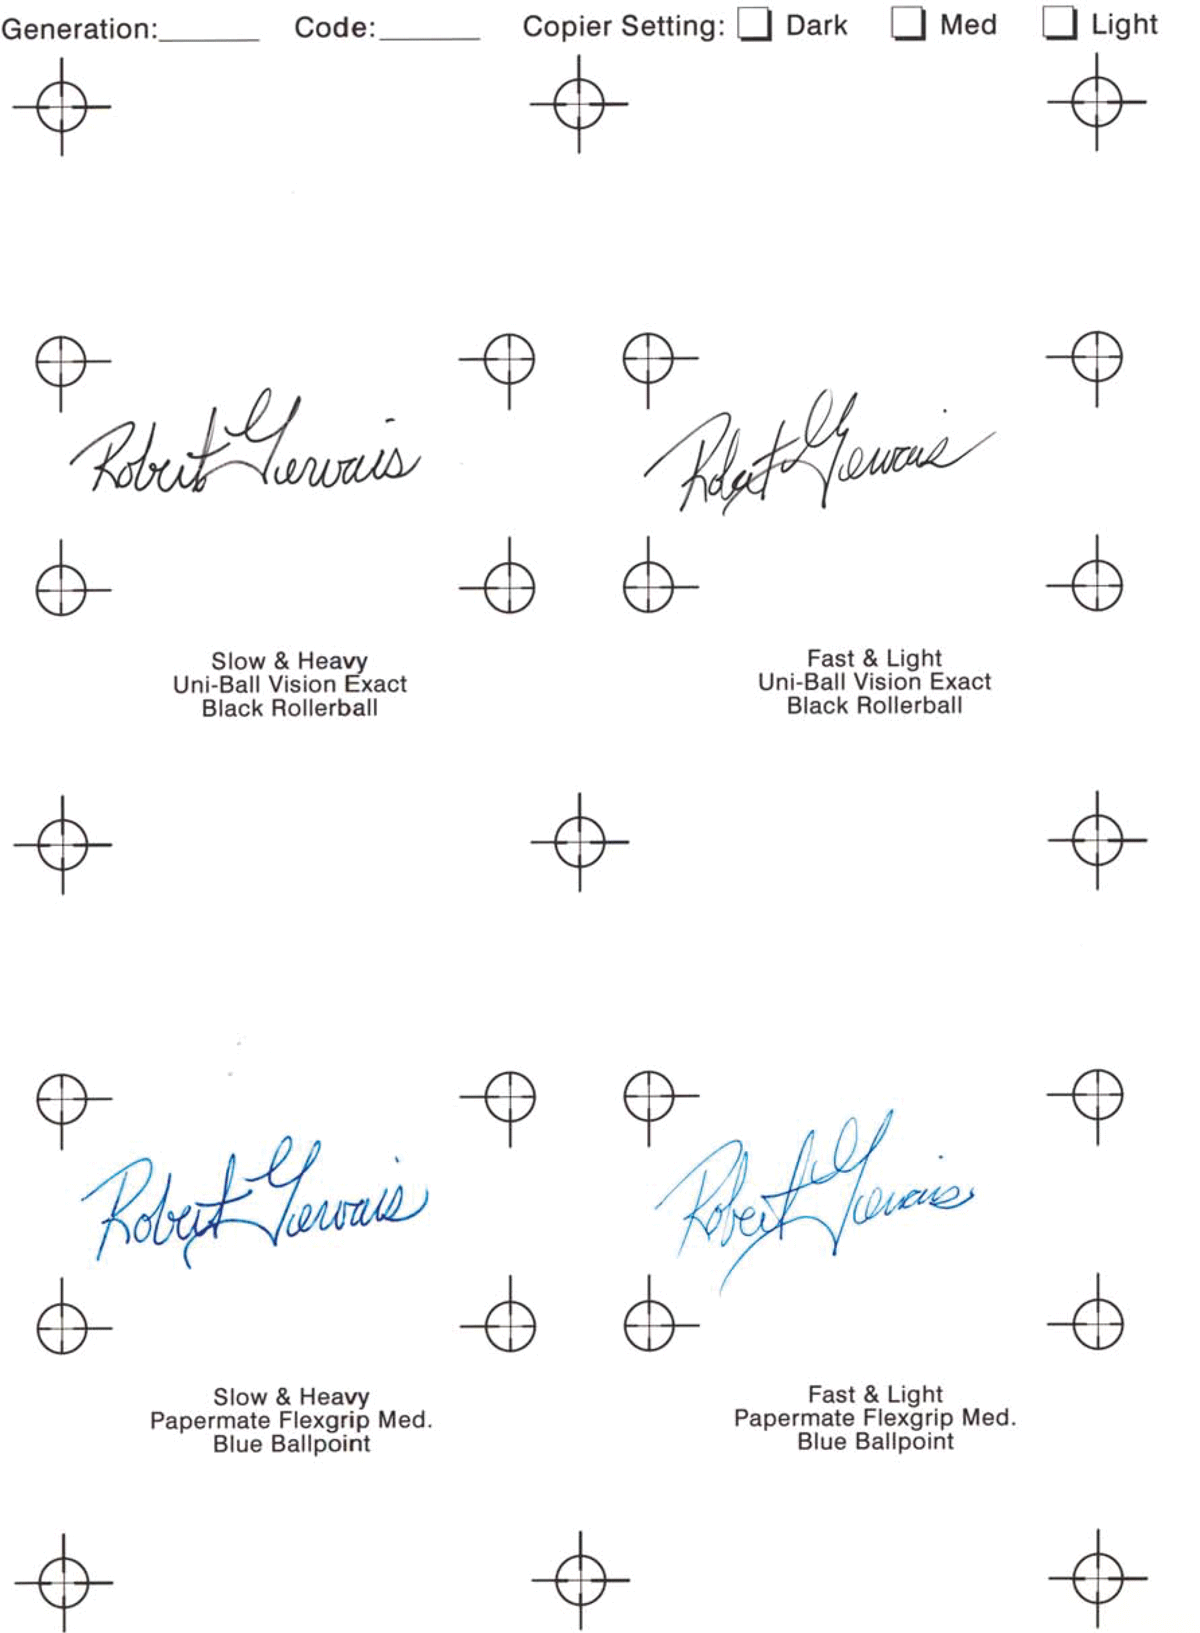
Figure 1
A reduced image of the master sheet from which all of the photocopies were created. The machine code and density setting were written in on the first copy, whereas the generation number was applied only after the next generation was reproduced.
The master sheet was then reproduced on each of seven different photocopiers – see Table 1. Successive copies were produced from each sample, extending 20 generations from the original. This procedure was repeated for each machine using the light, medium and dark density setting. A breakdown of the overall process is illustrated in Figure 2. In summary, [4 signatures] x [7 photocopiers] x [3 settings] x [20 generations] had the potential to yield 1680 images. In some cases, however, the copies were either too light or too dark to produce 20 generations of useful images. Each photocopy was then scanned into Adobe Photoshop® to create image stacks, and ultimately individual images, for each series.
Table 1
Photocopiers Used
| Code | Photocopier Model | Technology | Paper Feed |
|---|---|---|---|
| N/A | Minolta® 2152EP* | Analog | Top First |
| 1 | Xerox® WorkCentre Pro 412 | Digital | Top First |
| 1027–1 | Minolta® CSPro EP5050 | Analog | Side First |
| 1027–2 | Panasonic® DP-150FX | Digital | Top First |
| 1027–3 | Panasonic® DP-3000 | Digital | Side First |
| 1027–4 | Panasonic® FP-7818 | Analog | Side First |
| 1027–5 | Panasonic® FP-7750 | Analog | Side First |
| 1027–6 | Sharp® AR-205 | Digital | Side First |
[i] *Only used in the trial run.
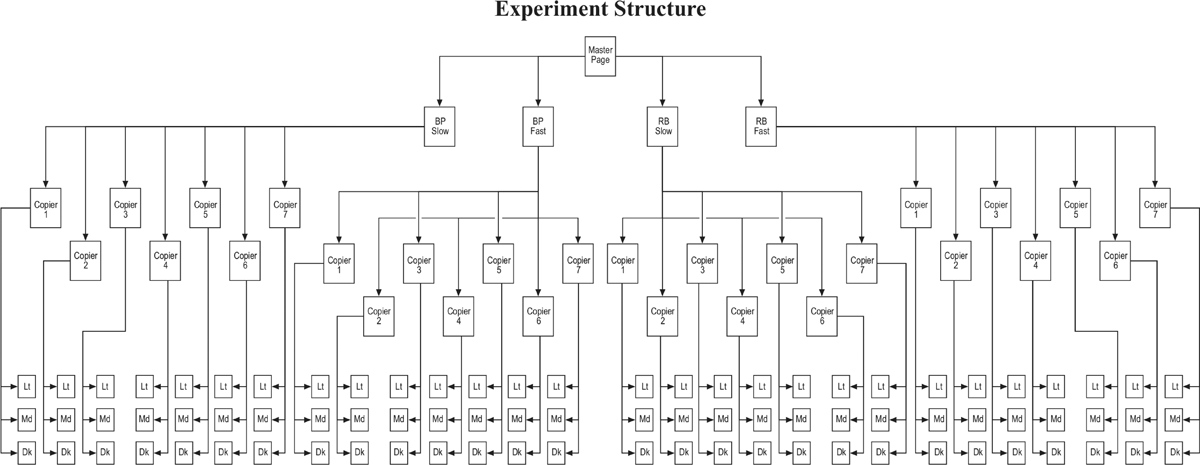
Figure 2
The master sheet bears four original signatures. Each signature was reproduced on seven different photocopiers. Each copy was successively copied to extend twenty generations from the original. This was repeated for three different density settings on each machine (light, medium and dark). In total, 84 permutations x 20 generations produces 1680 individual copies. This structure does not include the initial trial run, nor does it take into account instances in which the image either failed to reproduce (too light) before the twentieth copy, or the page became too dark to complete the series.
Individual Signatures
To facilitate the selection of the various parameters involved, as well as providing a simple method of “flipping through” the twenty generations, a Graphical User Interface (GUI) was designed (Figure 3). Through this GUI the user may choose which pen, writing speed, machine and setting they wish to view. Having done so, a simple leftto-right motion of the mouse flips through all of the images in the series – from the original to the twentieth generation photocopy (or highest available). Each signature series was examined in this manner.
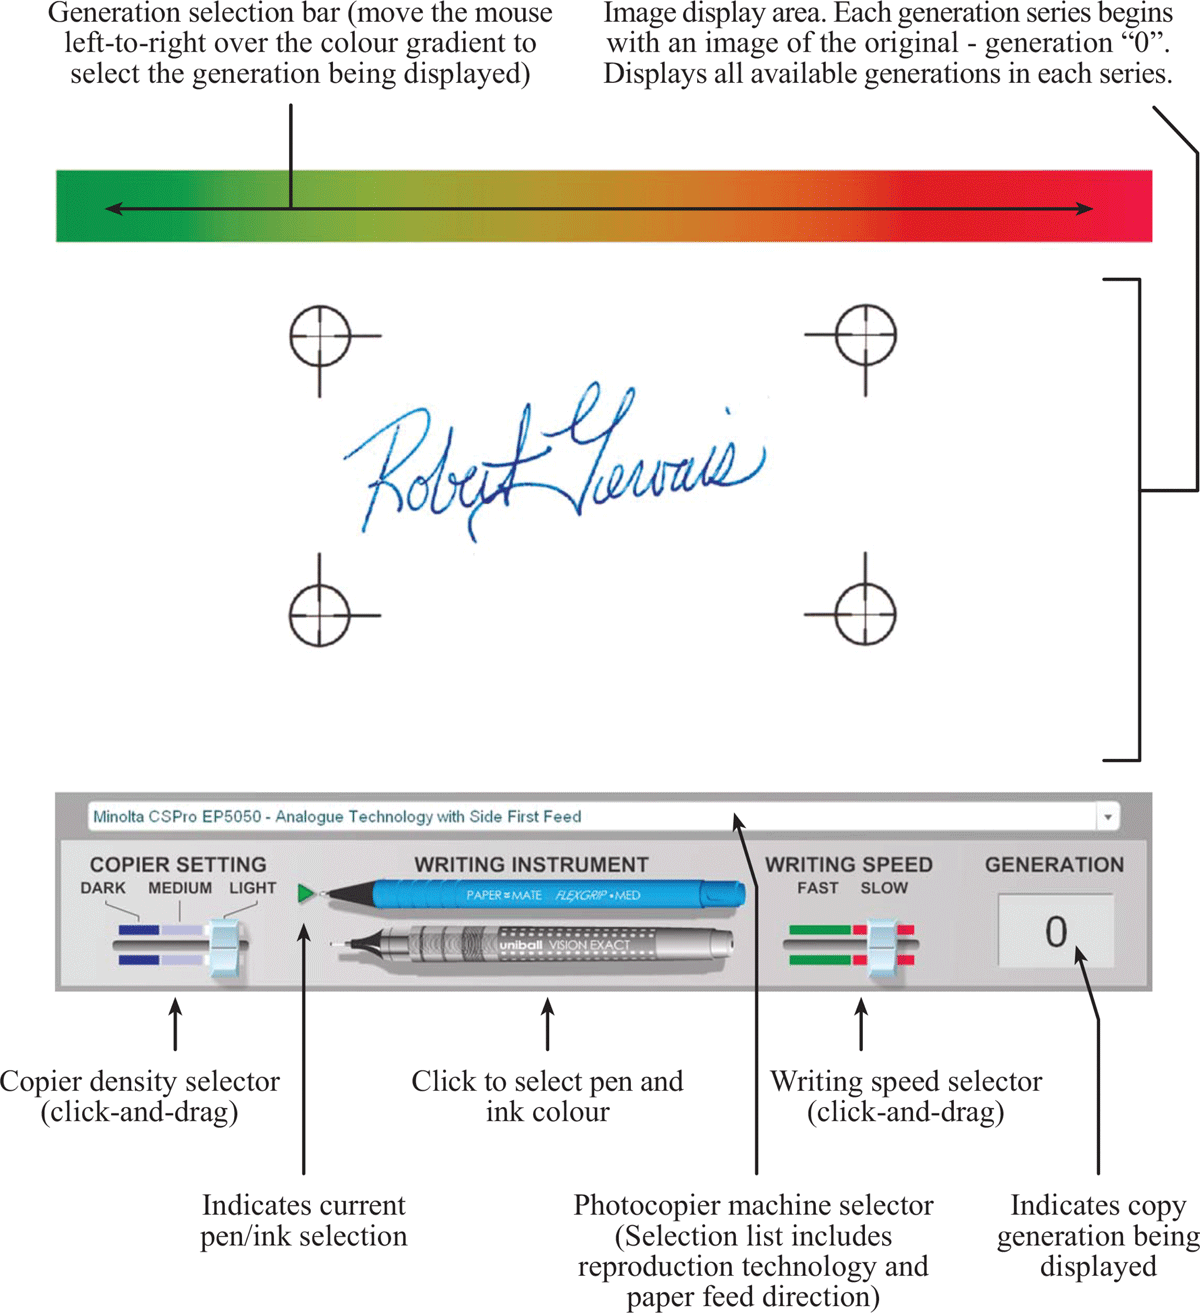
Figure 3
The Graphical User Interface (GUI) designed to allow easy selection of the various copying parameters and display of each copy generation series. Right-clicking in the image display area permits access to additional controls.
Overall Page
The same general procedure was used to assess the full-page image of each copy generation. Once again a GUI was used to “flip through” successive generations of full-page copies.
Observations
A distinction should be made between image “degradation” and “distortion”. The former refers to a failure to accurately and completely reproduce the original document, usually resulting in some degree of legibility loss. Image degradation may also take the form of “blooming” (thickening) or “beading” of the information being reproduced (Figure 4).
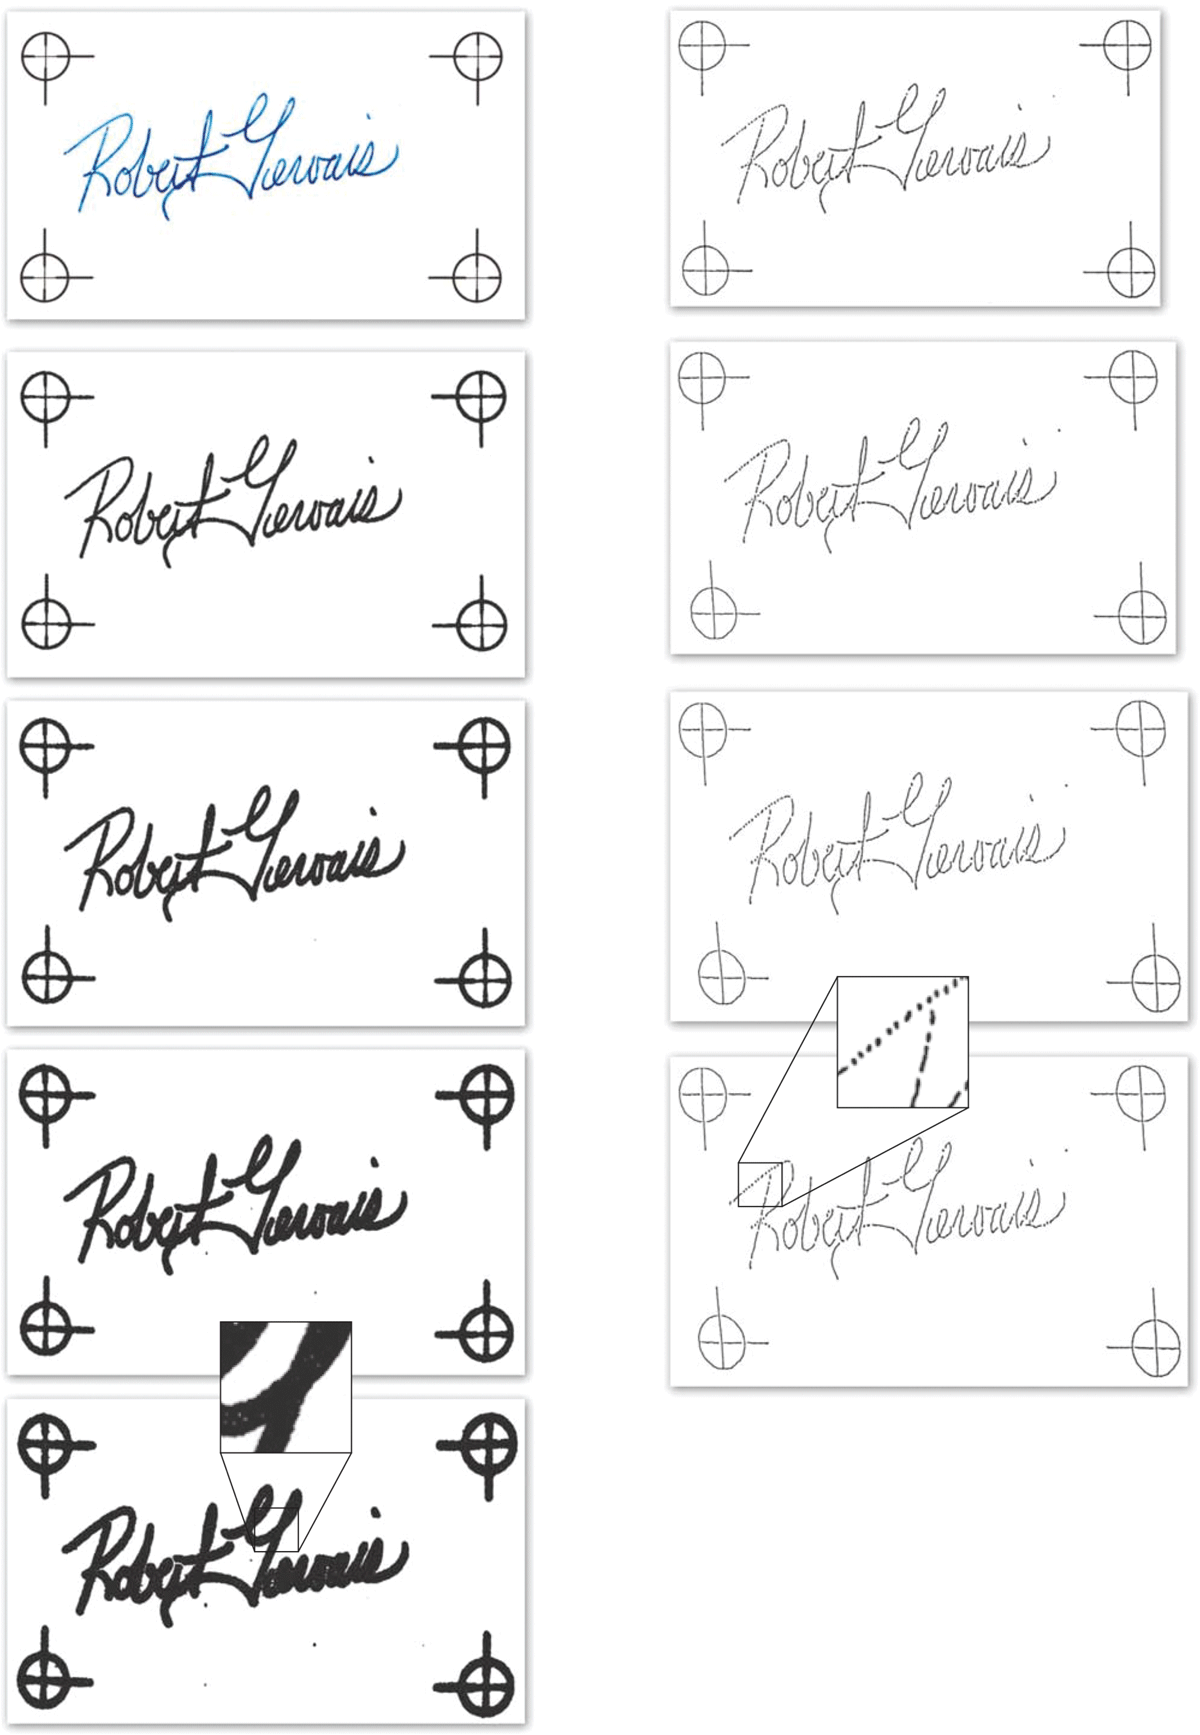
Figure 4
The column of images on the left shows the original signature followed by generations 5, 10, 15 and 20 from the Xerox® WCP412. The copies from this machine showed “blooming”—progressive thickening of all marks. Those from the Panasonic® DP-150FX showed “beading”—a breakup of lines to form a series of dots.
Distortion, on the other hand, refers to variations in size and/or shape that may, or may not, impact on the legibility of the material. For example, an enlargement of 2% would be considered a distortion. Further distinctions can be made between “linear” and “non-linear” distortion. The former affects the image uniformly across the entire area, whereas the latter does not.
The following observations were made:
Xerox WorkCentre® Pro 412: For every setting and for each signature this machine produced thickening of the signature stroke over successive generations. Of particular note were the early generation copies of the slow, blue signature using light and medium settings. In these situations the ink stroke took on an appearance very much consistent with the “train track” effect often produced by gel pens (Figure 5). Significant non-linear distortion can be seen as the top-right corner of the page stretches upwards and to the right.
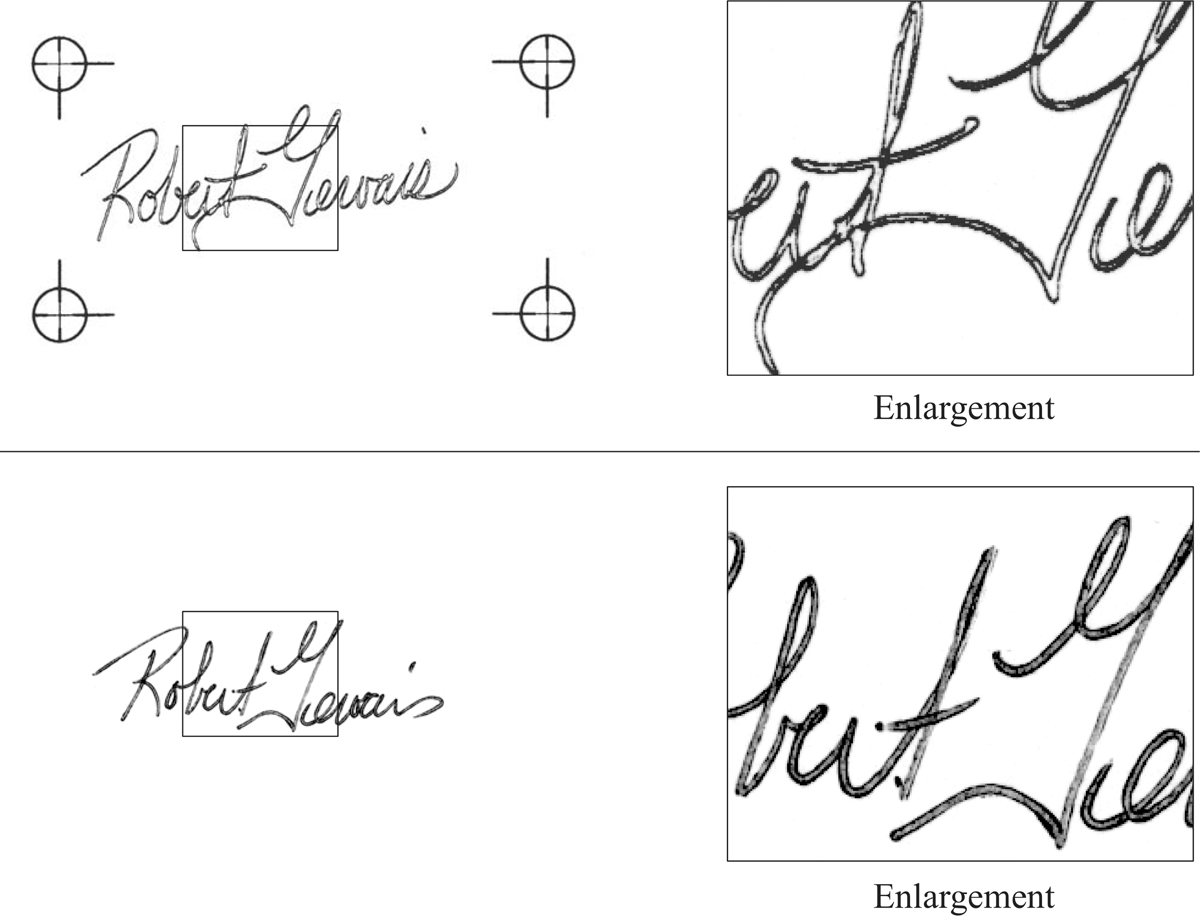
Figure 5
The upper images show a first generation photocopy of a blue ballpoint signature produced by the Xerox WorkCentre Pro 412. This digital machine produced images that very closely approximate the line morphology seen in the product of some gel pens (lower image). Consequently, qualification is called for when identifying a writing as having been produced by a gel pen based on the assessment of a photocopy.
Minolta® CSPro EP5050: On the light setting, this machine produced break-up and beading almost exclusively in the vertical elements, leaving the horizontal portions largely intact. Reproduction of the blue signatures is significantly inferior to that of the black on this setting as well. Using the dark setting, background noise completely blackens the page in as few as five generations. A distinctive “halo” effect is produced in which, despite severe blackening of the page in general, white areas closely surround the signature and reference marks. Localized distortion is relatively mild (only a small enlargement factor), but a significant vertical undulation is produced that spans the entire height of the page.
Panasonic® DP-150FX: When using the light and medium settings, breakup and beading are pronounced in the horizontal elements, leaving the vertical portions relatively intact. On this setting, reproduction of the blue signatures is considerably worse than those in black. The beading effect also manifests itself as extremely tremulous strokes, particularly for some of the black signature copies. Even the background noise produced using the dark setting takes the form of distinct beads. Overall page distortion is extreme, involving considerable enlargement and a tendency for the lower-right corner of the page to stretch down and to the right.
Panasonic® DP-3000: The degree of non-linear distortion produced by this machine far exceeds most of the others. On all settings the signatures on the left remain relatively unchanged vertically, but enlarge horizontally. This is in stark contrast to the signatures on the right, which are significantly reduced horizontally. The fast, black signature using the dark setting provides the most obvious evidence of this effect. Figure 6 illustrates the extent and nature of the distortion by contrasting the upper portion of the first, tenth and twentieth generation copies.
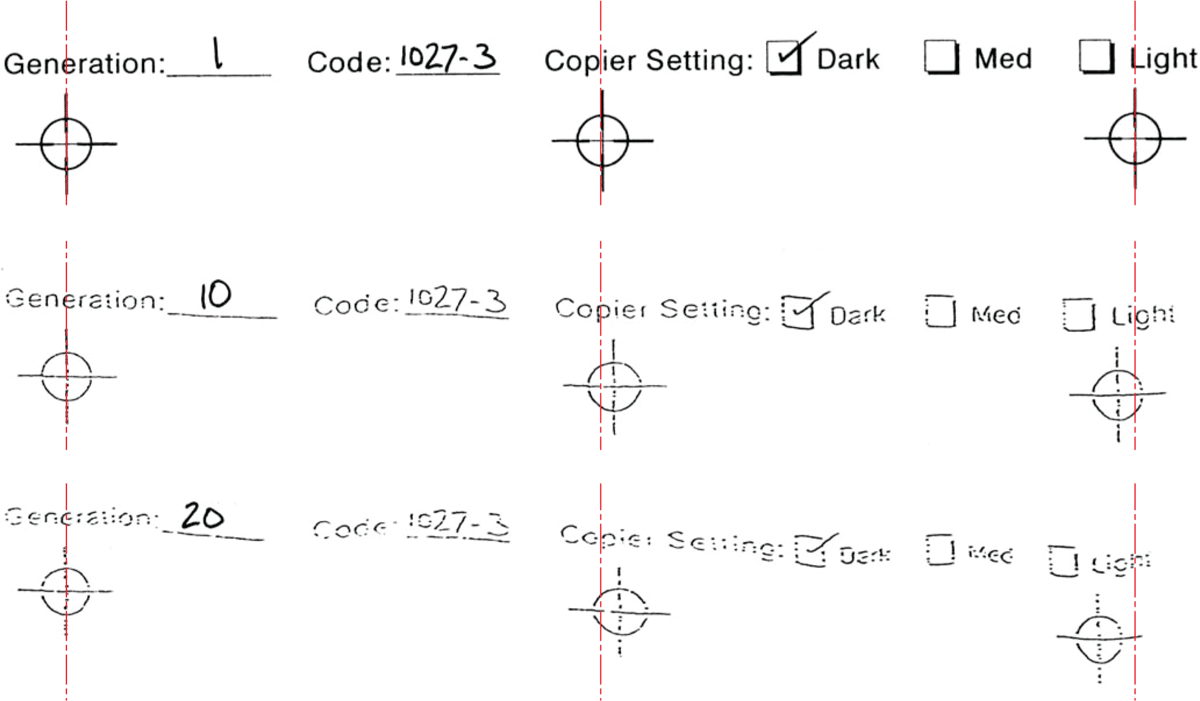
Figure 6
The images above are taken from the first, tenth and twentieth generation photocopies using the Panasonic DP-3000. The non-linear distortions are extreme in every aspect and include vertical undulations as well as horizontal displacements. Note that the spacing between the left reference marks has increased, while those on the right have decreased.
Panasonic® FP-7818: Reproduction strength is significantly better on the upper half of the page than the lower. The light setting produced low quality copies – cutting the series short for every signature. Using the medium setting, break-up and loss was far more prevalent in the vertical elements of the image, often resulting in only horizontal portions remaining by the end of the series. The dark setting provides a good example of a traveling trash mark in which the movement results from image enlargement. Overall distortion is non-linear and results in a vertical undulation.
Panasonic® FP-7750: For the light and medium settings, the majority of image break-up points occur at the intersection of horizontal and vertical components, with the vertical element always failing and the horizontal remaining intact. This effect can also be seen under the dark setting, though the thickening of the strokes largely prevents the break-up from completing. Overall distortion primarily takes the form of a vertical skew, though the upper portion of the page also undergoes a horizontal enlargement.
Sharp® AR-205: With the exception of the Panasonic® DP-3000, this machine produced nonlinear distortion far beyond all of the others. The nature of the scaling distortion (i.e. different on the left of the page than on the right) is strikingly similar between these two copiers.
Conclusions
Contrary to preliminary findings, based on the trial run, which involved only two copiers (one digital, the other analog), consistent class characteristics were not found separating the product of digital machines from analog. While some unique reproduction traits were observed, such as the “train track” effect produced by the Xerox, and a tendency for image breakup to occur faster in those elements that are perpendicular to the paper feed direction, this project does not include a sufficiently large sampling of copiers to definitively associate these phenomenon with a given technology or other parameter.
In general, none of the copies produced within the first four generations showed significant deformation or degradation compared to the originals – when a suitable density setting was used. This was true even on those machines that introduced extreme distortions over the course of 20 generations. When considering the use of photocopies in an examination, as either questioned or specimen material, a sound familiarity with the nature of the changes introduced during this type of reproduction will help the document examiner assess whether or not the copy is too far removed from the original to be suitable.
There are also some serious cautions that can be gleaned from this work. The first, illustrated in Figure 5, regards the identification of the product of gel pens. A further consideration should be given to the steps involved in associating cutand-paste or traced signatures with their model. It is not uncommon in such cases for either the questioned or sample signature(s) to be in the form of a photocopy – often of an unknown generation. As seen in Figure 7, a simple overlay may not provide a convincing match. There is little doubt that a qualified document examiner would recognize the correlation, but they must also be prepared to demonstrate why the discrepancy exists – a task that may be made easier through the use of the GUI produced in this work.
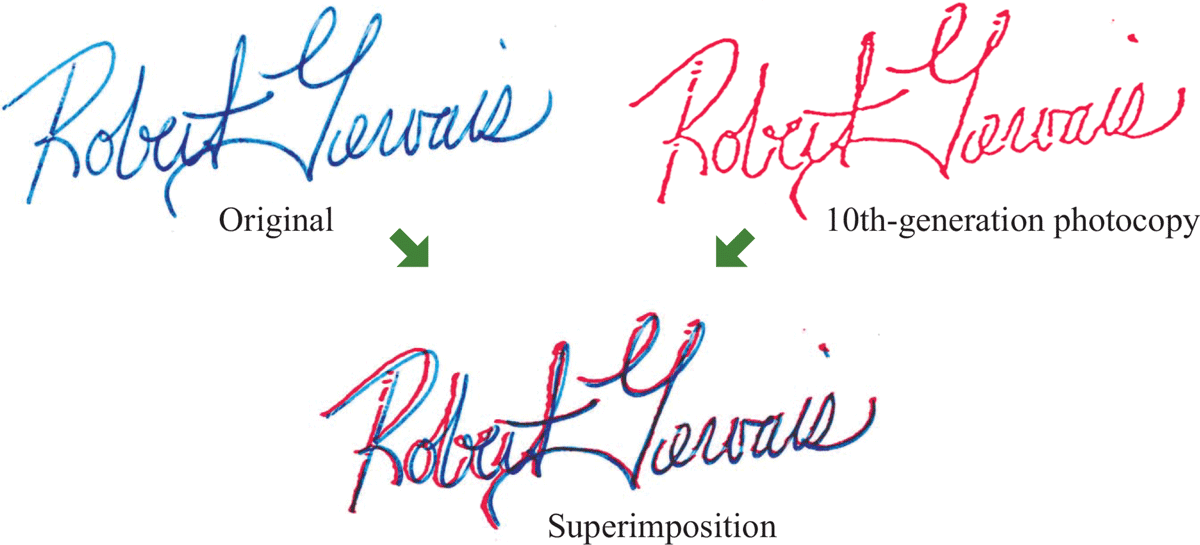
Figure 7
In cut-and-paste or tracing cases the degree of non-linear distortion introduced into later-generation photocopies may render superimpositions of the original and model signatures less than convincing.
It should be noted that the study was performed on a limited number of copiers and was never intended to represent a quantitative assessment of copier distortion. Rather, it is intended to illustrate the nature and extent of distortion/degradation that is possible. It is for this reason that specific measurements are not provided as they are of no value as class characteristics.
Rather than include a large number of illustrations to show “blooming”, “halo effects”, “travelling trash marks”, etc., the full graphical user interface and its related data are available for download, allowing the user to visually inspect the results at their own leisure as well as review/demonstrate them as needed.
Notes
[2] Supplemental materials for this paper are at: http://asqde.org/journal/subscribers/subscribers.html Please contact Journal Editor if difficulties are encountered in login