
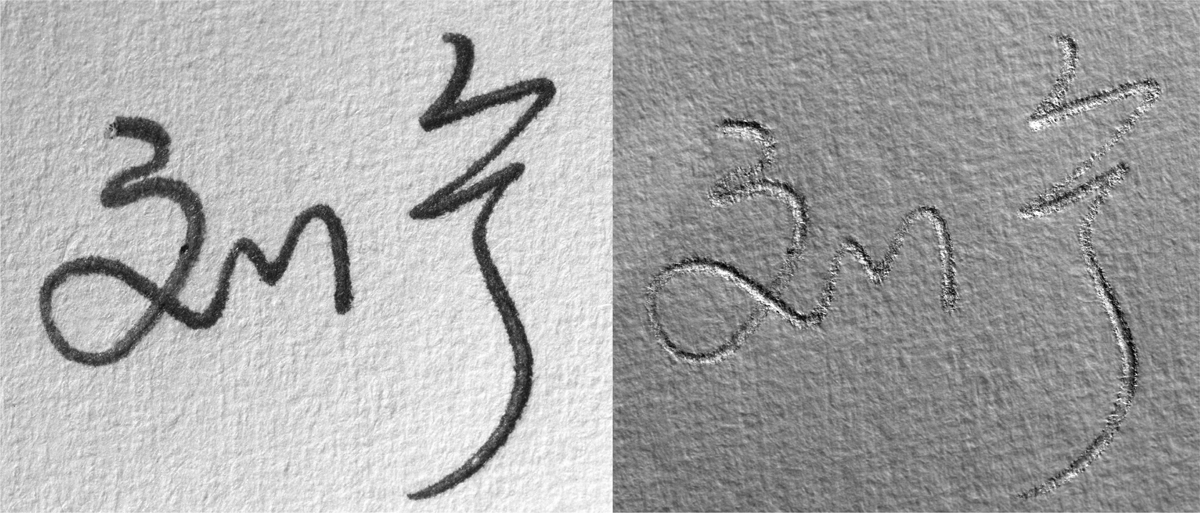
Figure 1
One of the signature sample in this study. The left is a common digital photograph; the right is the RTI normal visualization image (converted into grayscale and enhanced in contrast) of the left signature.
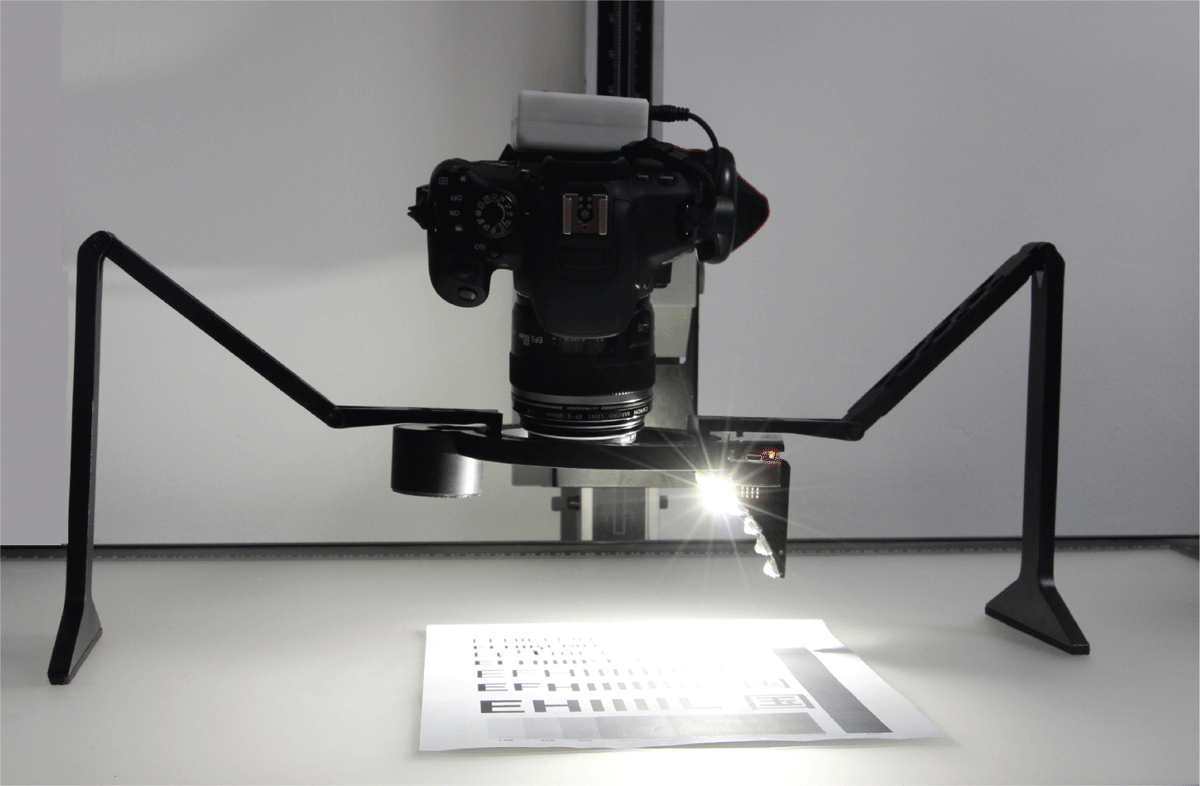
Figure 2
The automatic acquisition system in this study.
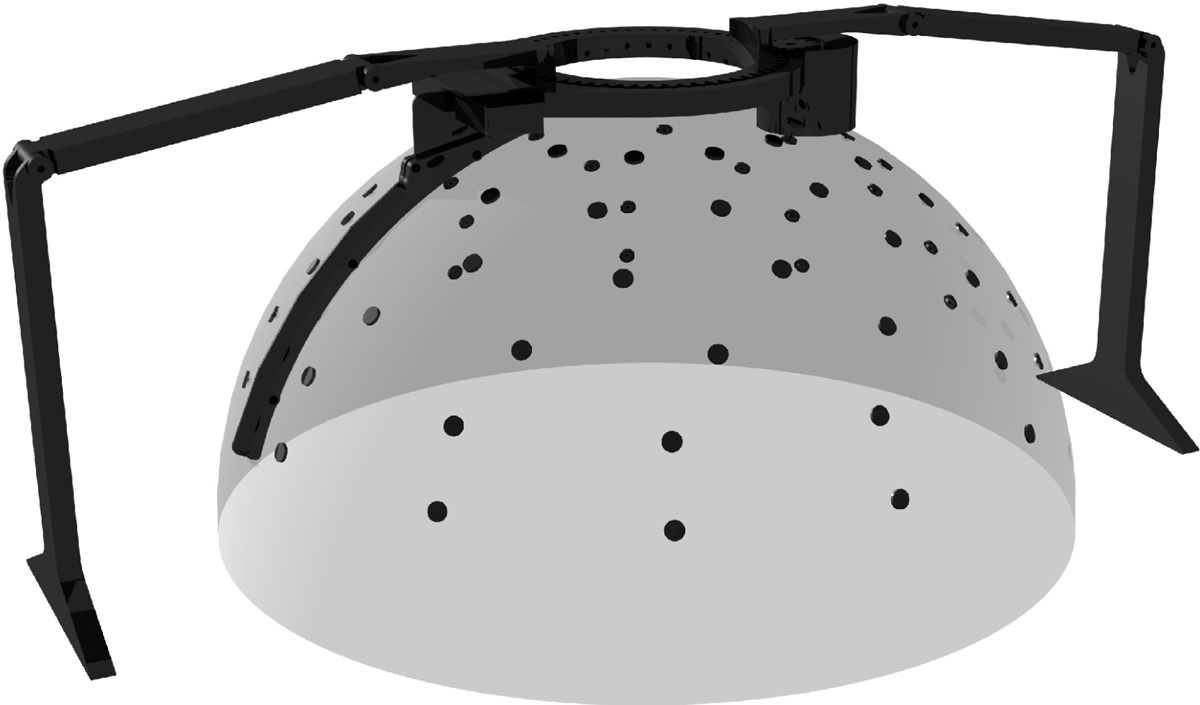
Figure 3
The schematic layout of the light dome formed by the acquisition device developed by the authors.
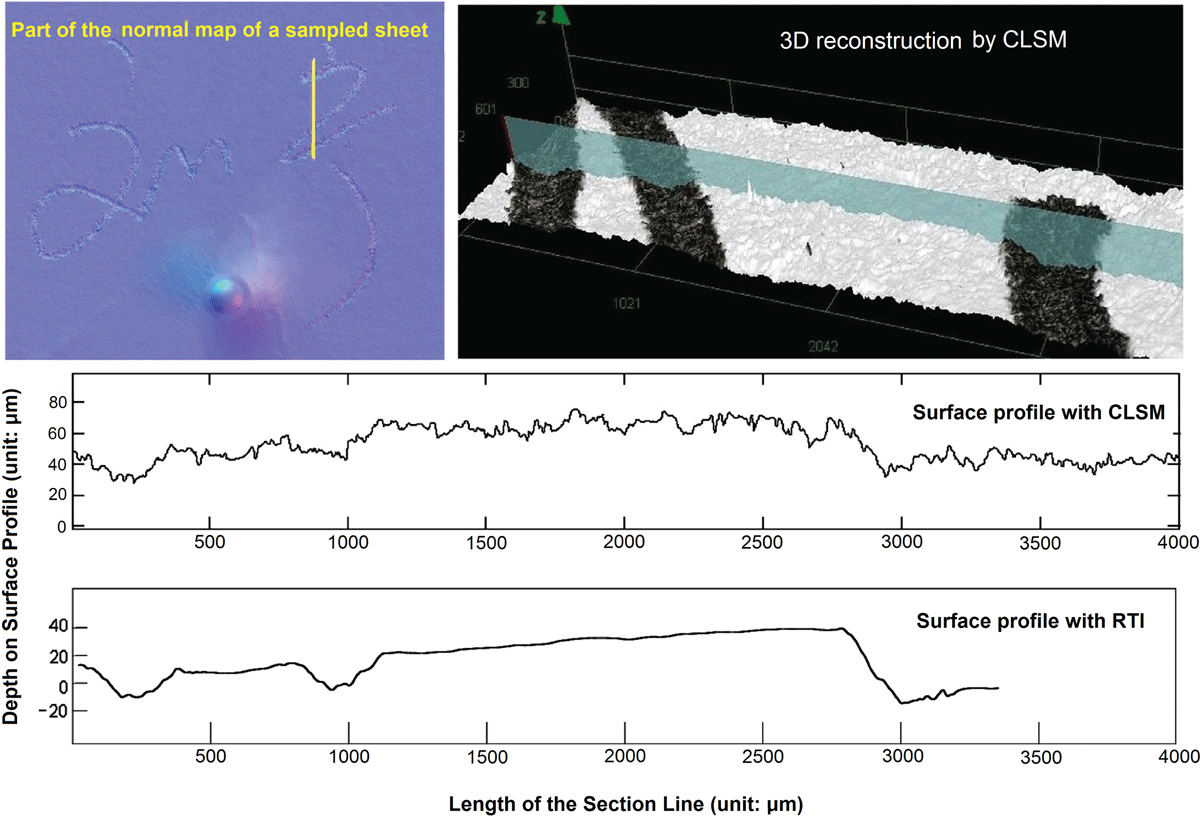
Figure 4
The comparison between one of the surface profiles derived from RTI and that generated from CLSM. The upper left picture is the normal map of the RTI representation captured with 80 cm light distance, in which the yellow line is the section line profiled in the two graphs below. The upper right picture displays the 3D reconstruction of the section line with the CLSM. The ratio of the XY axis of the graphs is 1:5 for enhancing the visual effect of depth.
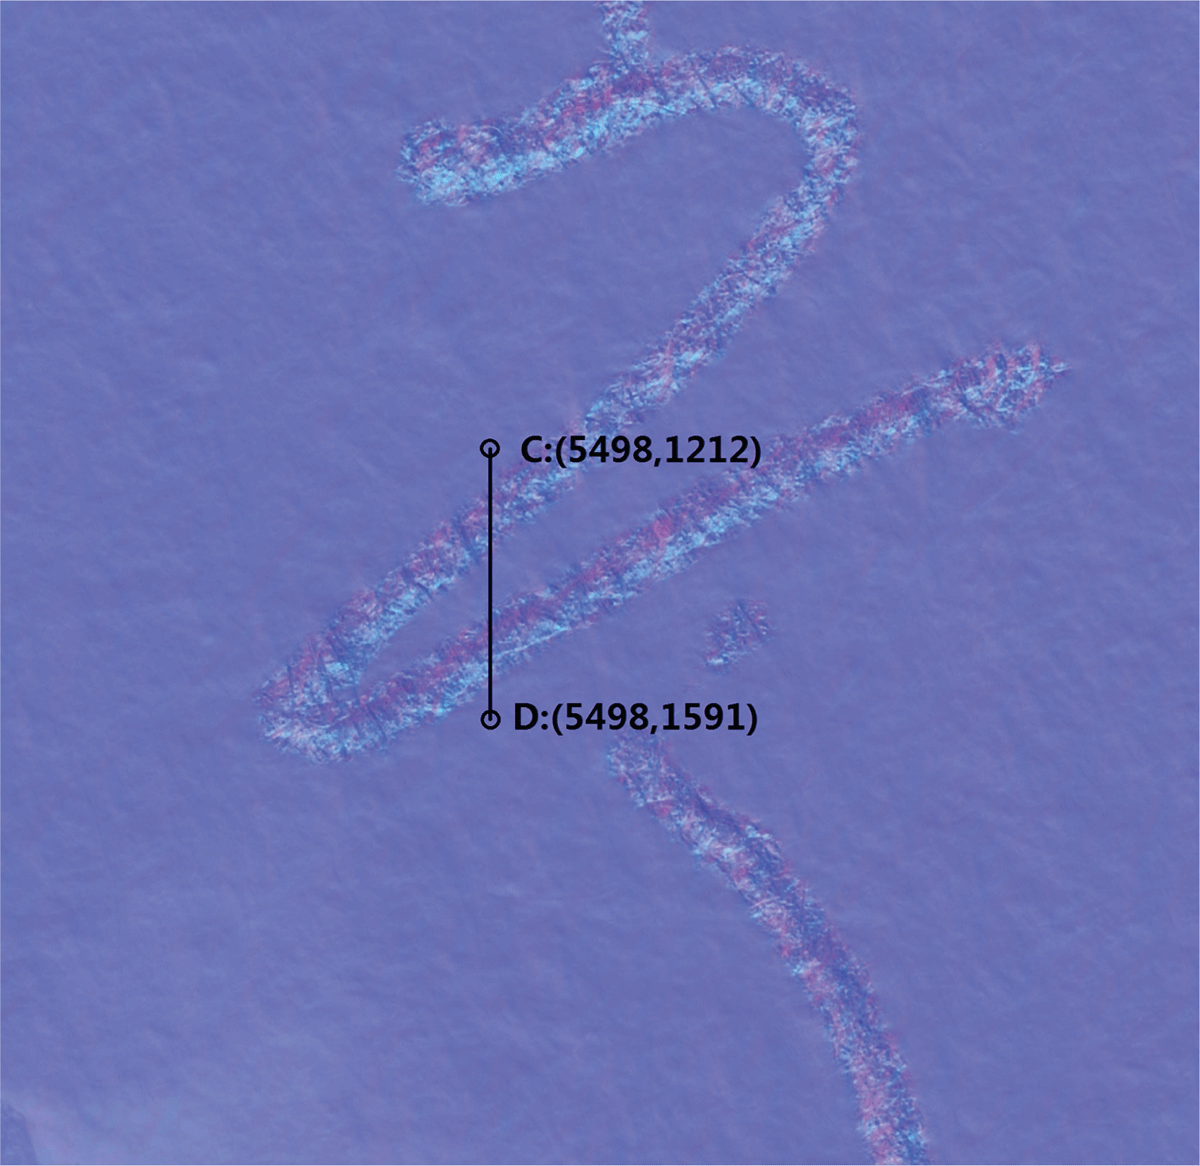
Figure 5
The part of the normal map of a signature sample. The line CD was the same section line porfiled in Figure 6, 7, and 8.

Figure 6
An example of the quantitative comparison between the RTI representations of the same signature captured (with the 80cm light distance) in different formats.

Figure 7
An example of the quantitative comparison between the RTI representations of the same image stack (with the 80cm light distance) fitted with different fitters.

Figure 8
An example of the quantitative comparison between the RTI representations of the same signature captured with different light distances.
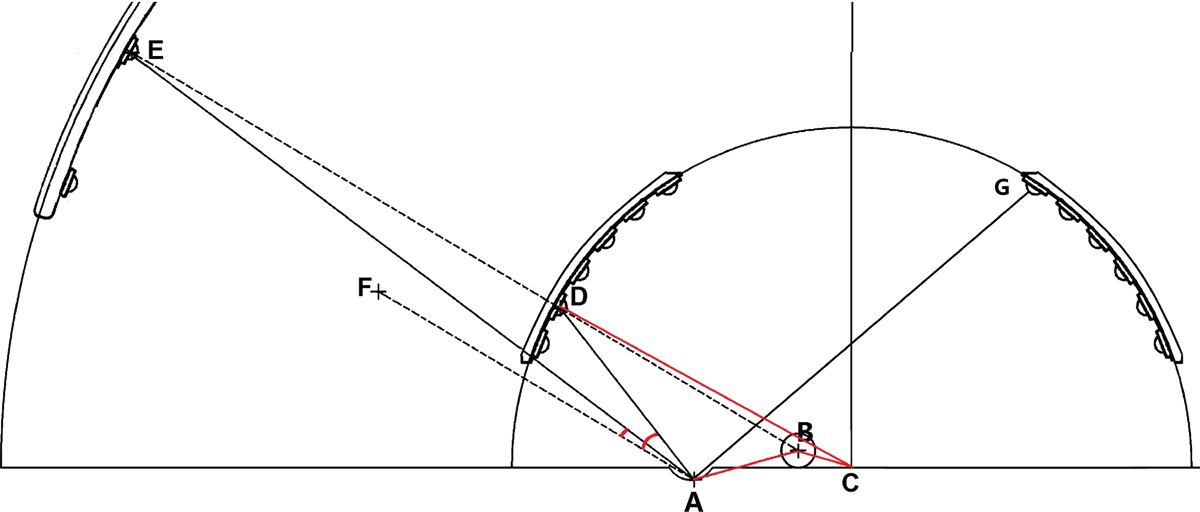
Figure 9
The schematic diagram of an inherent error of RTI. Point C is the center of the field. Point B is the center of the specular sphere. Point A is an arbitrary pixel of the subject. The actual light directions on the pixel A could be on the lines of DA, EA, and GA. When light position D or E is fired, the light vector estimated for the pixel A is parallel to the line DB/EB on which the light vector on the sphere is located, namely, on the line FA. Comparing between the different light distances, the deviated angle (∠FAD) caused by the shorter one is bigger than that (∠FAE) caused by the longer one.
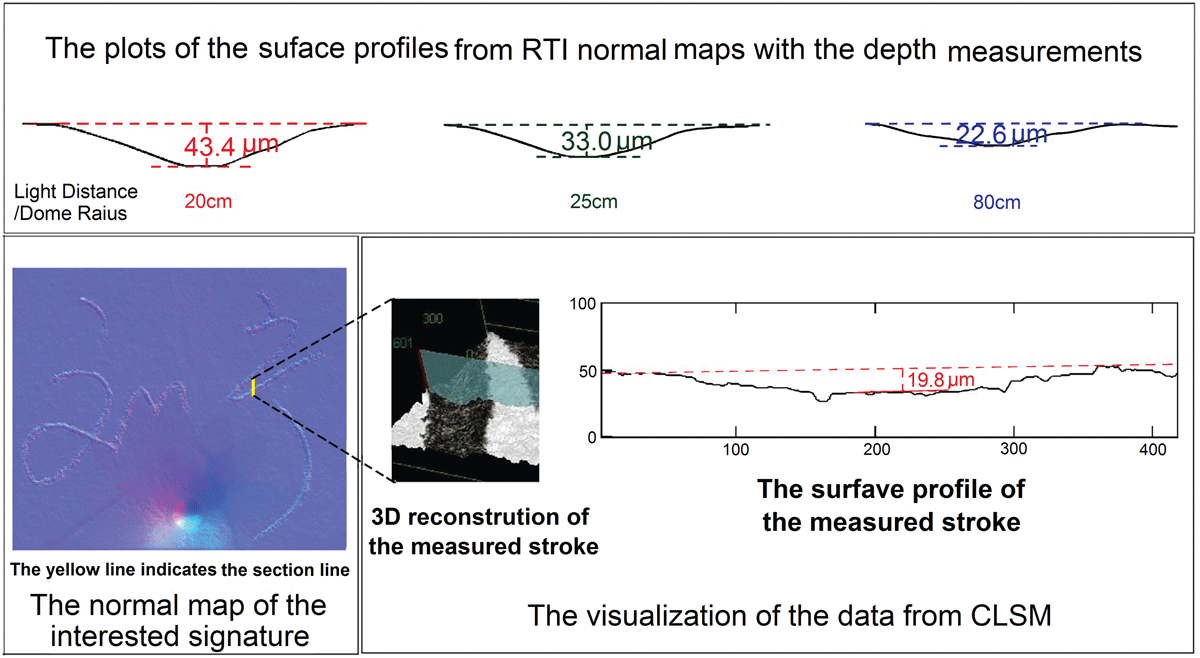
Figure 10
The comparisons of the measurements obtained from CLAM and the RTI normal maps.
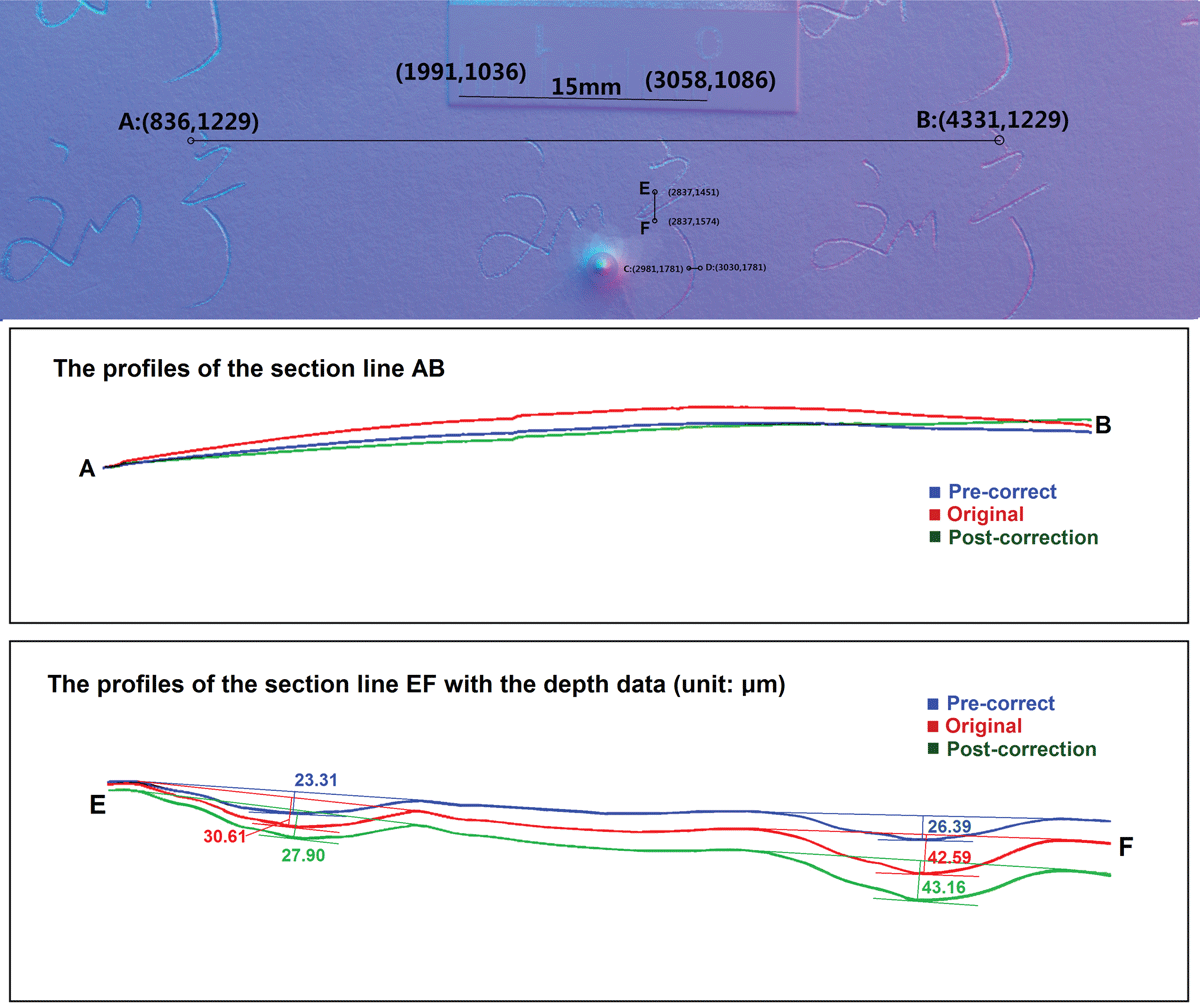
Figure 11
The quantitative comparison of pre- and post-correction ways. The upper picture is a normal map that was generated from the images taken with 25 cm light distance and stored in RAW format.