
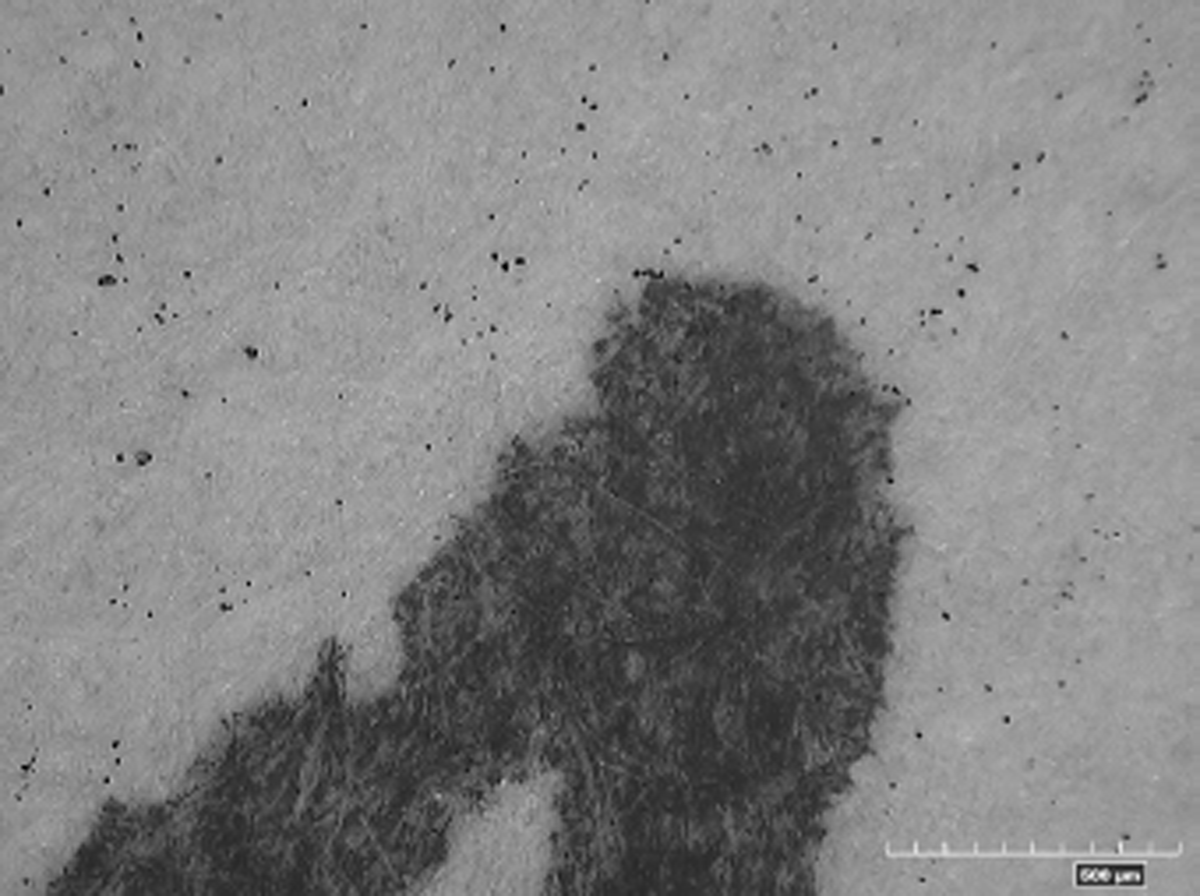
Figure 1
Toner particles in the region without the printed image surrounding a handwritten stroke.
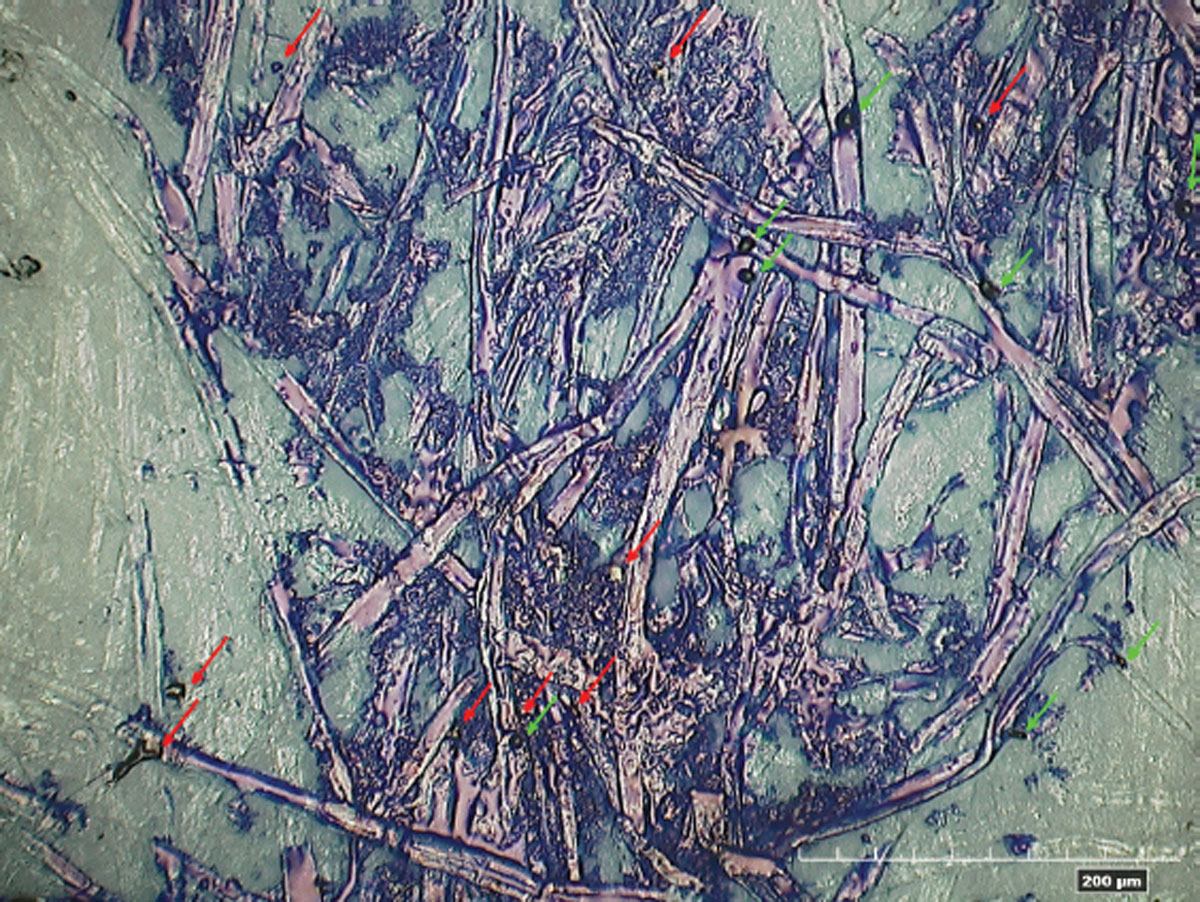
Figure 2
Handwritten stroke detail with toner particles -some particles were printed before (red arrows), others after the stroke was written (green arrow), mag. 600x.
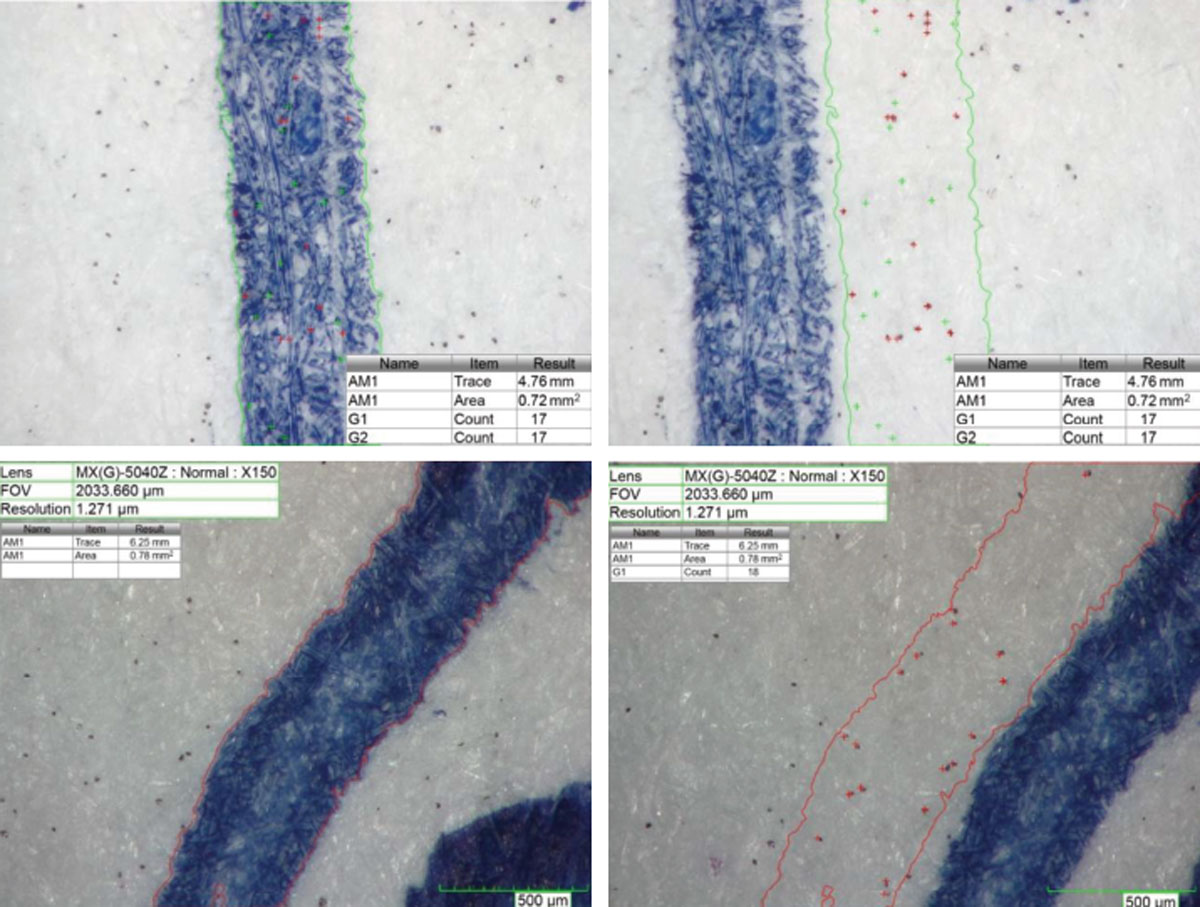
Figure 3
Comparison of toner particle quantity in the region of the stroke and its surroundings. Top—handwriting after print, bottom—handwriting before print. Particles inside the handwritten stroke are marked green, particles inside the same area next to the stroke are marked red.
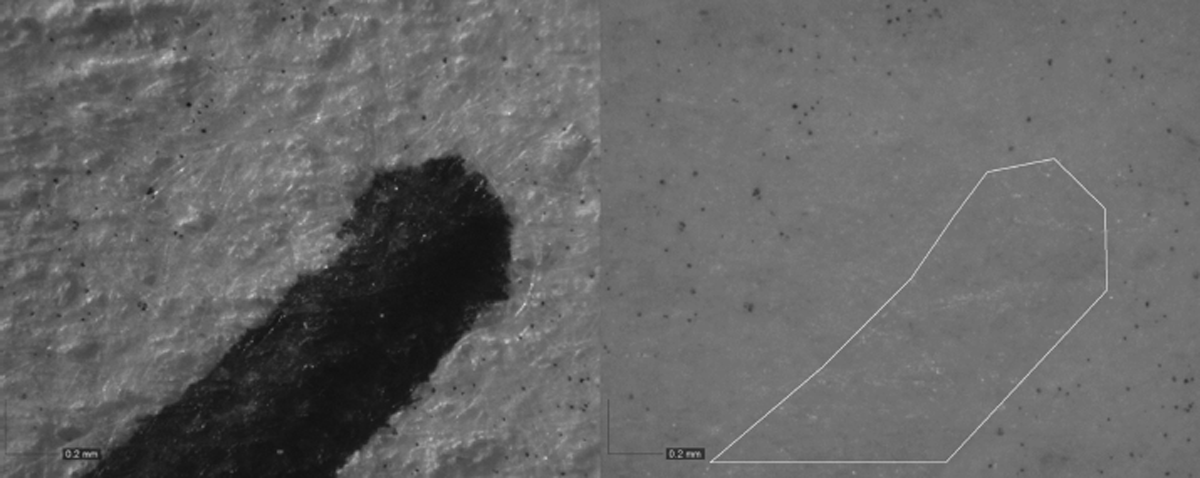
Figure 4
Handwritten stroke in white light (left) and infrared illumination at 940 nm wavelength (right).
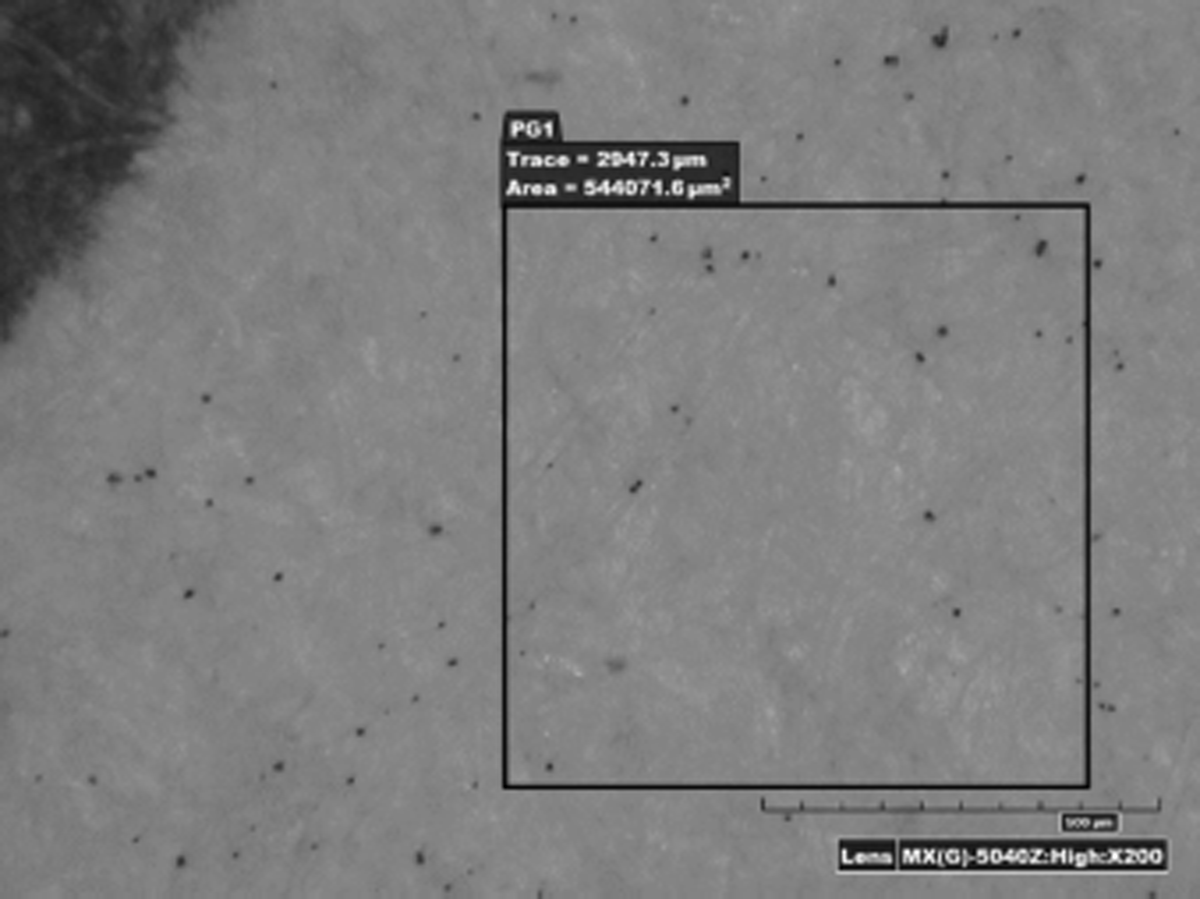
Figure 5
Test for basic blank paper sheet toner particle coverage close to the disputed handwritten entry—the area of 0.5 mm2 must contain at least 10 particles, mag. 200x.
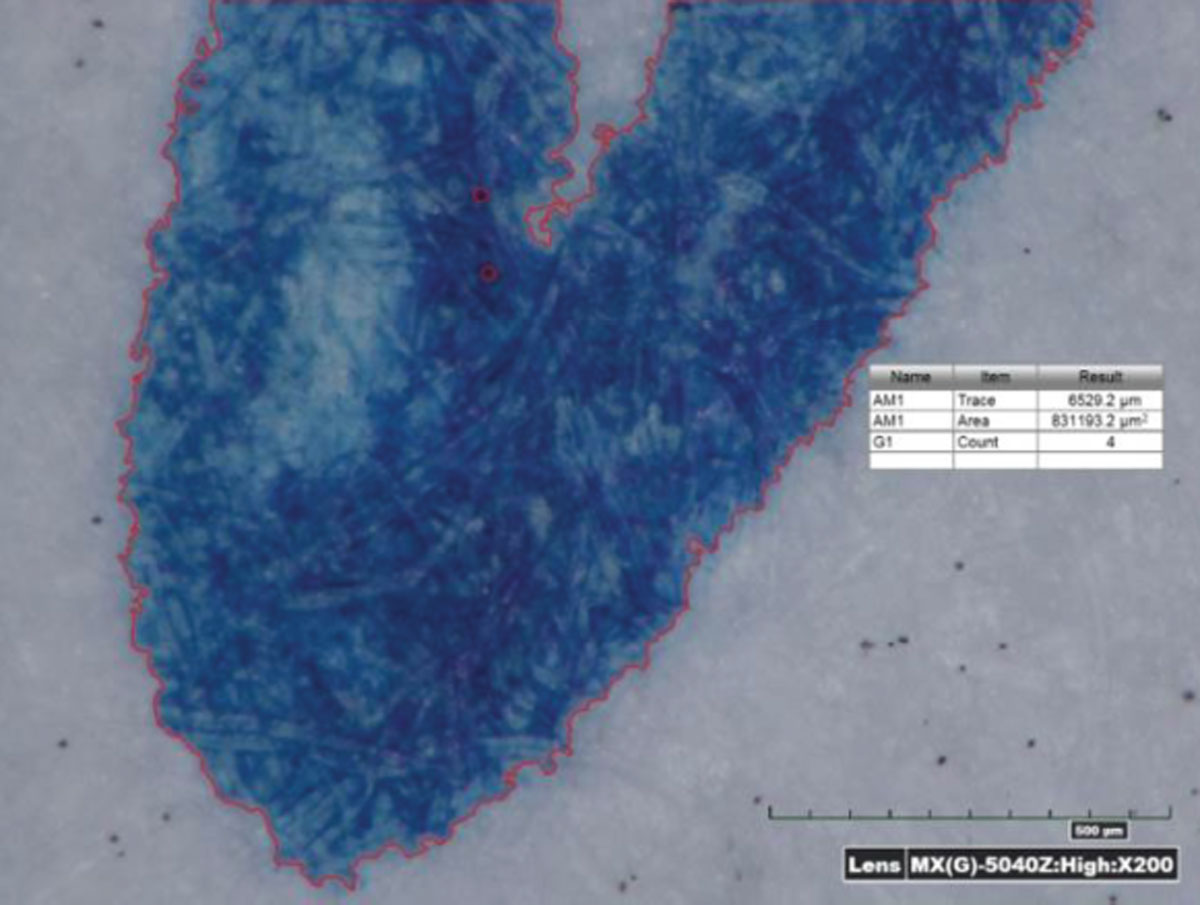
Figure 6
Selected stroke area in visible spectrum. Hirox® microscope, magnification 200x.
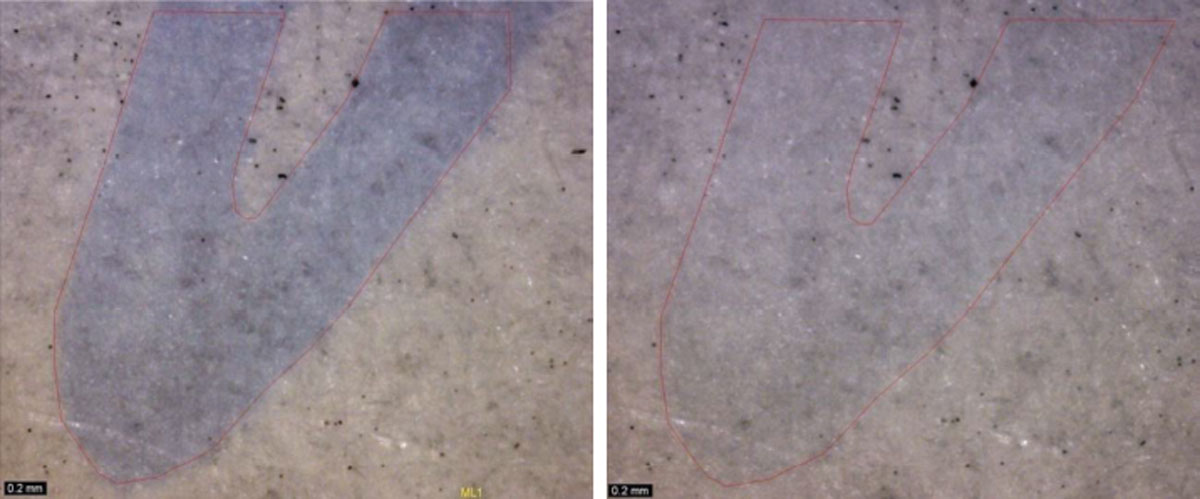
Figure 7
Left—Partially separated image of a handwritten stroke. Dino-Lite® camera, 940 nm IR illumination + VIS, magnification 225x. Right—the same stroke filtered off for convenient toner particle calculation, 940 nm illumination.
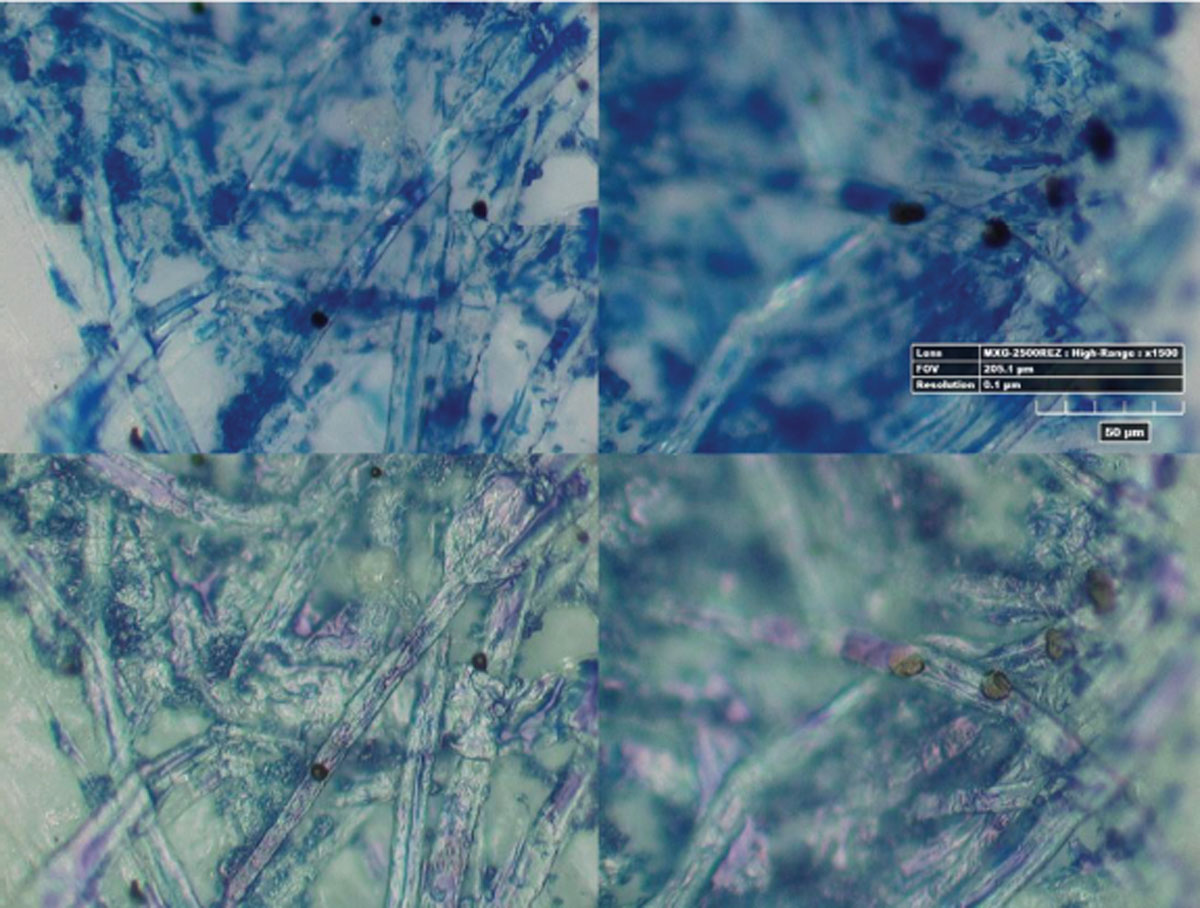
Figure 8
Reference sample of blue writing paste and print intersection, left—writing paste first, right—print first. Top—polarized mode, bottom—coaxial mode.
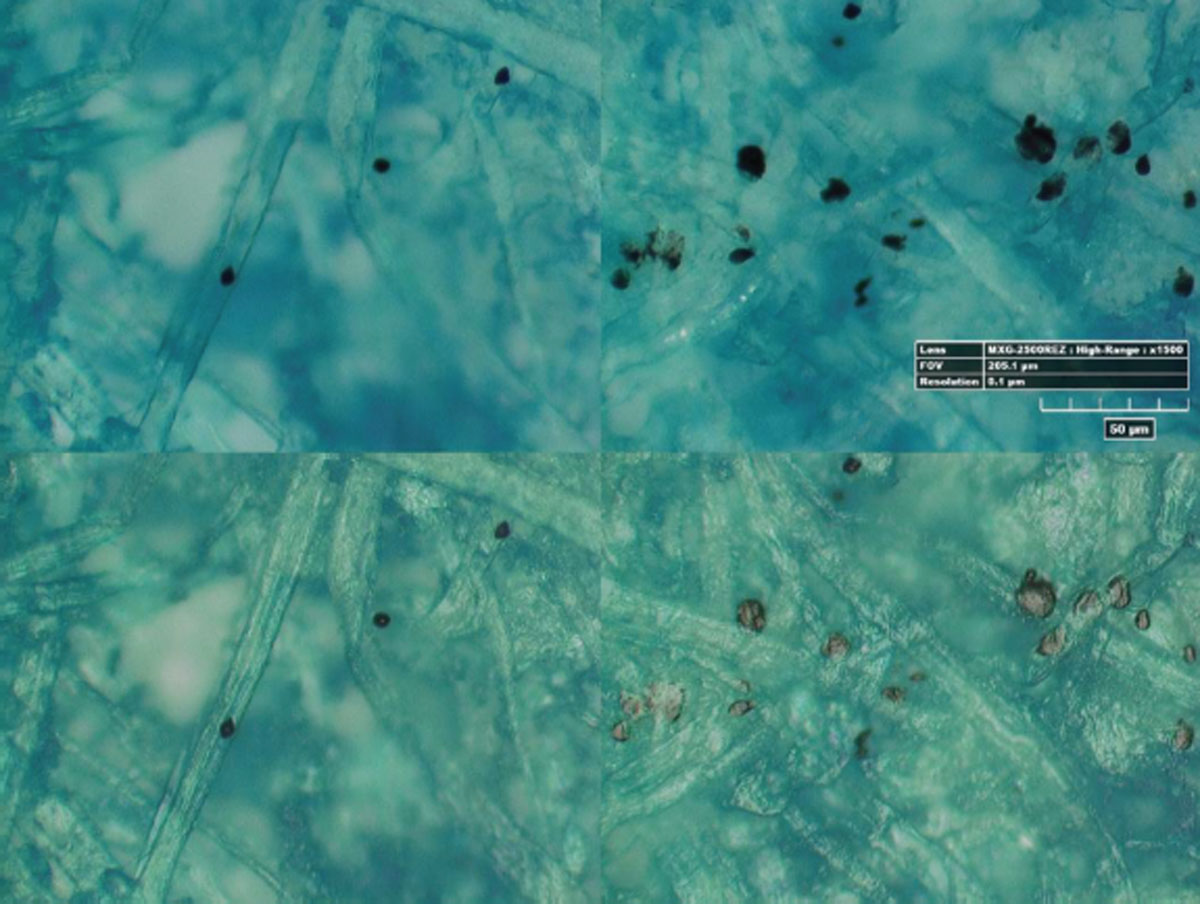
Figure 9
Reference sample of blue ink and print intersection, left—ink first, right—print first. Top—polarized mode, bottom—coaxial mode.
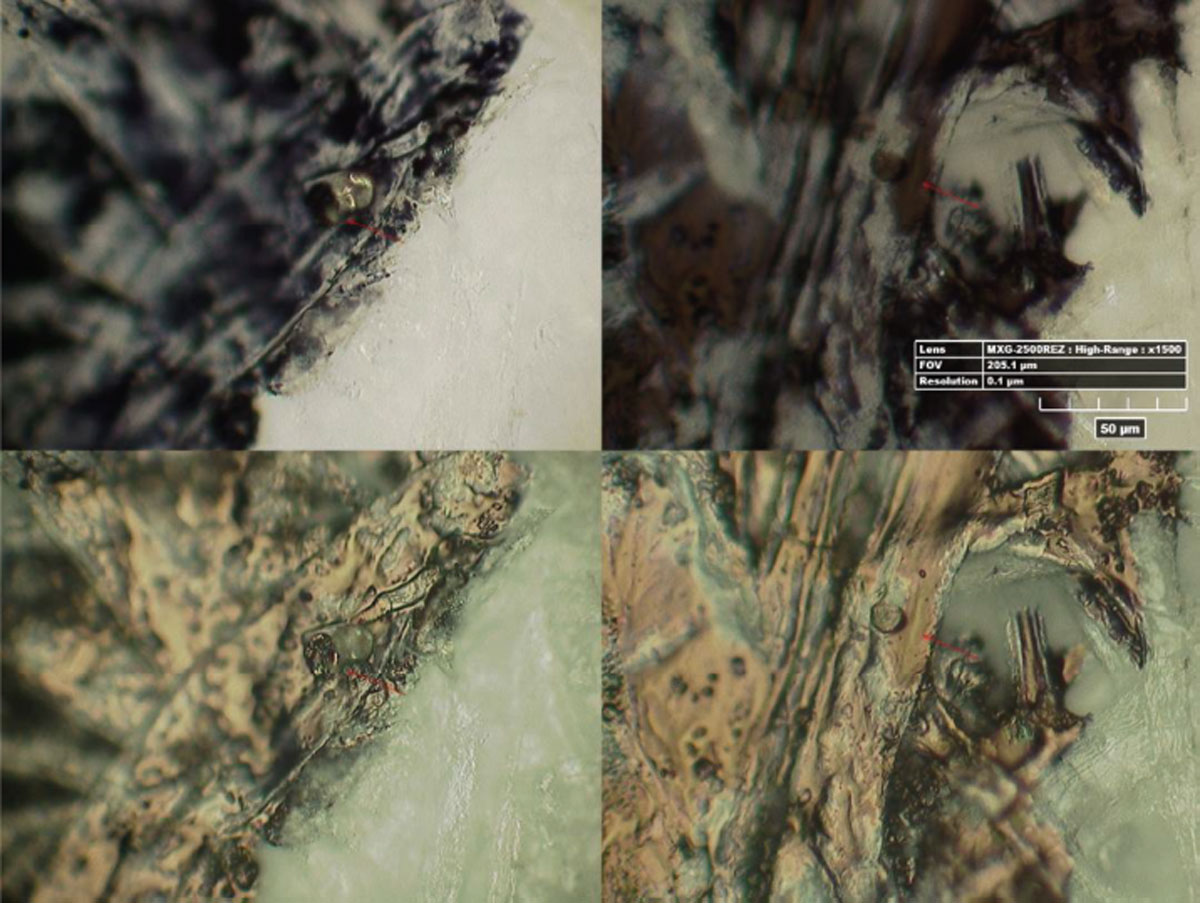
Figure 10
Reference sample of black writing paste and print intersection, left—writing paste first, right—print first. Top—polarized mode, bottom—coaxial mode.
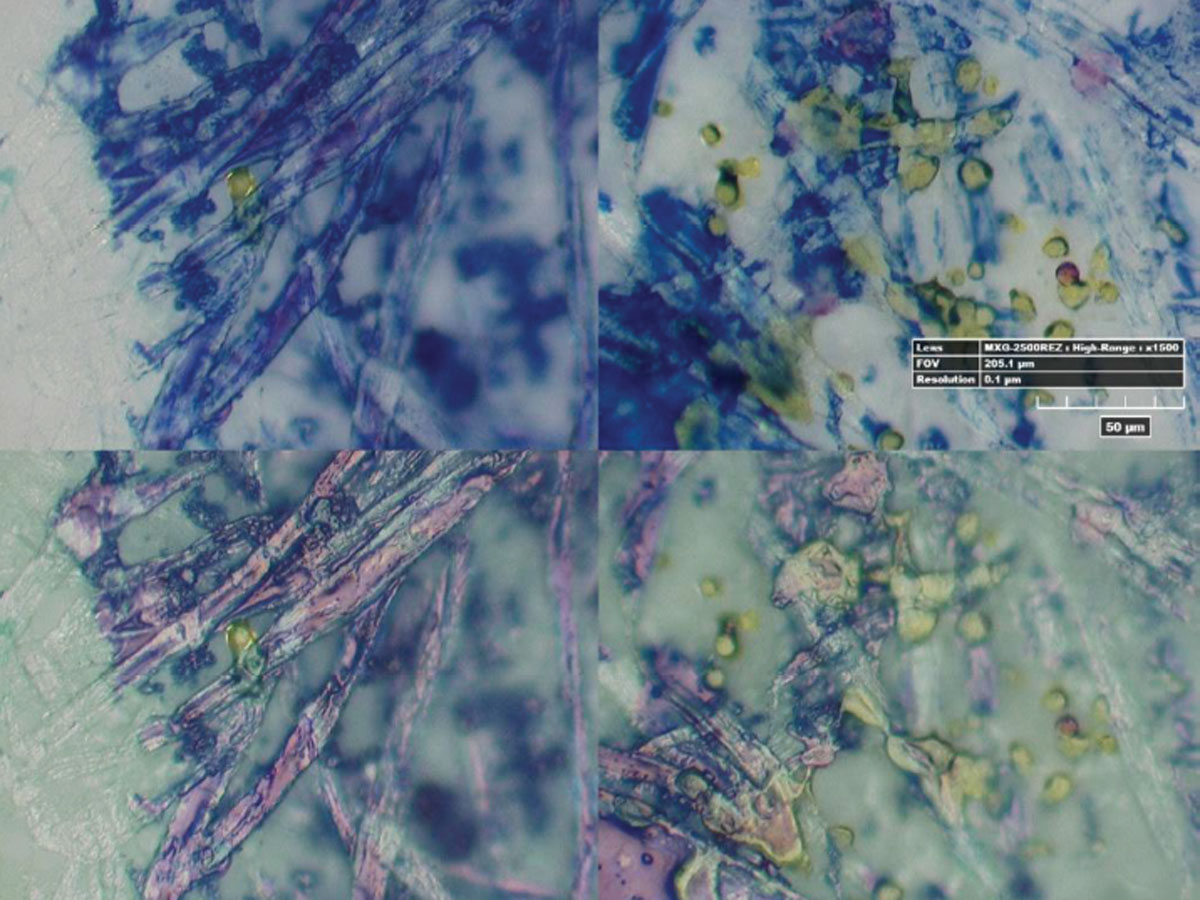
Figure 11
Reference sample of blue writing paste and yellow toner print intersection, left—writing paste first, right—print first. Top—polarized mode, bottom—coaxial mode.