
Introduction
Due to the fact that toners are mass products, the identification of a specific printer brand by means of chemical analysis is almost impossible. In the last decades, the quality of printers has continually increased. Thus, individual printing defects are rare. Measuring printed text or figures is part of the daily business in quality control of banknotes and high value documents such as checks. Authentication of travel documents via significant deviation of printing measures is reported1, 2 Application of image measure-based print quality analysis has been researched to derive and identify unique printing quality “signatures”3, 4, 5, 6. Differentiation between printers by measuring the same characters in the same text printed on different printers has been presented6, 7, 8, 9.
Few publications have been made to establish image analysis of printed characters to estimate whether or not two documents (or paragraphs) has been printed on different printers.
Ferreira et al. give a broad overview on different approaches and methods for laser printer attribution6.
In some cases of questioned document examination, experts have to estimate whether or not a page has been exchanged or a paragraph has been added in a second printing process. In other cases, the question may be whether or not two documents were printed on the same printer. Such document forgeries can, for example, be proven, if the chemical toner composition of the questioned text is different from the non-questioned one.
In the printing process of laser printers, an organic photoconductor (OPC) drum is statically charged with a corona unit (or a primary charge roller) and partially discharged with the aid of a laser, producing a latent image.
The distribution of the charge on the cylinder is most likely not homogeneous due to inhomogeneous voltage of the corona unit and/or power variation of the laser beam and/or material inhomogeneity of the cylinder. As a consequence, the amount of adherent toner on identical latent characters would be different, depending on the position of the cylinder surface. We postulate that variation in corona voltage and laser beam power will result in horizontally constant—and therefore reproducible—differences of toner deposition on each document that has been printed on the same printer. In addition, toner deposition depends on transfer performance, e.g. the ability of the transfer roller to properly transfer the toner onto the paper. Material inhomogeneities are supposed to produce a specific vertical or a specific non-directional toner distribution.
In the final step of the printing process, most toner printing techniques apply heat and pressure to a document by means of a second cylinder (fi xation of the toner to the paper). Polymers melt and stick to the paper surface as soon as they re-solidify. The toner slightly spreads out during this fi xation. Irregular fi xation cylinder temperature and/or non-uniform pressure have a direct infl uence on the toner spread. The latter is depending on the paper transport rollers in the printer. Again, both effects result in reproducible horizontal differences concerning the area of deposited toner.
The phenomenon of uniform vertical and uneven horizontal distribution of toner is often observed, when a document with a large black area instead of text is printed.
The more toner applied to the paper, the wider/larger the font-character areas are; and, as a consequence, the smaller the white/blank areas will be. As area calculations are square functions, such differences become more evident when blank, closed-shape areas are measured compared to font-character line widths (linear function).
Characters with blank closed-shaped areas (such as “a”, “e” and “o”) are frequently used in many languages.
Methods and Materials
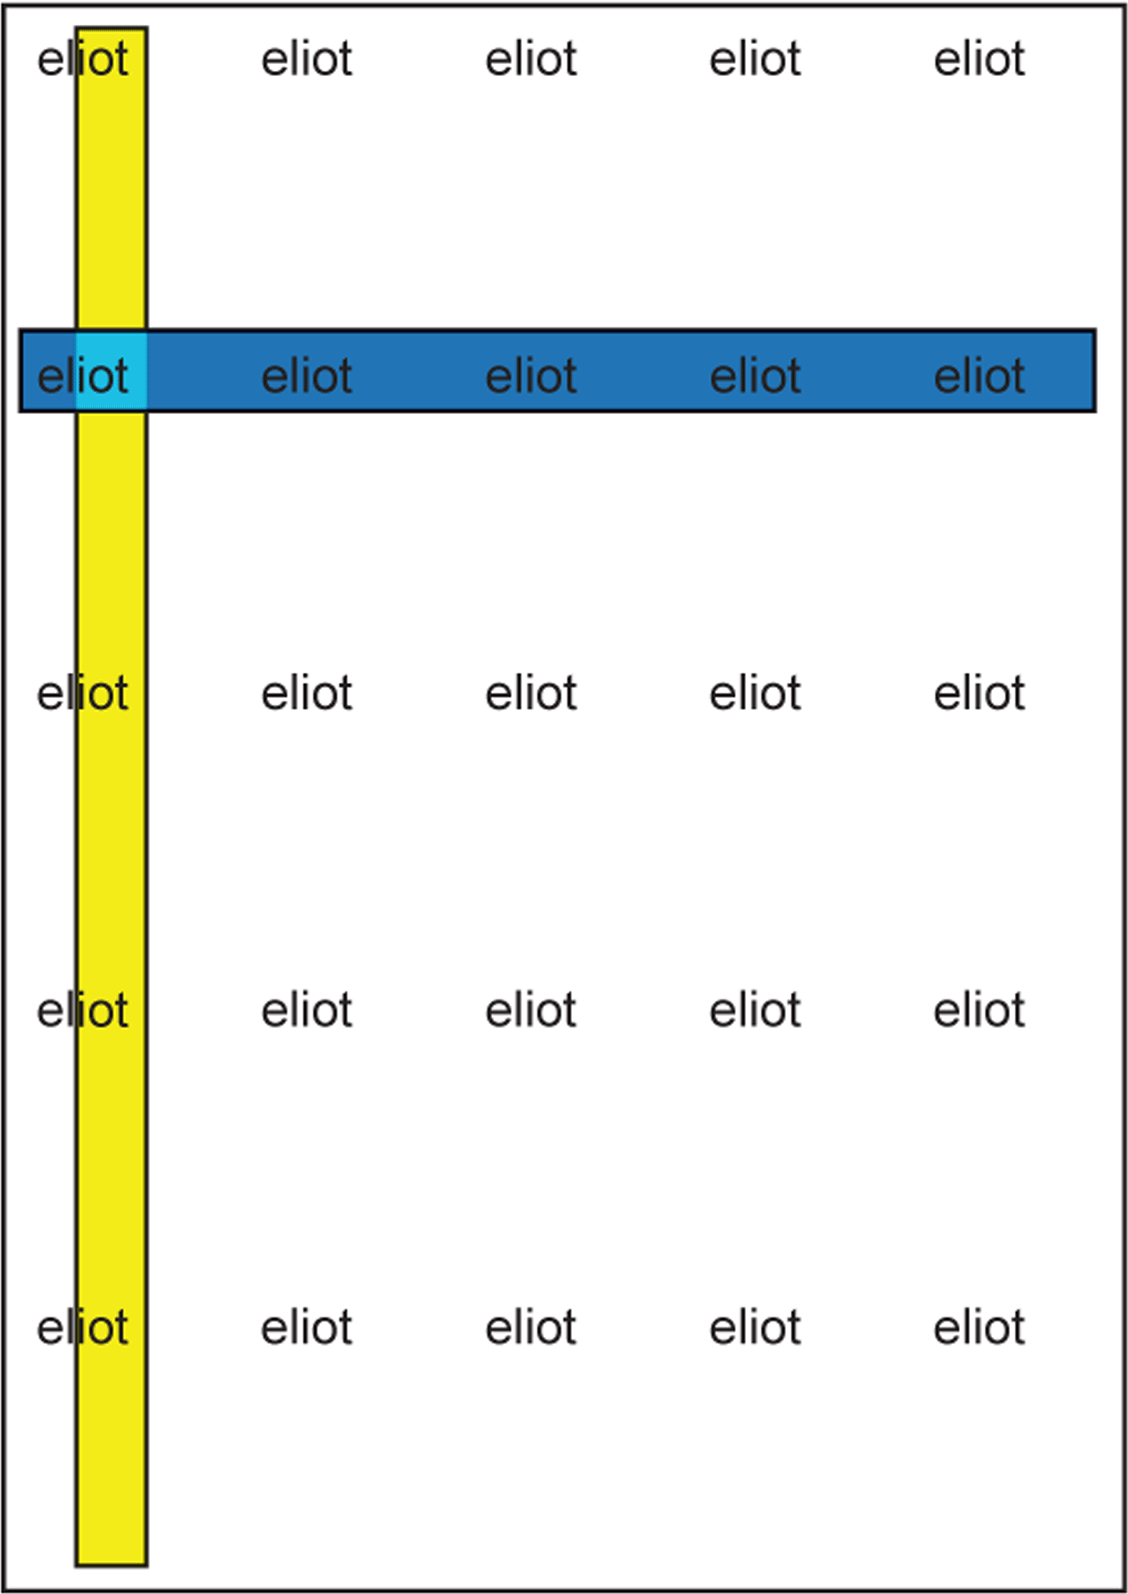
For this study, a document with the endless text “eliot” (Arial type font, 11 pt.) in 5 lines and 5 columns (5 times the word “eliot” per line), evenly distributed over the whole page, was produced in pdf format (Scheme 1).
Scheme 1.
Design of the standard pdf document. Example of a vertical zone of measurements (column 1, yellow) and a horizontal zone of measurements (line 2, blue).
To check if ambient conditions would infl uence the results, this fi le was printed on a Xerox Phaser 6130 laser printer once a week for a period of 12 months. Temperature and relative humidity were noted at each printing date. The non-printed (or blank) area in the 25 characters «o» was measured (Fig. 1). The arithmetical average value and the standard deviation were calculated from the 5 vertical (columns) and from the 5 horizontal (lines) measures for each printout. The values from document to document were compared. No infl uence of climatic differences was observed.
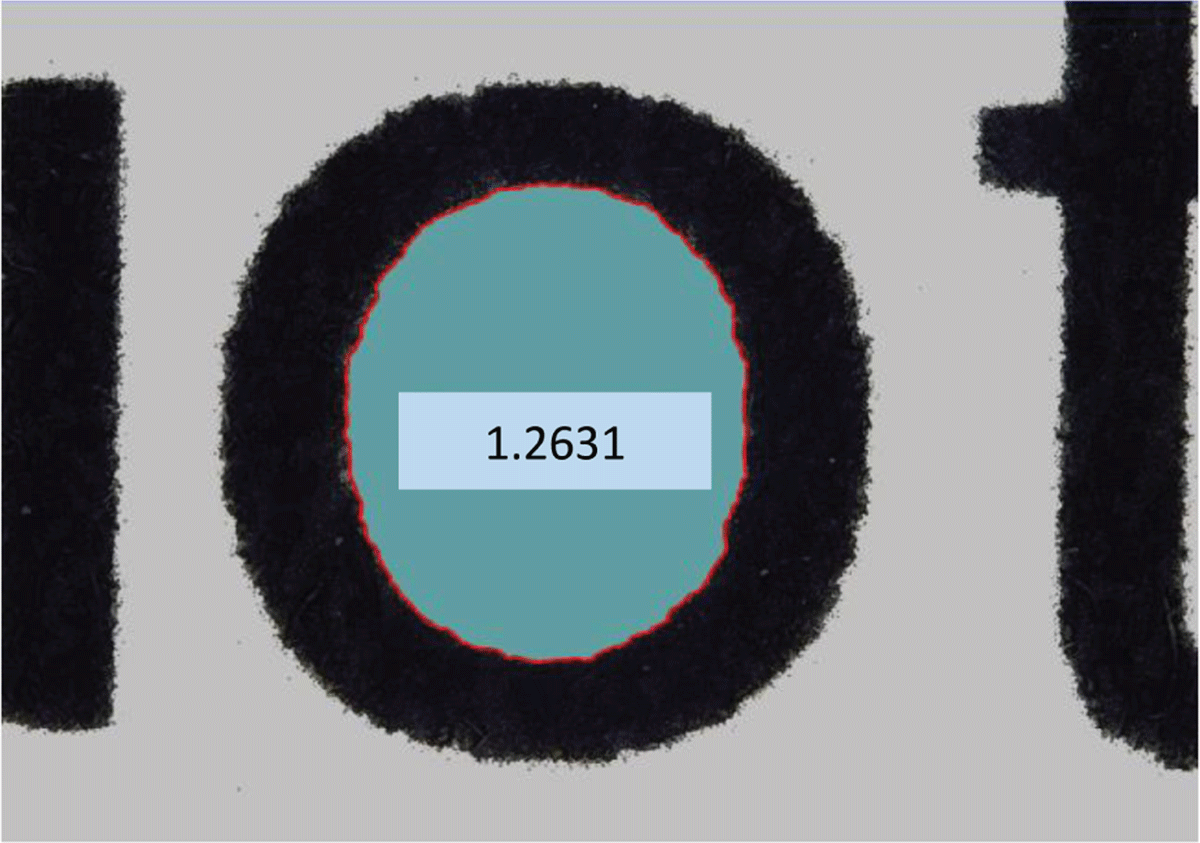
Figure 1
Measurement of the blank area of a character “o” with the aid of microscopy software.
To serve the purpose of printout profi ling, the «eliot» fi le was printed on 25 different laser printers (Table 1). The paper transport direction was along the long edge of an A4 sheet on all printers. The blank area of the “o” characters was measured with a Leica DFC290 HD camera on a Leica MZ16 microscope, using Leica LAS Im- age Analysis software.
Table 1
List of printers (and computers) that were used to print the samples.
| Printer | Computer | Comment |
|---|---|---|
| Xerox Phaser 6130 | Dell | 2 different printers/computers |
| Xerox Phaser 6130 | HP | 2 different printers/computers |
| Xerox Phaser 6280 | Dell | 4 different printers/computers |
| Xerox Phaser 6280 | HP | 2 different printers/computers |
| Xerox Phaser 6180 | Dell | |
| Oki C5950 | Dell | |
| HP Color Laserjet 4650 | Lian Li | |
| HP Color Laserjet 4650 | HP | |
| HP Color Laserjet 4650 | Antec | 2 different printers/computers |
| HP Laserjet 1018 | Digitec Tharsis | |
| HP Color Laserjet 1312 | Self-made design/model | |
| Brother HL 2040 | Medion | |
| Brother (no further model information) | Toshiba | |
| Lexmark C935 | HP | |
| Lexmark (no further model information) | HP | |
| Samsung CLX-3175 N | Plextor | |
| Samsung CLP-325 | Digitec Tharsis | |
| Samsung (no further model information) | HP |
Results
The measured blank area of the “o” characters within each column were constant. i.e. each of the fi ve measures was within the standard deviation of the average value. This result is consistent with a homogeneous vertical cylinder surface charge (along the cylinder circumference) and toner transfer ability within each printed column.
Based on these results, the average values of the measures from each column were used for analyzing horizontal toner distribution on the documents.
Most of the printouts showed significant variations regarding their column average values. Graphs have been drawn with the column average values as a function of the horizontal position of the letters “o”. These horizontal blank area profiles are presented using a constant y-axis intercept. This allows for direct optical comparison of the profile shape, of the column average values and of their standard deviations.
Xerox and Oki (only one printer was tested from the latter) models produced slightly smaller blank areas in the middle column and larger areas at the border of the paper. In other words, more toner was deposited in the middle column and less toner was deposited at the border columns of the paper. The horizontal profiles of Xerox and Oki printouts show a certain “V- or U-shape” (Fig. 2).
Within the Xerox printer group (especially Xerox 6280) we observed different average blank area values, even if the same paper quality was used.
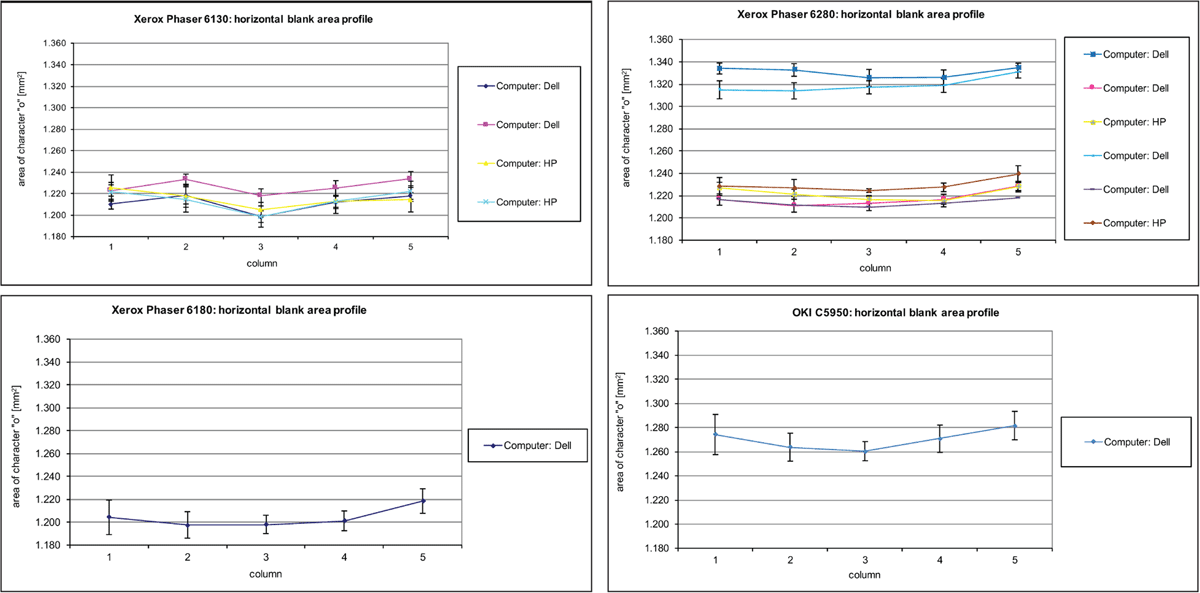
Figure 2
Horizontal blank area profiles of Xerox printers and one OKI printer: Xerox 6130 (upper left); Xerox 6280 (upper right), Xerox 6180 (lower left), Oki C5950 (lower right). The same y-axis intercept was chosen to ease the comparability of the different profiles.
HP printers do not show a common shape of horizontal profiles. However, the tested HPprinter models (and even printers within the same model type) had individual profile shapes as well as individual average blank areas (Fig. 3). The toner distribution on HP laser printers looks either homogeneous or tend to show slightly more toner deposition (smaller blank areas) at the border of the “eliot”-documents.
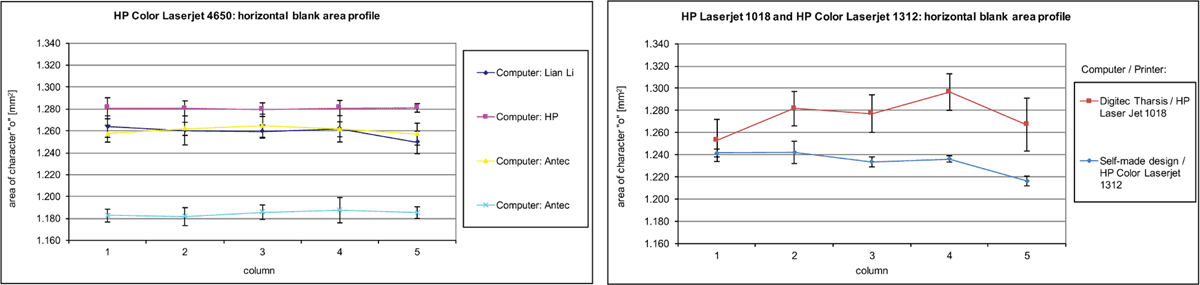
Figure 3
Horizontal blank area profiles of HP printers: HP Color Laserjet 4650 (left), HP Color Laserjet 1312 and HP Laserjet 1018 (right). The same y-axis intercept was chosen to ease the comparability of the different profiles.
In this study, Brother and Lexmark laser printers tend to deposit more toner at the right side and less on the left side of the “eliot”-documents. Again, printers are easily differentiated by their horizontal blank area profile, the average of the overall blank areas, but also by the standard deviation values (error bars) (Fig. 4).
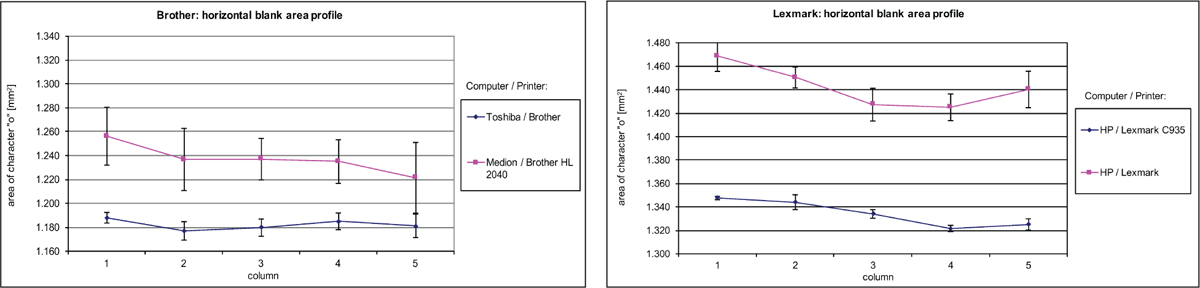
Figure 4
Horizontal blank area profiles of Brother and Lexmark printers: Brother HL 2040 and Brother without further model information (left), Lexmark C935 and Lexmark without further model information (right). The average amount of deposited toner varies strongly within these four printers.
Two or three (there was no information on the model of one printer) different Samsung printers were used to produce the “eliot”-documents. They showed an almost perfect horizontal blank area profile overlap in an “A- shape” (Fig. 5).
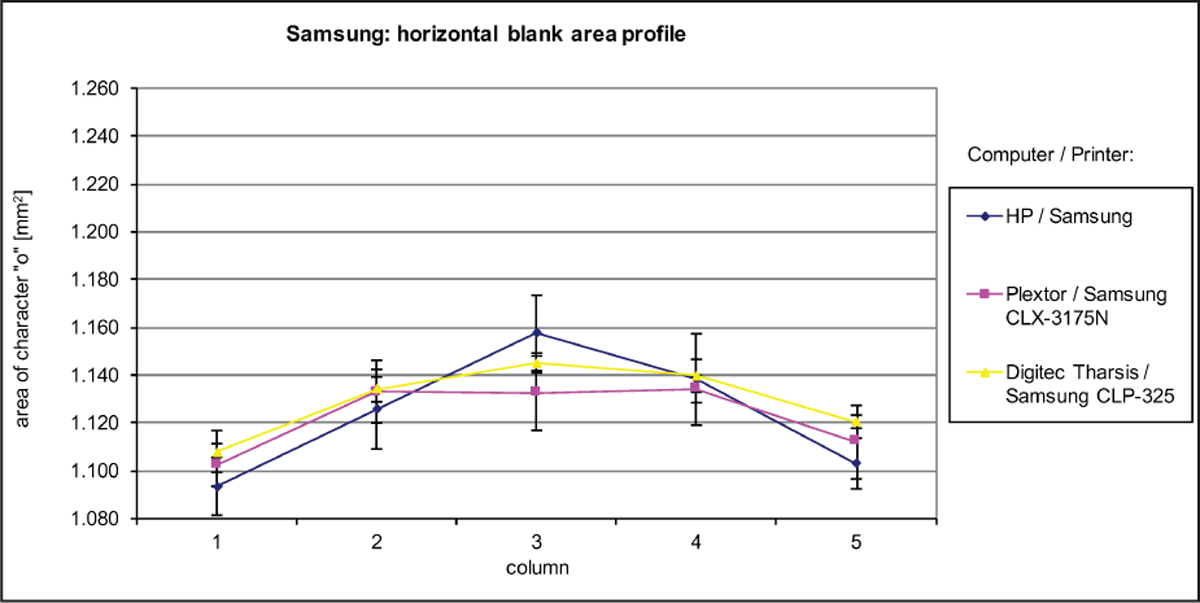
Figure 5
Horizontal blank area profiles of Samsung printers: Samsung CLX-1375 N, Samsung CLP325 and a Samsung printer without further model information.
The overall blank area average values and standard deviations of the 25 characters “o” were calculated for each document. They are presented in a common graph (Fig. 6). As mentioned above, some printers show significantly different values and, thus, can easily be distinguished from others. This fact has already been observed by measuring the blank area in letters “e” and published from W. Mazzella and R. Marquise9.
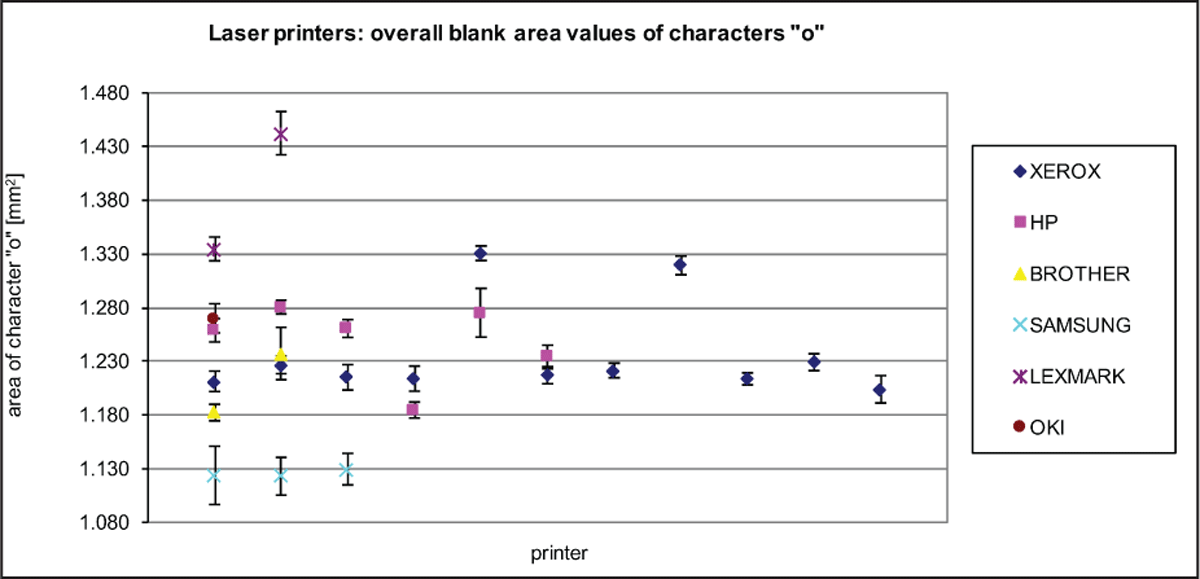
Figure 6
Overall blank area values of all tested printers.
The standard deviation of the overall blank area average value is at the same time a measure of the printer/printing quality and homogeneity; it also varies from printer to printer (Fig. 7).
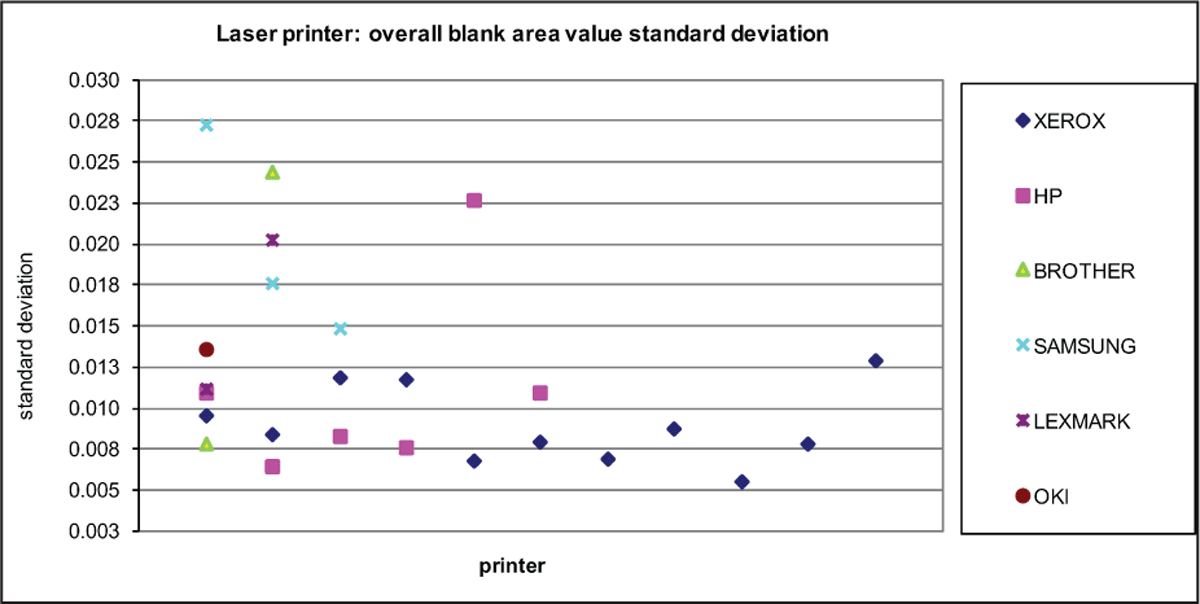
Figure 7
Overall blank area value standard deviations of all tested printers.
If all this data is taken into account, it is even possible to distinguish two documents of the same file on the same printer but originated from different computers.
Discussion
In this study, we could demonstrate that different printers may produce different horizontal blank area profiles. Some brands of printers seem to show a typical “V”- or “A”-like profile shape. Additional discriminative results from blank area analysis are the overall average values as well as the standard deviation values.
We could show, that the same system (hardware and software) produces a stable horizontal profile within one year, independent on environmental conditions such as temperature and humidity.
Thus, we state, that two documents with the same profile may be (not must be) printed with the same system. And, that two significantly different profiles is a strong evidence for two printing processes (may be the same printing system with only one element that changed). This may help the expert to estimate whether or not two documents (or paragraphs within one document) have been printed with different printers.
Some printer brands showed a common profile shape (e.g. Samsung “A”-like; Xerox “V”-like), while others were more individual (e.g. HP, Lexmark, Brother). To prove, if this shape is specific for a certain brand or model, it will be necessary to extend this study to a larger number of printouts from different printers.
Future research in document horizontal profiling will show the limit of the method by increasing the amount of measured text (higher number of same characters) and by increasing the sub-division in smaller segments (number of columns).
As comparison between data from two or more questioned documents or paragraphs is based on relative measurements, there is no need for a calibrated optical device in this method.
Acknowledgment
The author wants to thank Mrs. Bettina Hirter, Ecole des sciences criminelles, Université de Lausanne, for her support in measuring the documents.