
Introduction
With the spread of digital documents, the digital signature plays an important role in verifying the origin of the documents. However, the handwritten signature as a biometric identifier still cannot be replaced by a digital signature. This is especially true in the case of business, financial, and official documents, where the handwritten signature is mostly accepted.
Forensic handwriting analysis experts investigate many features in a given sample like slant, loops, letter connections, directions and flow of writing movement, where the author raised the pen, and where he stopped during the writing process (Morris and Morris, 2000; Kelly and Lindblom, 2006). There are some applications for analyzing handwritten samples that take into account the features preferred by the handwriting analysis experts (Atanasiu, 2011; Atanasiu et al., 2011). Several methods exist for verifying (Dehgan et al., 1997; Chen and Srihari, 2005; Impedovo et al., 2008; Justino et al., 2005; Lee, 1999; Napoles and Zanchettin, 2012; Plamondon and Srihari, 2000; Kalera et al., 2004; Huang et al., 2002), identify (Kisku et al., 2010; Kalera et al., 2004; Plamondon and Srihari, 2000; Pourshahabi et al., 2009; Lee, 1999), and recognizing (Mandal et al., 2011; Ismail et al., 2000; FriasMartinez et al., 2006; Lee, 1999) signatures. In spite of the computer aided decision systems the opinion of forensic handwriting analyzer experts are essential in disputed cases.
The aim of the above-mentioned applications is to support the verification of the customer signatures. These algorithms extract some shape features from the original image of the signature, then they apply graph matching or shape descriptors for comparison. The frequently used classification methods are based on the Dynamic Time Warping (DTW) (Shanker et al. 2007, Chen and Srihari 2005, Impedovo et al. 2008), Neural Networks (NN), Hidden Markov Models (HMM), and Support Vector Machine (SVM) (Justino et al. 2005).
There are two kinds of handwriting and signature analysis, namely offline and online. Offline methods investigate the images of the signatures, while online ones analyze the dynamics of the handwriting. Furthermore, online and offline information may be combined and investigated together (Abbas and Chibani 2011).
Skeleton is a shape descriptor that summarizes the general form of objects. 2D thinning algorithms are capable of extracting some skeleton-like shape features (i.e. topological kernels and centerlines) from binary images (Siddiqi and Pizer 2008). Most of the offline signature analysis approaches extract the centerlines from the binarized signature images for a morphological and topological analysis. Two signatures from the same author vary from each other and some strokes may cross the signatures once, while in some other samples these strokes may go under the signature and look like underlines. This also depends on the writer and writing environment; and, moreover, it is influenced by the speed of the writing and tiredness (Impedovo et al., 2012; Plamondon, 2005; Plamondon and Djioua, 2006). Hence a topological analysis may lead to the rejection of genuine signatures as well. Impedovo et al. investigated some stable segments that were quite similar in all reference signatures and applied them in signature verification (Pirlo and Impedovo, 2010; Impedovo et al., 2012).
Several offline signature verification methods apply skeletonization techniques well. Most of them use thinning in a pre-processing step to determine the skeleton image of the signature and extract global features (e.g. width, height, the height-to-width ratio, maximum horizontal or vertical projection, image area, the vertical or horizontal center of the signature) and grid features (pixel densities, distribution, predominant axial slant) for each cell taken from the skeleton of the signature (Rathi et al., 2012; Azzopardi and Camilleri, 2008; Baltzakis and Papamarkos 2001). In addition, Baltzakis and Papamarkos (2001) extracted texture features, that were based on the graylevel image of the signature. In contrast, Justino et al. (2000) used the skeleton of the signature image just to determine the axial slant in each grid cell.
In an evaluation of thinning algorithms, Lee, Lam, and Suen (1994) proposed two similarity measures for centerlines. As a basis of comparison the “ideal” reference skeleton was drawn for the observed object. Here, each centerline provided by thinning algorithms was compared with this reference skeleton. One of the proposed similarity measures Ck has a range of [0, 1].
Our verifier applies thinning as a pre-processing step (similar to that described in the abovementioned articles), but we use centerlines as the representation of the signatures and unlike the other methods used they are directly compared based on a distance metric specially developed for skeleton comparison (Lee et al., 1994).
Here we propose an offline method for signature analysis. The similarity measure Ck proposed for 2D centerlines forms the basis of our signature verification method.
The rest of the paper is organized as follows: In Section 2 we describe our algorithm, then in Section 3 we present our experimental results. Lastly in Section 4, we round off this paper with some brief conclusions and remarks.
Methods and Materials
Next, we will give a detailed description of our verification system.
Signature verification systems are composed of pre-processing, feature extraction and classification tasks. In pre-processing the signature images are segmented to determine the binary image of the signatures, and after binarization the centerlines are extracted as shape features. In the classification phase the signatures are compared pairwise and centerline similarity is applied to decide whether a questioned signature is probably a forged or a genuine one.
Segmentation
The first pre-processing task of our algorithm is segmentation. We require grayscale images for segmentation, hence RGB images are converted to grayscale using just the luminance and avoiding the hue and saturation from the HSL (huesaturation-lightness) representation of the original RGB image.
Although signature images have a quite high contrast between the background (paper) and foreground (handwriting), we cannot apply a simple global thresholding to the image. Some noise may appear in the image that needs to be suppressed. Here, we choose an averaging filter with a 5×5 window size for noise reduction.
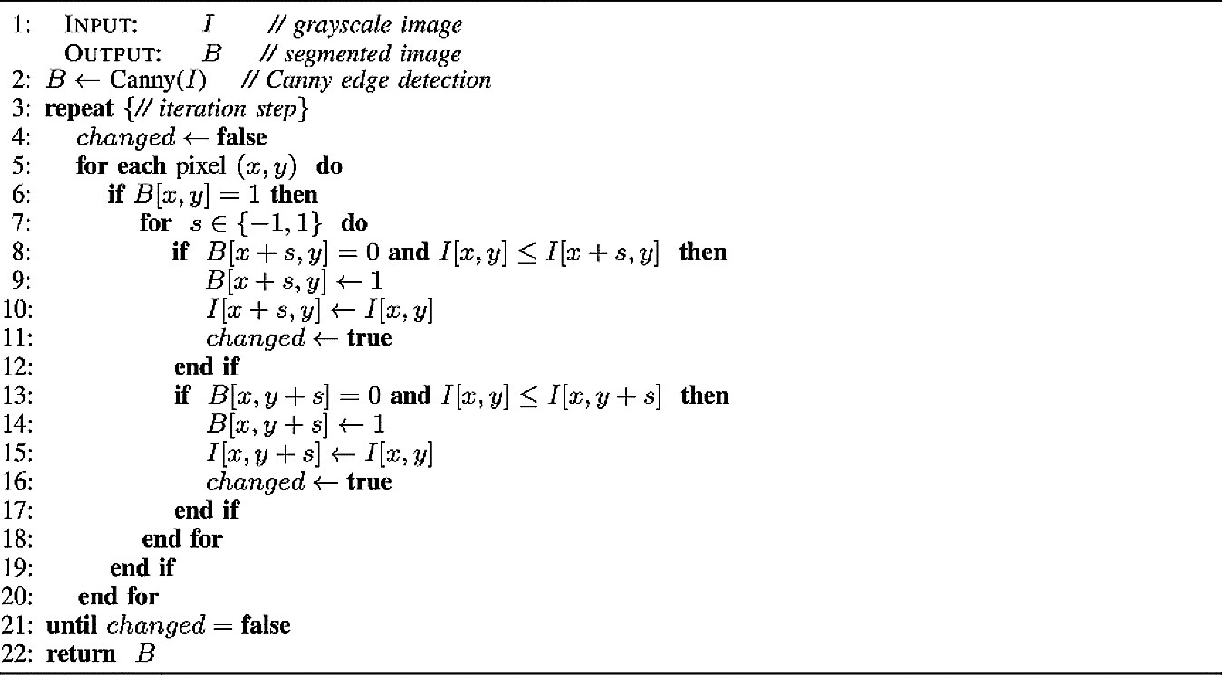
We applied a region growing method for segmentation. Region growing is an iterative segmentation method where the initialized regions are determined as single points or point sets, and for each iteration step regions are expanded to their neighboring pixels satisfying the given homogenity criteria (Gonzalez and Woods, 2008).
Seed points of initialized regions are provided by the result of the Canny edge detector (Canny, 1986). The scale parameter of the Canny edge detector is set to 2 based on previous experiments.
For each iteration step, regions grow to the pixels of lower intensities such that new points joined to the region inherit the highest intensity of the neighboring pixels belonging to the region. This iteration step is repeated until there is no new pixel merged to any region.
Since segmentation is a labeling problem, we should mention that in this process we use just two labels. The foreground is marked by a ‘1’ label and background by a ‘0’ label. We allow the merging of disjoint regions as well.
Lastly, morphological filtering (Gonzalez and Woods, 2008) is applied using a diamond-shape structuring element with radius of 1.
The pseudo code of segmentation process is shown in Algorithm 1. Note that the process can be speeded up only if the pixel coordinates of the current region boundaries are considered for each iteration step.
Algorithm 1.
Region Growing Segmentation
Registration
From the segmentation procedure, we get binary images of signatures. To compare the signatures, we have to transform them to the same position. Image registration computes the transformation parameters that move the observed object to the reference one. Most of the registration algorithms are iteration-based method whose computational time increases if the amount of feature points is large. We decrease the number of feature points that represents the shape of each signature to reduce the computational time. Skeleton is a shape descriptor that summarizes the general form of objects. Thinning is a skeletonization technique in digital images that is capable of extracting both types of skeleton-like shape features (i.e., a topological kernel and centerline) (Siddiqi and Pizer, 2008; Gonzalez and Woods, 2008). Segmented signatures are represented by their centerlines and skeletal points in registration are treated as feature points.
Unfortunately, the topology and the size of two signatures written by the same author may be different, and the centerlines may consist of a different number of skeletal points. Thus, we consider these skeletal point sets as point clouds.
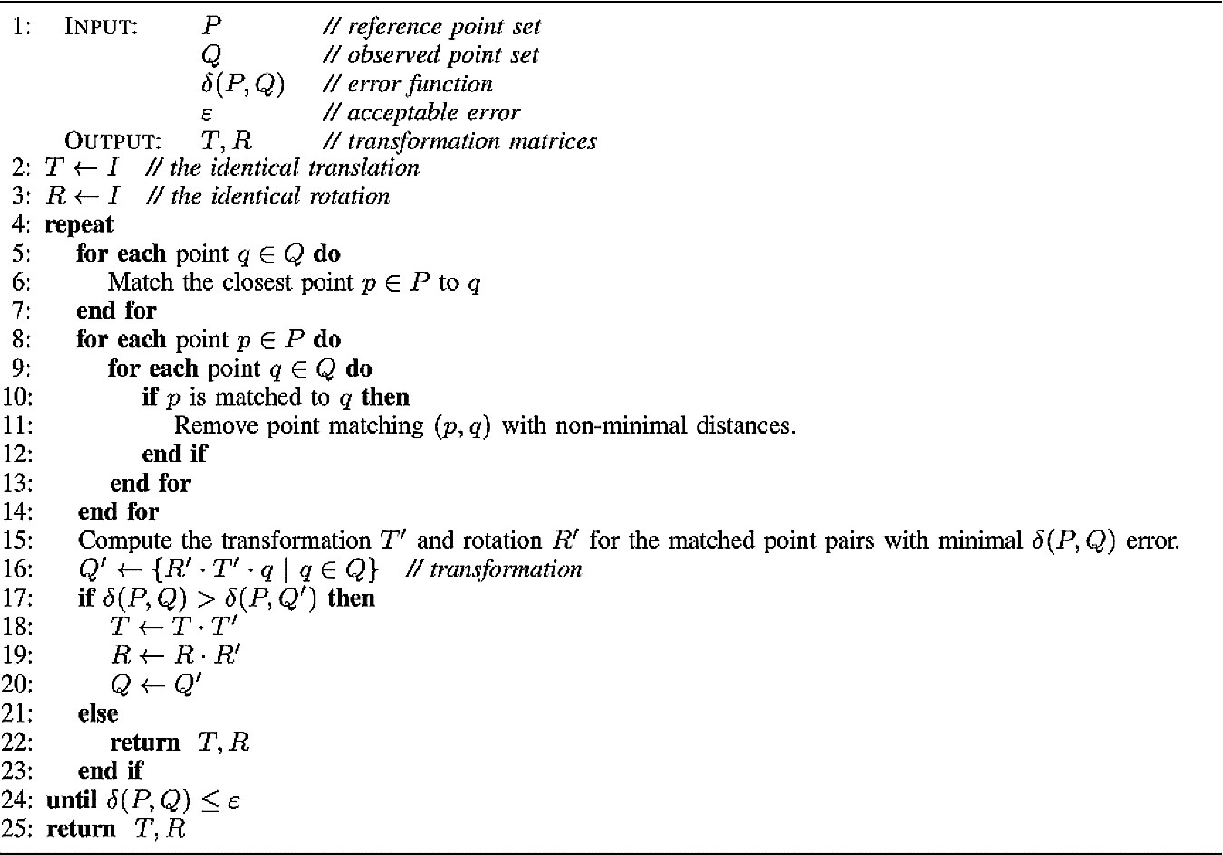
A widely used set of registration methods developed for point clouds is the iterative closest points (ICP) algorithms (Goshtasby, 2012; Besl and McKay, 1992). This concept is an iterationbased method that computes the rotation and translation matrices of the transformation. The general scheme of ICP algorithms is shown in Algorithm 2. As an error function, the root mean square (RMS) error was applied. Here, we used the Matlab implementation1 of ICP.
Algorithm 2.
Iterative Closest Point Registration
The results of pre-processing steps are depicted in Figures 1, 2, and 3. Figures 1 and 2 show the original signature (a), segmented signatures (b), centerline of the signatures (c) and the results of the registration (d) for two writers. Figure 3 shows two examples for registration, (a) shows a registration result of two genuine signatures, while (b) shows a registered forgery and genuine signature. As can be seen, there is a certain difference between the two registered genuine signatures (Figure 3(a)) and the registered genuine signature and forgery (Figure 3(b)). The genuine signatures are quite similar, but the forged one does not match the genuine sample. Figure 4 shows two pairs of registered signatures: Figure 4(a) shows two genuine signature from the same author; Figure 4(b) shows a genuine and a forged one. The signatures are from the SigComp2011 dataset and due to the regarding restriction, the whole image cannot be included in papers, thus only a part of the image is presented here. Similarly, Figure 5 shows two pairs of registered signatures from a Japanese writer.
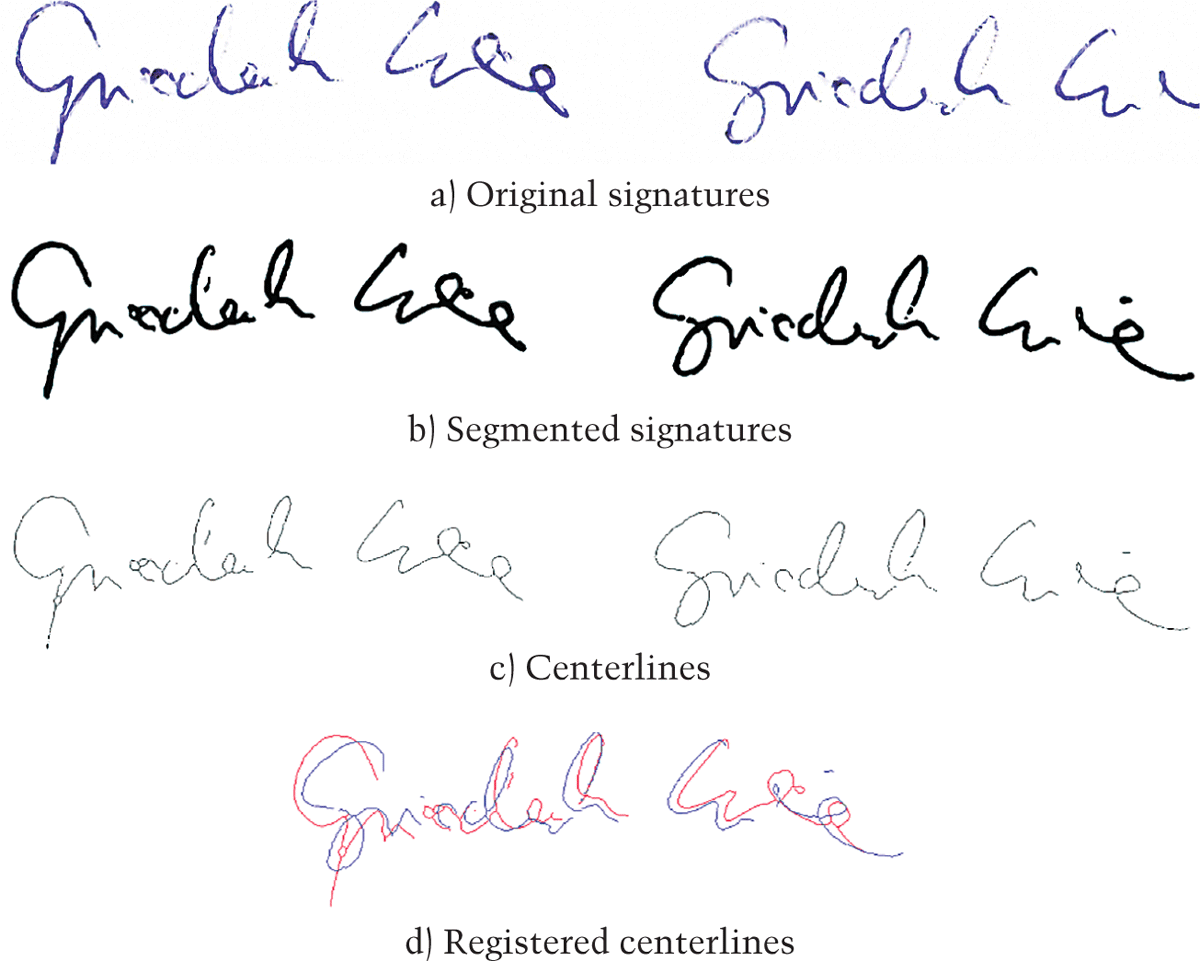
Figure 1.
Results of preprocessing steps of genuine signatures from first author

Figure 2.
Results of preprocessing steps of genuine signatures from second author
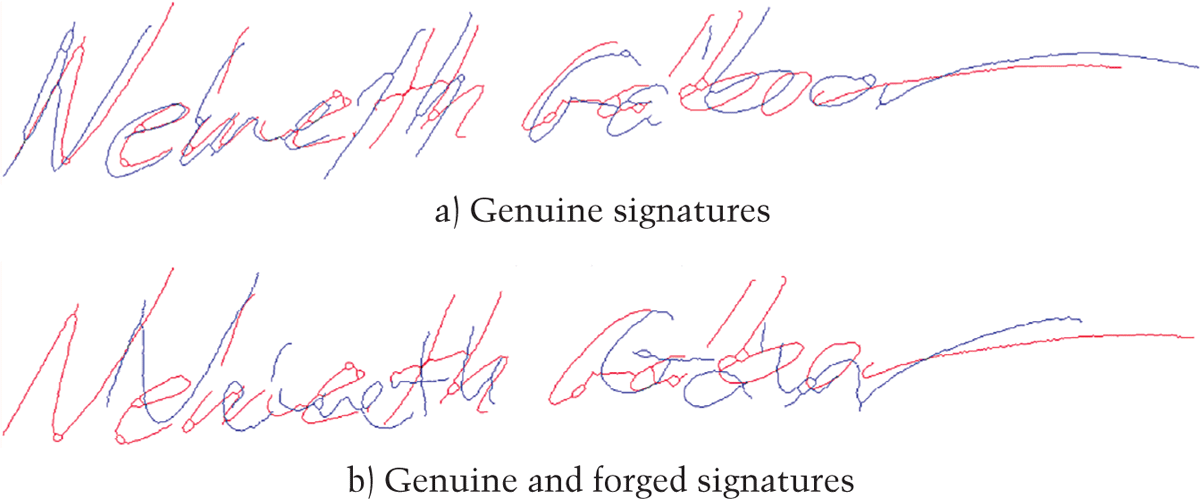
Figure 3.
Registered signatures
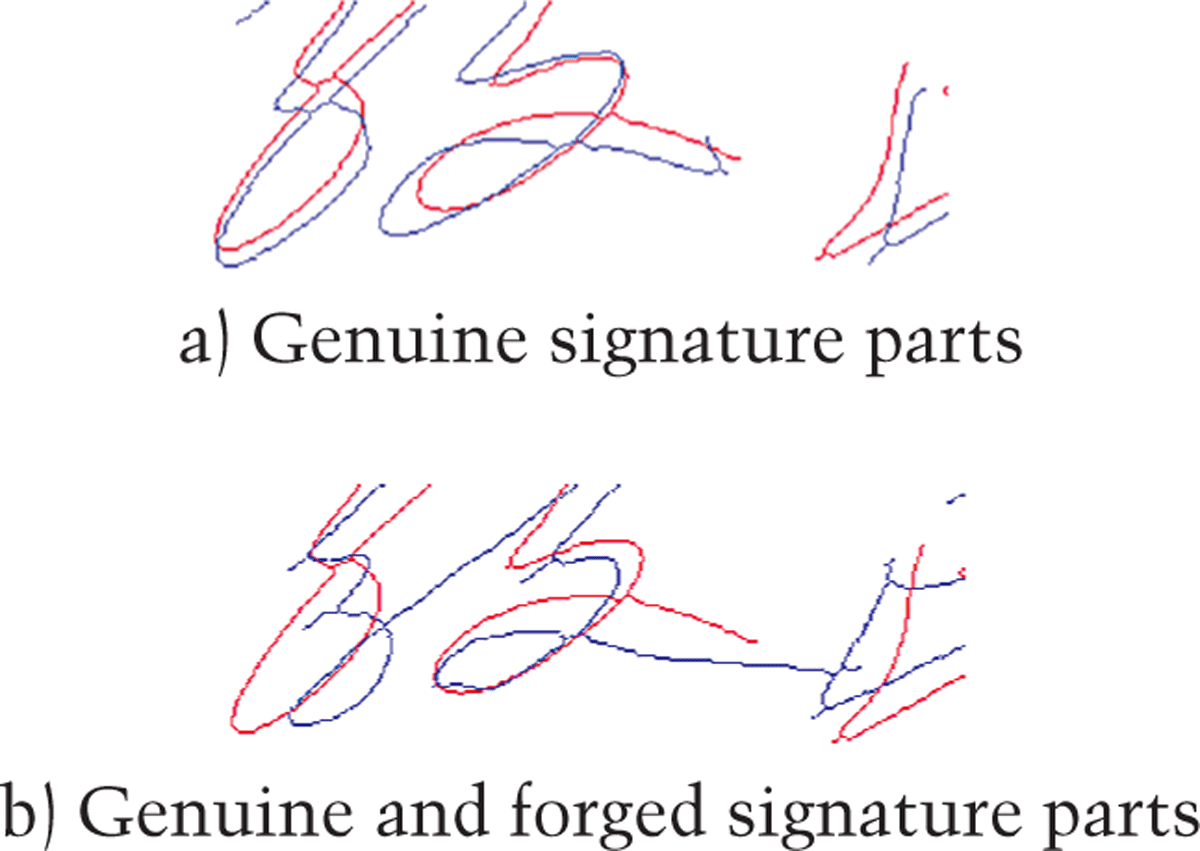
Figure 4.
Part of registered Chinese signatures.
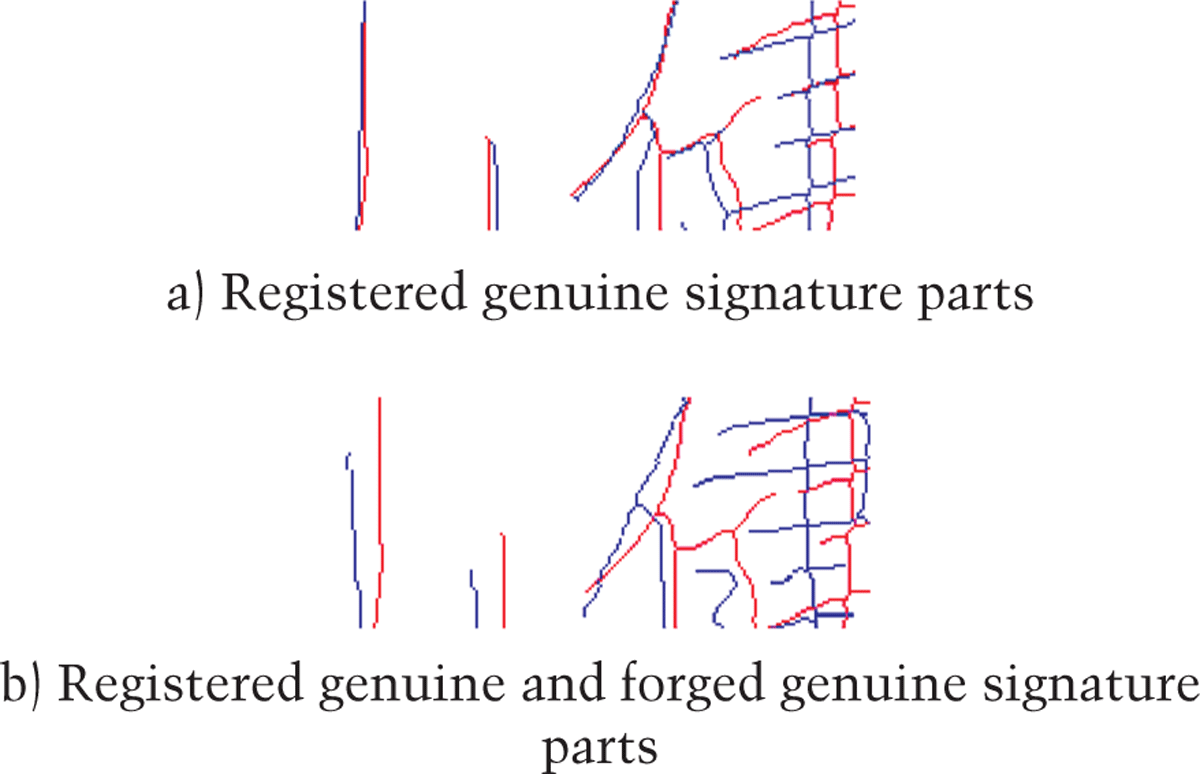
Figure 5.
Part of registered Chinese signatures.
Comparison of Signatures
Here, we decided to apply the similarity measure C(P,Q) developed by Lee et al. (1994) for the quantitative comparison of skeletonization methods. In their study, the results of several thinning algorithms were compared with the reference centerlines of binary objects.
Next, we will use the C measure for a comparison of the centerlines of two given signatures (denoted by P and Q). The distance d(p,q) between two distinct 2D points p=(px, py) and q=(qx, qy) is computed as follows:
Furthermore, the distance between a 2D point p and a point set P is given by
The similarity measure C(P, Q) between two point sets P and Q is defined as follows:
where #P and #Q indicate the number of elements of set P and Q, respectively.
Here it is clear that C(P, Q) takes values in the range [0, 1] and a higher value means a better similarity.
Classification
First, the similarity measures are calculated for the reference signatures for each writer w. Each reference signature is compared with every other reference signatures of the same writer; hence if writer w has n reference signatures, then we compute (n2) similarity values. As a reference similarity SRm the minimal, maximal, or average (m ∈ {min, max, avg}) value is taken into account.
For each writer w the similarity value of a questioned signature is computed in a similar way. Each questioned signature Q is compared with each reference signature.
So if n reference signatures are present, we will calculate n similarity values. The SQm similarity of the questioned signature Q will be considered the minimal, maximal, or average (m ∈ {min, max, avg}) value of these similarities.
Based on these statistical values, nine writerdependent constraints are investigated. Each constraint has a form of SQm < k · SRm, where k is varied in the range [0, 2] and m ∈ {min, max, avg} denotes the minimal, maximal, and average similarity values. If the similarity of the questioned signatures is above the threshold k · SRm, then it is rejected (i.e., treated as forgery); otherwise it is accepted (i.e., treated as genuine).
In addition, we investigate writer-independent constraints, where the constraints do not take into account the reference similarity. In this case the questioned Q signature is rejected if its similarity value SQm is less than k; otherwise it is accepted as genuine. All together for each dataset twelve constraints are examined.
Results
Here, we present the results got from applying our approach on three public datasets.
Datasets
In this study we will utilize the SigComp2011 Dutch and Chinese offline (Liwicki et al. 2011) and the SigWiComp2013 Japanese offline (Malik et al. 2013) databases. Only the testing (evaluation) datasets will be used for evaluation purposes because the algorithm does not have any predefined parameter that needs to be trained.
The Dutch evaluation dataset consisted of RGB images with 400 dpi resolution in PNG format, including 12 reference and 24 questioned signatures (12 genuine and 12-20 forged) taken from 54 authors. Altogether, the evaluation dataset consisted of 1933 handwritten signature images.
The Chinese evaluation dataset consisted of grayscale images in PNG format, including 1012 reference and 46-48 questioned signatures (12 genuine and 34-47 forged) taken from 10 authors. Altogether, the evaluation dataset consisted of 601 handwritten signature images.
The Chinese signature dataset also contained frames around the signatures. These strokes did not belong to the signatures, so the results of further processing steps could have been distorted. These line segments can be easily detected, since they are close to the image border and slant nearly horizontally or vertically. We used the Hough transformation to determine the lines, but several line segments might be present in the picture and some of them might belong to the signature. Hence, we had to rarefy the list of detected lines. After the detection of all line segments we kept just the nearly parallel and perpendicular ones (with a ± 5 degrees tolerance level). If the majority of the object points were located on one side of the line, we kept it; otherwise it was removed from the list. Lastly, the remaining lines were used as a mask to remove the frame.
The Japanese evaluation dataset is consisted of binary images which were generated from online signatures. The total evaluation set comprised 20 authors, 20 reference and 66-69 questioned signatures (36 genuine and 30-33 forged) per author. In total, the evaluation dataset consisted of 1566 handwritten signature images.
Evaluation
In signature verification the basic goal is to accept the genuine signatures and reject the forged ones; however no system is perfect or foolproof.
In order to evaluate the verification methods, measures can be applied. The False Acceptance Rate (FAR) is the percent of the accepted forged signatures relative to the number of accepted forged and rejected forged samples (i.e., the number of forged samples).
The False Rejection Rate (FRR) is the percent of the rejected genuine signatures relative to the number of rejected genuine and accepted genuine samples (i.e., the number of genuine samples).
The FAR, FRR values are computed the following way:
where
TP (true positive) is the number of genuine signatures recognized as genuine ones,
FP (false positive) is the number of forged signatures recognized as genuine ones,
FN (false negative) is the number of genuine signatures recognized as forged ones,
TN (true negative) is the number of forged signatures recognized as forged ones, •
N (negative) is the number of forged signatures, and
P (positive) is the number of genuine signatures.
The accuracy, FAR, and FRR values for the three evaluation datasets have been presented in Table 1.
Table 1
Summary of results for the twelve constraints and three databases
| CHINESE | |||
|---|---|---|---|
| Constraint | Best accuracy (k) | FAR/FRR (k) | Accuracy |
| SQmin < k · SRmin | 72.48% (2.2995) | 42.23% / 42.50% (1.175) | 57.70% |
| SQavg < k · SRmin | 64.07% (2.195) | 39.51% / 39.17% (1.745) | 60.57% |
| SQmax < k · SRmin | 66.53% (2.995) | 38.69% / 39.17% (2.430) | 61.19% |
| SQmin < k · SRavg | 78.44% (0.700) | 40.05% / 40.83% (0.530) | 59.75% |
| SQavg < k · SRavg | 83.37% (0960) | 29.97% / 29.17% (0.815) | 70.23% |
| SQmax < k · SRavg | 81.52% (1.420) | 24.25% / 24.17% (1.160) | 75.77% |
| SQmin < k · SRmax | 77.41% (0.495) | 38.69% / 38.33% (0.330) | 61.40% |
| SQavg < k · SRmax | 76.59% (0.685) | 31.06% / 29.17% (0.500) | 69.40% |
| SQmax < k · SRmax | 79.06% (0.880) | 27.25% / 25.83% (0.705) | 73.10% |
| SQmin < k | 77.41% (0.090) | 37.87% / 46.67% (0.065) | 59.96% |
| SQavg < k | 78.44% (0.140) | 28.88% / 28.33% (0.100) | 71.25% |
| SQmax < k | 80.90% (0.170) | 25.34% / 24.17% (0.140) | 74.95% |
| DUTCH | |||
| Constraint | Best accuracy (k) | FAR/FRR (k) | Accuracy |
| SQmin < k · SRmin | 69.31% (0.975) | 31.92% / 32.41% (1.040) | 67.83% |
| SQavg < k · SRmin | 73.50% (1.325) | 29.89% / 30.56% (1.435) | 69.77% |
| SQmax < k · SRmin | 71.41% (1.580) | 31.14% / 31.33% (1.900) | 68.76% |
| SQmin < k · SRavg | 67.52% (0.600) | 32.71% / 32.56% (0.605) | 67.37% |
| SQavg < k · SRavg | 79.49% (0.845) | 20.81% / 20.83% (0.860) | 79.18% |
| SQmax < k · SRavg | 78.24% (1.120) | 22.54% / 22.69% (1.145) | 77.39% |
| SQmin < k · SRmax | 61.93% (0.370) | 38.34% / 37.81% (0.370) | 61.93% |
| SQavg < k · SRmax | 71.25% (0.535) | 29.89% / 28.70% (0.515) | 70.71% |
| SQmax < k · SRmax | 74.83% (0.715) | 25.04% / 25.77% (0.690) | 74.59% |
| SQmin < k | 61.62% (0.090) | 42.10% / 39.66% (0.075) | 59.13% |
| SQavg < k | 69.77% (0.110) | 31.46% / 31.17% (0.105) | 68.69% |
| SQmax < k | 73.66% (0.140) | 27.54% / 25.15% (0.140) | 73.66% |
| JAPANESE | |||
| Constraint | Best accuracy (k) | FAR/FRR (k) | Accuracy |
| SQmin < k · SRmin | 63.95% (1.025) | 36.11% / 36.63% (0.990) | 63.65% |
| SQavg < k · SRmin | 66.52% (1.345) | 36.61% / 33.83% (1.400) | 66.29% |
| SQmax < k · SRmin | 67.57% (1.640) | 32.92% / 33.17% (1.840) | 66.97% |
| SQmin < k · SRavg | 68.02% (0.610) | 35.56% / 36.30% (0.545) | 64.10% |
| SQavg < k · SRavg | 74.51% (0.830) | 28.47% / 28.38% (0.765) | 71.57% |
| SQmax < k · SRavg | 76.55% (1.090) | 25.83% / 25.41% (1.020) | 74.36% |
| SQmin < k · SRmax | 67.35% (0.395) | 34.72% / 36.47% (0.340) | 64.48% |
| SQavg < k · SRmax | 74.06% (0.545) | 29.31% / 29.87% (0.465) | 70.44% |
| SQmax < k · SRmax | 76.92% (0.700) | 25.28% / 26.07% (0.625) | 74.36% |
| SQmin < k | 66.52% (0.125) | 36.39% / 33.33% (0.110) | 65.01% |
| SQavg < k | 72.47% (0.160) | 29.72% / 28.38% (1.155) | 70.89% |
| SQmax < k | 74.36% (0.225) | 25.56% / 25.91% (0.210) | 74.28% |
By varying the parameter k (and the threshold value), the FAR and FRR values also change (see Figures 6, 7, and 8). If FAR and FRR attain the same value, then it is referred to as the Equal Error Rate (EER).
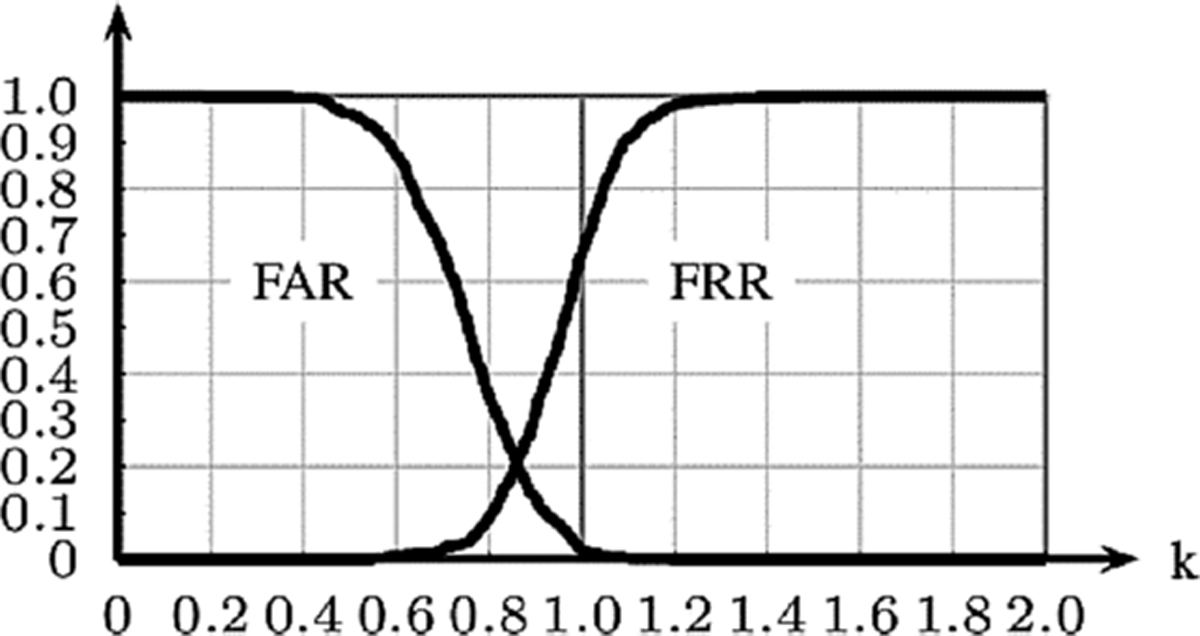
Figure 6.
False Acceptance Rate (FAR) and False Rejection Rate (FRR) respect to the thresholding parameter k and SQavg < k · SRavg (Dutch dataset).
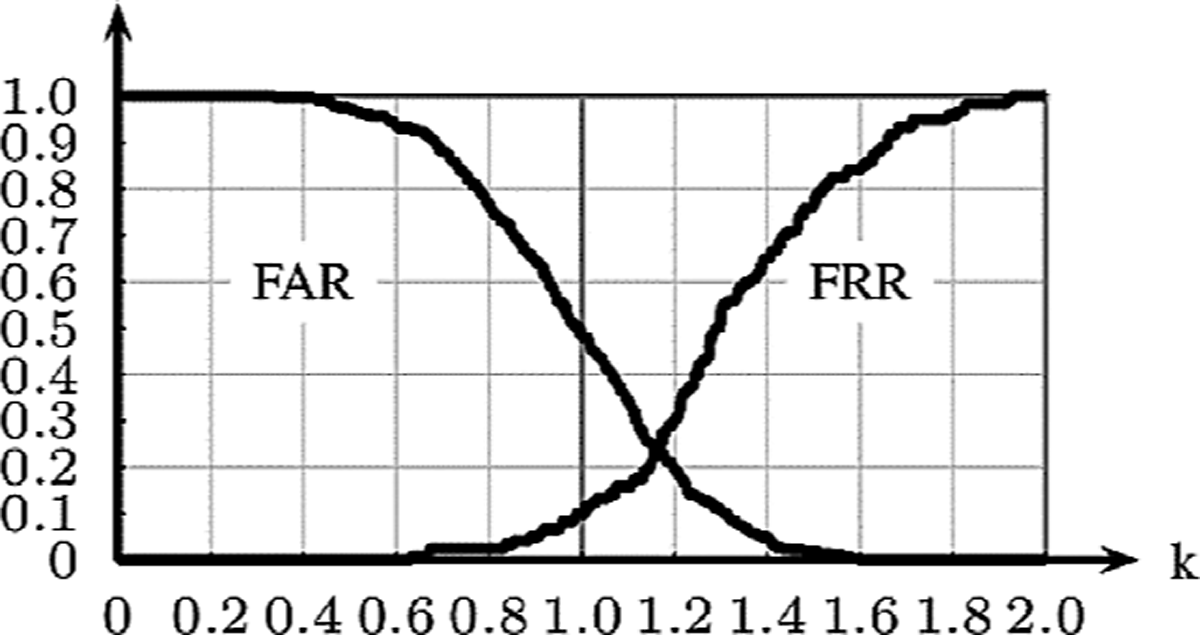
Figure 7.
False Acceptance Rate (FAR) and False Rejection Rate (FRR) respect to the thresholding parameter k and SQmax < k · SRavg (Chinese dataset).
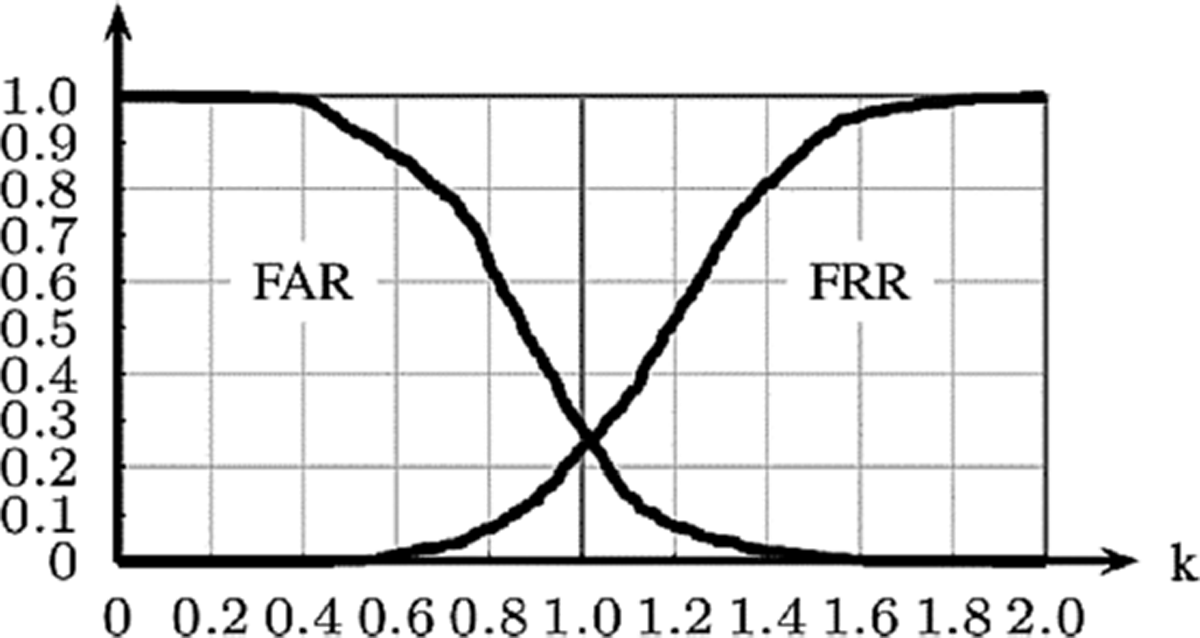
Figure 8.
False Acceptance Rate (FAR) and False Rejection Rate (FRR) respect to the thresholding parameter k and SQmax < k · SRavg (Japanese dataset).
For the Dutch dataset, the lowest false rejection and false acceptance rates were 20.83% and 20.81%, respectively, at k=0.86 with an accuracy of 79.18%. It was achieved with the constraint which takes into account the average similarity values; hence a questioned signature Q is rejected if SQavg < k · SRavg. See the related FRR/FAR curves in Figure 6.
The lowest FRR and FAR values are 24.17% and 24.25% respectively at k=1.16 with and 75.77% accuracy for Chinese evaluation set. It was achieved with the constraint that a questioned signature was rejected if SQmax < k · SRavg. See the related FRR / FAR curves in Figure 7.
In our experiments the 25.41% / 25.83% is the lowest FRR / FAR with an accuracy 74.36% at k = 1.02 for the Japanese evaluation set for the same constraint as that for the Chinese, and one when the SQmax is compared with the SRavg. See the related FRR / FAR curves in Figure 8.
Compared with the reported system for the SigComp2011 and SigWiComp2013 contests, the accuracy lies between 71.02% and 97.67% for the Dutch set, between 51.95% and 80.04% for the Chinese set, and between 66.67% and 90.72% for the Japanese set (see Tables 2, 3, and 4).
Table 2
Comparison of our results with those got from the systems submitted to SigComp2011 for the Dutch dataset
| Author | Accuracy (%) | FRR | FAR |
|---|---|---|---|
| Qatar | 97.67 | 2.47 | 2.19 |
| Qatar | 95.57 | 4.48 | 4.38 |
| HDU | 87.80 | 12.35 | 12.05 |
| Sibanci University | 82.91 | 17.93 | 16.41 |
| Proposed | 79.25 | 20.81 | 20.83 |
| Anonymous-1 | 77.89 | 22.22 | 21.75 |
| DFKI | 75.84 | 23.77 | 24.57 |
| Anonymous | 71.02 | 29.17 | 28.79 |
Table 3
Comparison of our results with those got from the systems submitted to SigComp2011 for the Chinese dataset.
| Author | Accuracy (%) | FRR | FAR |
|---|---|---|---|
| Sibanci | 80.04 | 21.01 | 19.62 |
| Proposed | 75.77 | 24.25 | 24.17 |
| Anonymous1 | 73.10 | 27.50 | 26.70 |
| HDU | 72.90 | 27.50 | 26.98 |
| DFKI | 62.01 | 37.50 | 38.15 |
| Anonymous2 | 61.81 | 38.33 | 38.15 |
| Qatar (Chinese opt) | 56.06 | 45.00 | 43.60 |
| Qatar (Dutch opt) | 51.95 | 50.00 | 47.41 |
Table 4
Comparison of our results with those got from the systems submitted to SigWiComp2013 for the Japanese dataset.
| Author | Accuracy (%) | FRR | FAR |
|---|---|---|---|
| Sab1 | 90.72 | 9.74 | 9.72 |
| Sab2 | 89.82 | 10.23 | 10.14 |
| Sab3 | 86.95 | 13.04 | 13.06 |
| Teb1 | 76.70 | 23.60 | 23.06 |
| Proposed | 76.55 | 25.83 | 25.41 |
| Teb5 | 74.59 | 25.41 | 25.42 |
| Teb2 | 73.98 | 26.07 | 25.97 |
| Bud | 72.70 | 25.23 | 25.36 |
| Teb4 | 72.10 | 25.89 | 27.92 |
| Teb3 | 68.33 | 31.35 | 31.94 |
| Qatar | 66.67 | 33.33 | 33.33 |
The results of our system lies in the midrange of the results for the Dutch and Japanese datasets compared to those got by the systems entered in the two competitions.
For the Chinese dataset, our system outperformed all the systems in the competitions, except for the winner from Sabanci University.
Other results with all the constraints are listed in Table 1.
Conclusions
In this paper, an offline signature verification systems was proposed and evaluated on public signature datasets. The system is based on the centerlines of the signatures and a similarity measure designed for centerline comparison.
Based on our experimental results (see Table 1), the constraints based on the average reference similarity always outperformed the global threshold, the minimal and maximal reference similarity, so outliers detrimentally affects the results, which was expected.
Although the system did not outperform all the systems in the recent competitions, the results are robust on different datasets and the system can be applied without the need for pretraining of parameter values.
Notes
Acknowledgments
This study was supported by the European Union and the State of Hungary, co-financed by the European Social Fund within the framework of the TÁMOP 4.2.4.A/2-11-1-2012-0001 ‘National Excellence Program’.
The authors are particularly grateful for the assistance given by their colleague József Németh, who supplied the method for the removal of the frames around Chinese signature images.