
Introduction
The revised EU Energy Performance of Buildings Directive (EPBD, 2024) sets out binding requirements for Member States to accelerate the transition of the building stock, including realising an energy efficiency improvement of at least 16% in the housing sector. In order for these goals to be operationalised in Sweden, a significant upscaling of measures is required in the existing single-family house stock, where large parts are currently characterized by high energy consumption and limited renovation rates. Extracts from the database of Swedish energy performance certificates (Gripen, 2022) show that for small buildings (less than 350 square meters) with the worst energy performance (energy classes F and G), about 25% are heated with direct electric heating or air-source heat pumps (where a few per cent have supplementary wood heating). At the same time, large-scale energy efficiency in the single-family house stock has great potential to free up electricity capacity for other purposes, especially during the coldest winter days when the electricity system is strained, and thus facilitate the security of supply of electricity in the future.
In order for the extensive measures that need to be implemented in the existing single-family house stock to be realised, the banking and finance sector must be able to contribute with reasonable loans. The Taxonomy Regulation (2021) provides the opportunity to classify an investment in energy efficiency measures as “green” if it can be verified through measurement that a single-family house qualifies among the top 15% of the best-performing single-family houses in the Swedish stock, or alternatively a 30% improvement in energy performance through renovation. A key instrument for ensuring the quality of implemented energy efficiency measures is independent verification through energy performance certificates. The Taxonomy Regulation explicitly requires that energy efficiency measures must be verified through measured data, and in this context, energy performance certificates constitute a key tool for quality assurance. Such an independent verification process is crucial to create equal and transparent conditions for lending and thereby minimising the risk of greenwashing and distorted competition between banks.
However, in practice, this means that two energy performance certifications are required, one before and one after the measures have been implemented. In addition, if the expected energy saving requirements are not met in the first year after the measures are implemented, further verification may be needed the year after that.
Only about 20% of Sweden’s single-family houses currently have a valid energy performance certificate (Gripen, 2022). Furthermore, a significant proportion of the existing certificates are older than five years and thus no longer representative of the buildings’ actual energy performance. The limited availability of energy performance certificates constitutes a structural obstacle to the extensive energy efficiency required in the single-family house stock. In addition, stakeholders in the banking and financial sector have identified the relatively high costs of issuing energy performance certificates as a key obstacle, which can dampen the willingness to invest and thus slow down the renovation rate needed to achieve the set climate and energy efficiency targets.
An energy performance certificate is a document that is produced by an independent certified energy expert conducting an energy audit of a building via a physical site visit. The purpose of energy labelling of buildings is partly to be able to describe the energy performance of buildings in a simple way and partly to make it possible to compare different buildings with each other. By using normalised and normal-year adjusted energy use, as well as weighting and adjustment factors, it is possible to compare different buildings with each other regardless of the building’s type of energy for heating, where they are located in Sweden or who currently lives in the building. The energy performance certificates are currently drawn up to fulfil two main functions:
to determine the energy performance of the building primarily based on measured energy use, including the calculation of the primary energy number and energy class and
to identify and propose cost-effective energy efficiency measures.
The procedures governing how an energy expert prepares an energy performance certificate was developed around the year 2006, with the introduction of the Swedish system for energy performance certification. Since then, the procedure has only undergone incremental adjustments, while the technical conditions for data collection have changed fundamentally. A major difference from the original procedure is that today the ordinary energy meters for electricity and district heating in single-family houses are read remotely and hourly meter data is continuously stored by the energy companies and can be retrieved directly by the property owner for the past several years. This development creates the conditions for completely new data-driven analysis methods, where the energy performance of buildings can be derived from actual, high-resolution measurement data over several years with significantly lower effort.
The power signature method is a data-driven approach that separates heating energy from domestic electricity and domestic hot water by analysing the relationship between a building’s instantaneous heat demand and the outdoor temperature. If the proposed method can determine measured energy consumption for space heating with greater certainty than current energy performance certification practices, it offers substantial potential for reducing both costs and time requirements, particularly when on-site inspections can be avoided and a building’s energy performance can be robustly inferred from remotely collected measurement data. Such a development would also strengthen the ability to perform repeated, measurement-based verifications after energy efficiency measures have been implemented.
Calculation of a building’s energy performance
In Swedish building regulations and in energy performance certificates, primary energy number (kWh/m², year) is used to describe a building’s energy performance (BBR 29, 2020). Annually supplied (purchased) energy is the starting point for calculating the primary energy number of a building which includes energy for heating, comfort cooling, hot water and the building’s operational electricity (such as energy use for fans and pumps). Domestic electricity (such as energy use for lighting, cooking and refrigeration) in dwellings is not included. The building regulations allow for energy consumption to be reduced by energy from the sun, wind, ground, air or water generated in the building or its garden and used for the building’s heating, comfort cooling, hot water and operational electricity. The supplied energy shall be determined with regard to normal usage by occupants and for a normal climatic year.
When preparing an energy performance certificate, measured energy use must be adjusted to represent normal use, since the certificate should reflect the building’s technical performance rather than occupant behaviour. To ensure comparability between buildings, measured values are therefore normalized for factors influenced by residents, such as the indoor temperature and domestic hot water use.
Energy use for heating must be adjusted to reflect a normal climatic year. This means that the measured heating energy (Eheat) is corrected depending on whether the measurement period was warmer or colder than normal. The certified energy expert is responsible for ensuring that the energy use is correctly normalised to represent normal use, while the normal-year correction itself is performed automatically in the energy performance certificate platform based on the reported energy use and the period for which the data apply.
The building’s primary energy number is calculated by dividing purchased energy into different energy carriers and multiplying it by a weighting factor per energy carrier. Energy for heating is corrected with a geographic adjustment factor as illustrated by the following equation:
Where:
EPpen is the building’s energy performance expressed by primary energy number (kWh/m2 and year)
Eheat is energy for heating, (kWh/year)
Fgeo is a geographic adjustment factor
Ecool is energy for comfort cooling (kWh/year)
EDHW is energy for domestic hot water (kWh/year)
Eel is energy for operational electricity (kWh/year)
WFi is a weighting factor per energy carrier i, for example, 0.7 for district heating and 1.8 for electricity
Atemp is the heated floor area (m²)
Single-family houses very rarely have comfort cooling and energy for operational electricity can be neglected in the vast majority of single-family houses. Normal use for hot water consumption in single family houses is equivalent to 20 × Atemp/ηDHW (kWh/m2 per year), where ηDHW is the efficiency of the preparation of the hot water (BEN, 2016), which means that EDHW is known. This means that only energy for heating need to be decided in order to calculate the primary energy number for the majority of single-family houses. For an energy performance certificate energy for heating (Eheat) shall be decided based on measured data for one year. However, for the majority of single-family houses, measured data are typically only available from billing meters that record total electricity consumption and total district heating consumption.
Current method for determining energy use for heating
In current method for issuing energy performance certificates, energy use for non-heating purposes as energy for domestic hot water, domestic electricity, operational electricity and other purposes is first estimated by assumptions and standards. Thereafter, energy use for heating is decided by subsequently subtract these estimations from the total measured energy consumption for one year. In this approach, energy use for heating is thus determined indirectly.
In the current method to energy performance certification, the estimated energy use for heating is reported. However, the underlying standards and assumptions used to derive this estimate are not explicitly disclosed. In practice, this means that it is difficult for a property owner, or external actor, to verify or fully understand how the reported results have been calculated. Furthermore, the method contains uncertainties with that the results may be based on assumptions about a so-called normal use without there being measurement data that verifies that the household actually uses the building according to standards. In addition, there are ambiguities regarding how the standards should be applied in practice, for example whether domestic electricity should be distributed over the entire heated floor area (including, for example, basements) or whether the energy expert has the opportunity to make his own assumptions.
Power signature method for determining energy use for heating
An alternative approach is to utilise measured data in combination with the power signature method, which instead enables a direct measured value of energy use for heating instead of standards and assumptions. Power signature is a well-established method for analysing a building’s energy and power needs in relation to the outdoor temperature (ASHRAE, 2002; Fumo and Biswas, 2015). For power signature, the building’s power use is first plotted against the outdoor temperature. The power signature is then produced through linear regression, where the slope of the power signature corresponds to the house’s heat loss factor in W/°C (Nordström, 2014) according to:
Where P (Watt) is the house’s power consumption, P0 (Watt) is the power needed at 0°C outside, K (W/°C) is the heat loss factor of the house and, Toutdoor (°C) is the outdoor temperature, see example of power signature in Figure 1.
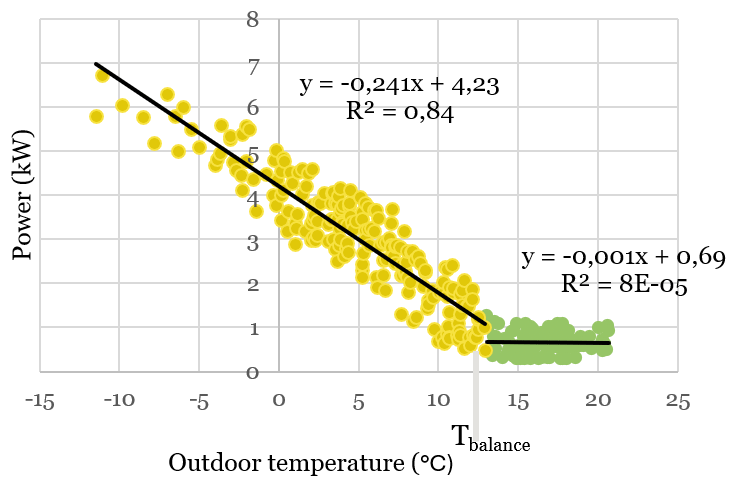
Figure 1
Example of power signature for a single-family house.
The power signature has two parts separated by the building’s balance temperature. Below this temperature, heating is needed and the heat demand varies with the outdoor temperature. Above the balance temperature, the demand is constant and independent of the outdoor temperature; this upper part is the base load, consisting of domestic electricity, operational electricity, and domestic hot water (Fransson, 2014).
The heat loss factor, represented by the slope of the power signature, describes how much heating power the building requires per degree of outdoor temperature. To determine this factor, the building’s balance temperature must first be identified. The base load shifts the power signature up or down but does not affect its slope.
Assuming that domestic hot water use is entirely temperature-independent and thus has a slope of zero W/°C can, however, be a simplification. A building’s balance temperature depends on its envelope characteristics and typically ranges from about 10 to 17°C. It is also influenced by occupant behaviour, such as chosen indoor temperature and internal heat gains from people and domestic electricity.
Although the base load is not primarily intended for heating, parts of it still contribute to heating the building. Approximately 20% of the energy used for hot-water preparation and 70–80% of domestic electricity become internal heat gains (Nordström, 2014).
A model is a simplified representation of reality, and the R² value indicates how well the model fits the observed data. In Figure 1, two R² values are shown for the two sections of the power signature: 0.84 and 0. An R² value expresses how well a linear equation represents the relationship between power demand and outdoor temperature. The equation for calculating R² is defined as follows:
Where yi is the observed value, is a value predicted by the model (the straight-line equation) and is the mean of all observed values. R2 means how much of the variation the model actually captures. If R2 is equal to zero, the model explains nothing, and if R2 is equal to one, the model explains that all variation is perfect, which means that all data points are on the straight line. It is therefore reasonable that R2 is zero for the non-outdoor temperature-dependent part of the power signature since there is then no relationship between power and outdoor temperature.
For houses with high energy use and poorer energy classes, the correlation between outdoor temperature and heating power is strong, resulting in high R² values. This is because internal heat gains and solar gains are small compared with the total heating demand. In low-energy buildings with well-insulated envelopes, the heating demand is much lower, so internal heat gains and solar radiation have a larger relative impact. This weakens the correlation between outdoor temperature and heating power, resulting in lower R² values and making the power signature method less reliable for assessing the building’s heat loss factor (Fransson, 2014).
To calculate energy use for heating from measured annual data, the degree days corresponding to the year of observation are first calculated in accordance with (Fransson, 2014):
where DD is the number of degree days during the year, Tbalance is the house’s balance temperature (°C) and Toutdoor(d) is the daily average outdoor temperature for day d, and max(0, .) means that if the outdoor temperature is higher than the balance temperature, there are zero degree days for that day.
A balance temperature of about 17°C is commonly assumed for older houses (Fransson, 2014). However, the actual balance temperature depends on behaviour-related factors such as the number of occupants, the amount of domestic electricity used, and the chosen indoor temperature, since these factors contribute to different amounts of internal heat. To calculate a building’s heating energy as accurately as possible, it is therefore important to use the specific balance temperature of the individual house.
Annual energy for heating, Eheat (kWh/year), is calculated using the heat loss factor from the power signature, according to Equation (2) and the number of degree days from Equation (4) as follows:
When the annual heating energy has been calculated according to Equation (5), the remaining measured energy use of the building represents other purposes as domestic hot water and domestic electricity.
For buildings that have district heating the energy consumption for hot water can be calculated using the power signature method. Once the energy demand for heating has been determined using the power signature, the remaining part of the total district heating energy is the energy consumption of domestic hot water.
Aim
This study aims to theoretically investigate whether the power signature method can improve the quality and simplify the issuing of energy performance certificates for single-family houses, and to assess whether certification can be performed without site visits through automated application of the method.
Limitations
The study does not address part two of energy performance certificates, i.e. the development of proposals for cost-effective measures.
Method
The study was conducted by analysing measured electricity and district heating consumption data from eleven single-family houses using the power signature method. The analysis was conducted fully remotely in order to test if the power signature method could be used without on-site visits.
In addition, energy use for heating was determined for three of the houses in accordance with the current method applied for energy performance certification, and the results were subsequently compared with those obtained using the power signature method.
Data collection and resolution with power signature method
Energy data for the single-family houses was collected by having each homeowner download electricity and district heating consumption data from their energy network providers. Total water use was obtained from the homeowners’ readings of the water meter at the time of billing, which occurs roughly once a year. The total water consumption is therefore an annual average value. Outdoor temperature data was obtained either from the electricity network company or from climate data files (SVEBY/SMHI, 2025) corresponding to the specific years for which measurement data was available. For houses with district heating, separate power signatures were generated for district heating and for electricity.
To analyse which data resolution gives reliable results, house 1 was analysed with three different resolutions of the hourly data: hourly mean, daily average or weekly average. Daily energy use in kWh/day was divided by 24 to obtain the average daily power in kW. Weekly values were created by calculating weekly averages from daily mean outdoor temperatures and daily mean power.
In Figure 2 the results shows that the heat loss factor is only 4% higher when using weekly average data compared with hourly data, and therefore varies only slightly with data resolution. This means that for house 1, any of the three data resolutions can be used, the output of the power signature will be similar.
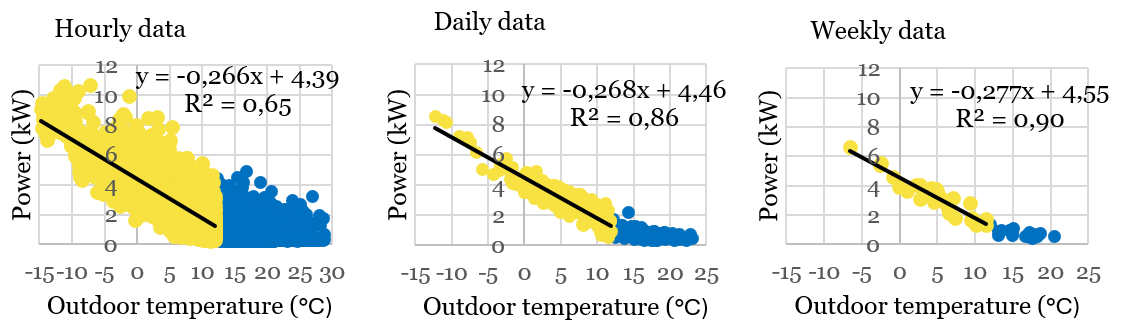
Figure 2
Comparison of power signatures for three different data resolutions: hourly mean(left), daily mean (middle) and weekly mean (right).
The highest R² value is obtained when using weekly average data, where daily and hourly variations have been smoothed out. The R² value is lower for daily averages, indicating variations between individual days, and lowest for hourly data, which contains the largest fluctuations.
In heat-resistant buildings, and in buildings with hydronic heating systems, the effect of heat supplied for one hour influences the building for several hours afterwards. As a result, the outdoor temperature measured in a specific hour does not always correspond to the heating power used during that hour. Using daily average values helps reduce this mismatch by evening out these delays. At the same time, daily averages make it possible to detect anomalous data points, such as absence or unusually high energy use on a single day. With 365 data points, the dataset is large enough that individual deviations do not significantly affect the slope of the power signature.
For low-energy houses or if the heating system uses underfloor heating, daily average data can still show large variations because the building’s thermal inertia extends beyond a single day. For buildings with high thermal inertia, weekly average data may therefore be more representative. The disadvantage is that the number of measuring points is significantly fewer (only 52 per year), which means that a single week can significantly affect the slope of the power signature, for example if the house is unoccupied. To compensate for this, it may be preferable to use data from several years when applying weekly averages, to ensure a sufficiently large and reliable dataset.
To compare the results of the power signature using daily and weekly average data, it can be useful to produce a power signature for each. In the analysis for each single-family house, both daily and weekly averages were plotted to assess the differences, but only the results based on daily average data are presented below.
Determination of energy use for heating with current method
Limited energy performance certificates were carried out for buildings 2, 5 and 6 using the method according to current method. The work was restricted to determine the use of energy for heating and did not include calculation of primary energy number or energy classes based on normal use and a normal year, nor is the possibility of cost-effective measures studied. The purpose was to compare the energy use for heating using the power signature method with those obtained using the current method. The work was carried out by a certified energy expert. The expert interviewed each homeowner and used the same collected data as in the power-signature analysis. The following aspects were considered during the work:
Atemp is the floor area heated to at least 15°C. If basements have radiators but these are turned off, this area is included in Atemp. If there is garage in the building, this area is not included in Atemp, but any heating of the garage is included.
Operational electricity is almost negligible for single-family houses. This includes energy for circulation pumps and ventilation fans that has been estimated based on the power and operating time of circulation pumps and fans (20, 190 and 180 kWh per year for respective house).
To estimate domestic electricity, the standard according to the building regulations has been applied (30 kWh/m2 Atemp). The exception is the building that is newly built (house 6), which is assumed to use less domestic electricity thanks to energy-efficient appliances and here 20 kWh/m2 Atemp is used.
Energy for hot water use has been calculated based on recommendations in the building regulations. Based on cold water volume, the annual energy for hot water can be calculated according to: EDHW = 0.35 * V × 55/ηDHW (kWh/year) where V is the volume of total water (m3) and ηDHW annual efficiency for the preparation of hot water. The annual efficiency is assumed to be 1.7 for both exhaust air heat pump and air-water heat pump.
Other buildings that are independent of the actual building, but are measured on the same meter, shall not be included in the energy performance, neither the area nor the energy use. This is relevant for two of the buildings and here the electricity consumption of the detached buildings has been estimated, in order to be subtracted from the total energy use, using the transmission losses for the building based on estimated U-values and measured areas for walls, ceilings and floors and degree days for the locality in combination with the indoor temperature.
Electricity use that is measured but used outside the building in question is not included. One of the buildings has electric car charging. This electricity has been estimated with annual mileage (12,000 charged km) and estimated electricity consumption per km (0.25 kWh/km) based on interviews with the residents.
Finally, energy for heating is calculated by subtracting electricity from total electricity consumption from other buildings, other outdoor use, domestic electricity, operational electricity and electricity for hot water preparation.
Analysis with power signature
Table 1 shows the results of the power signature analyses based on the collected measurement data, together with the calculated heating energy according to Equation (5) and the remaining share, which represents energy for domestic hot water and domestic electricity. The table also includes information about each house’s heating system, energy class from previous energy performance certificates, and whether the buildings have photovoltaic systems. The values represent the actual year studied and are not normal-year corrected.
Table 1
Estimated energy for heating with power signature and energy use for domestic hot water and domestic electricity.
| HOUSE NO: | HEATING SYSTEM | ENERGY CLASS1 | HEAT LOSS FACTOR (W/°C) | BALANCE TEMPERATURE (°C) | R2-VALUE | ENERGY FOR HEATING (kWh/YEAR) | ENERGY FOR DOMESTIC HOT WATER (DHW) AND DOMESTIC ELECTRICITY (DE) (kWh/YEAR) |
|---|---|---|---|---|---|---|---|
| 1 | Air-water heat pump | 268 | 12 | 0.86 | 10,238 | 9,173 | |
| 2 | Air-water heat pump2 | C | 240 | 14 | 0.76 | 12,256 | 3,060 |
| 3 | District heating | 94 | 14 | 0.71 | 4,656 | DHW: 4,822 | |
| Electricity | 54 | 22 | 0.61 | 5,987 | DE: 7,486 | ||
| 4 | District heating | 517 | 16.5 | 0.82 | 33,801 | DHW: 3,579 | |
| Electricity | –2 | 0.1 | DE: 3,990 | ||||
| 5 | Exhaust air heat pump | D | 141 | 11.5 | 0.68 | 5,255 | 7,043 |
| 6 | Exhaust air heat pump | B | 121 | 9 | 0.84 | 3,054 | 4,175 |
| 7 | Direct electric heating | F | 236 | 14.8 | 0.77 | 13,212 | 5,423 |
| 8 | Exhaust air heat pump2 | B | 62 | 14 | 0.27 | 3,150 | 6,458 |
| 9 | Air-water heat pump2 | 119 | 13 | 0.82 | 5,400 | 4,046 | |
| 10 | Ground source heat pump, Passive house2 | A | 52 | 11 | 0.17 | 1,559 | 5,584 |
| 11 | Electric boiler, year 2020 | E | 184 | 15 | 0.78 | 8,562 | 6,811 |
| Electric boiler, new windows, year 2021 | 130 | 15 | 0.75 | 7,575 | 10,517 | ||
| Air-water heat pump, year 2024 | 70 | 13 | 0.76 | 2,804 | 3,241 |
[i] 1For those houses where an existing Energy Performance Certificates is available.
2PV-system is available. Self-produced solar power not included in the power signature.
The energy data on which the power signature is based is the total energy used in the house, i.e. both energy for heating and hot water, as well as domestic electricity in the electrically heated houses. Therefore, there are many factors that affect individual data points, which in turn affect how well the linear model explains the relationship between energy for heating and the outdoor temperature. The higher the proportion of the total energy consumption that is attributed to heating, the less impact varying use of domestic electricity and hot water has on the power signature.
The R² values of the power signatures range from 0.27 to 0.89. Higher R² values are seen in houses with higher heat loss factors, Houses 1, 2, 4, 7 and 11, because their energy use correlates more clearly with the outdoor temperature. In contrast, Houses 8 and 10 have low R² values and also low heating demand.
For House 6, which has an exhaust-air heat pump and a hydronic underfloor heating system, the balance temperature was more difficult to identify than for the other houses. The base load also showed a clear temperature dependence, with a slope of 32 W/°C. Different balance temperatures were tested by calculating the heating energy and comparing the remaining part (domestic electricity and hot water) with standard values to find reasonable results. This gave a low balance temperature of 9°C with a high R² value and a plausible domestic electricity level. The high R² value may be partly due to the low balance temperature leaving fewer data points in the heating region, which increases the model fit. In addition, the house’s hydronic underfloor heating system means that daily average data may not capture the building’s full thermal inertia. When using weekly averages instead, the analysis produced an R² of 0.94, a higher balance temperature of 13°C, higher heating energy (4,984 kWh/year), and a much lower temperature dependence in the base load. A likely reason why the balance temperature is hard to identify is that the heating is provided by an exhaust-air heat pump, whose heat source depends on the building’s internal heat gains.
For House 3 heat loss factors based on district heating data and on electricity are presented. The correlation between electricity use and outdoor temperature depends mainly on underfloor heating for comfort purposes in the bathrooms and the furnished part of the basement. Since there is no clear balance temperature and baseload part, as in the other power signatures, the underfloor heating system has been assumed to be operational for outdoor temperatures up to 22°C.
House 4 also has district heating. Here the electricity use shows no correlation with outdoor temperature dependence (heat loss factor –2 W/°C). That is, no electricity is used for heating and the base load thus corresponds to the domestic electricity.
House 8, which has an exhaust-air heat pump, also has a photovoltaic system that could not be included in the power signature analysis because data on self-used PV electricity was unavailable and sold electricity was only reported monthly. The house also uses a wood-burning stove and has an electric car. With an energy class B, the heating demand is low, which is likely one reason why the R² value is low.
House 10 is a passive house and has a photovoltaic system and a ground source heat pump for heating supply air, but also for a comfort underfloor heating system that is used sparingly. The R2 value of the power signature is very low, only 0.17. The resulting annual energy is low, only 1,559 kWh/year, which is in line with the design heating values.
Houses 2 and 9 have air-to-water heat pumps and photovoltaic systems with installed capacities of 6.4 kW and 11 kW, producing about 6 MWh/year and 10 MWh/year, respectively. The self-used PV electricity is not included in the power signature, which explains the low base load. For House 2, daily data on self-used solar electricity was available, allowing a comparison of power signatures with and without the PV production included. The difference in the heat loss factor was negligible. This is because PV production is limited on cold days, precisely those days that most strongly influence the slope of the power signature.
House 11 is a terraced house with neighbors on both sides. Energy-saving measures have been carried out: window replacement in 2021 and installation of a new air-to-water heat pump and mechanical exhaust ventilation in the bathroom and laundry room in 2023. Figure 3 shows the power signatures before the measures (left) and after (right). As a result of implementing the measures, the slope of the power signature decreased from 184 W/°C to 70 W/°C, reducing the annual heating energy from 8,562 kWh/year to 2,804 kWh/year and improving the building’s energy class from E to C. The results also show a significant reduction in domestic electricity and hot-water electricity use, including more efficient hot-water production. The power signature for 2021 (middle) has a heat loss factor of 130 W/°C, representing a 30% improvement in the building envelope compared with the original state. This corresponds to a 29% reduction in heating energy after normal-year correction.
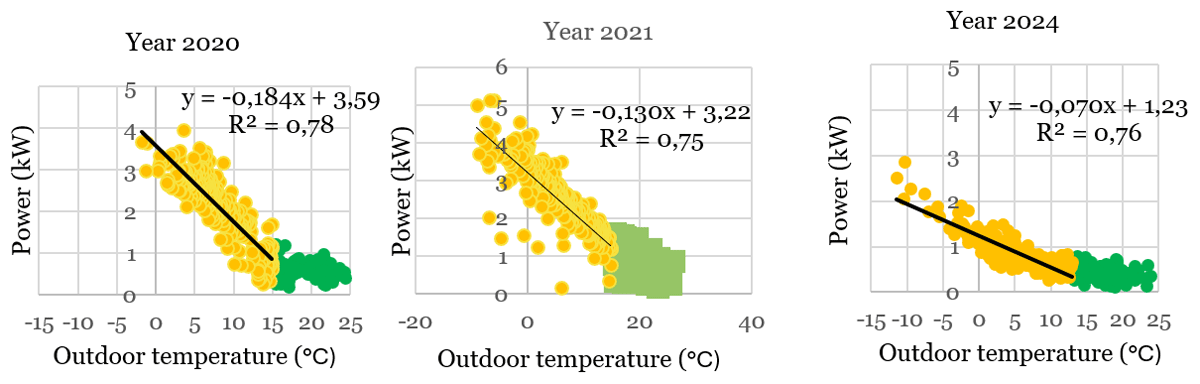
Figure 3
Power signature for building 11, year 2020 (left), after replacement of windows (centre, 2021) and after installation of air-water heat pump and mechanical exhaust ventilation (right, 2024).
Comparison between the two methods
Table 2 compares the results from the limited energy performance certification carried out according to current method for buildings 2, 5 and 6 with results from analysis using the power signature method. The values presented reflect actual energy used and are not corrected for normal use nor normal year.
Table 2
Energy for heating for Houses 2, 5 and 6 based on the current method and the power signature method.
| HOUSE | ELECTRICITY FOR HEATING | DOMESTIC ELECTRICITY AND ELECTRICITY FOR DOMESTIC HOT WATER | ||
|---|---|---|---|---|
| CURRENT METHOD (kWh/YEAR) | POWER SIGNATURE METHOD (kWh/YEAR) | CURRENT METHOD (kWh/YEAR) | POWER SIGNATURE METHOD (kWh/YEAR) | |
| 2 | 7,022 | 12,256 | 7,098 + 1,076 = 8,174 | 3,060 |
| 5 | 2,605 | 4,285 | 4,330 + 3,500*+ 1,348 = 9,178 | 8,153 |
| 6 | 3,042 | 3,054 | 2,634 + 1,132 = 3,766 | 4,175 |
[i] *Electricity for electric car.
For Houses 5 and 6, 467 kWh and 240 kWh respectively were subtracted from the total energy use in the current method because this energy was used for heating detached auxiliary buildings. This adjustment was not applied when testing the power signature method, as part of the evaluation aimed to assess whether the method could be implemented entirely remotely. As a result, this energy use is included in the estimated heating energy, leading to an overestimation. For Houses 5 and 6, the overestimation is approximately 11% and 8%, respectively.
The two methods yield similar estimates for heating energy use for House 6. One possible explanation is that energy use for domestic hot water and domestic electricity, as defined by the building regulations’ standard assumptions for normal use, was applied both in the current method and in the determination of the balance temperature for the power signature method.
In the current method, domestic electricity consumption is calculated based on the standard assumptions for normal use specified in the building regulations. Accordingly, domestic electricity use was estimated at 7,098, 4,330, and 2,634 kWh/year for Houses 2, 5, and 6, respectively. As these standard values are determined on the basis of the heated floor area (Atemp), it is likely that domestic electricity consumption has been overestimated for House 2, which has a large basement area. This overestimation, in turn, leads to an underestimation of the calculated energy use for heating.
Another example illustrating how the standard assumptions for normal use in the building regulations may overestimate domestic electricity use is provided by House 4. House 4 uses district heating for both heating and domestic hot water; consequently, the measured annual electricity consumption of 3,990 kWh mainly represents domestic electricity use. This can be contrasted with the considerably higher value of 9,300 kWh per year obtained when applying the standard assumptions specified in the current method. Similarly, the district heating energy used for domestic hot water can be estimated at 3,579 kWh/year based on the power signature method. With the current method it is 2,240 kWh/year based on the known volume of cold water use.
In the current method, an additional electricity use of 3,500 kWh/year was assumed for charging electric vehicles in House 5. This adjustment was not applied when testing the power signature method, as part of the evaluation aimed to assess whether the method could be implemented entirely remotely. Despite this, the power signature method clearly identifies higher domestic electricity and domestic hot water energy use for House 5 than for House 6. This suggests that separate metering for specific uses that are not outdoor temperature dependent, such as electric vehicle charging, is not required when applying the power signature method, provided that the usage pattern is relatively consistent throughout the year.
For houses heated with pellets or wood, reported fuel quantities are often only monthly estimates, which makes the power signature method unusable. The high uncertainty in fuel reporting also means that the current method in energy performance certification is not sufficiently reliable in these cases.
Discussion and conclusions
When issuing an energy performance certificate, it is important that the work is carried out in a way that is both transparent and systematic. Transparency means that the assumptions that form the basis for the calculations are clearly accounted for and justified, while systematics means that the method is applied consistently between different buildings and by different certified energy experts. This is key to ensuring comparability, traceability and quality of energy performance certificates.
In the current method for issuing an energy performance certificate, ambiguities exist in how heating energy use is determined, which may result in variations in assessments and reduce the comparability of energy performance certificates. The power signature method, however, creates the conditions for increased transparency, improved comparability and strengthened quality assurance of energy performance certification. By basing the main calculations on measured values instead of standards and assumptions, it becomes possible to more clearly distinguish energy for heating from user behaviour. The proposed method is based on a clearly defined and systematic calculation step, which means that the results in practice will be independent of which energy expert performs the analysis.
Furthermore, the study shows for one of the houses, how the power signature method can be used to verify the outcome of energy efficiency measures, such as window replacement. In the year following the window replacement, the analysis indicates that the building’s heat loss factor improved by approximately 30%, corresponding to a reduction in heating energy consumption of 29% after normal-year adjustment. This provides an example of how compliance with requirements under the EU Taxonomy framework can be verified. Notably, this improvement could be identified using the power signature method despite an 18% increase in the building’s total electricity use during the same period, as a result of increased domestic electricity. Using the current method for energy performance certification, this improvement in energy performance would not have been verifiable when issuing a new certificate.
The example thus shows that the power signature method is a powerful tool for assessing and following up on the results of energy-saving measures. In practice, it is one of the few methods that, even at short measurement intervals, can directly and visually show how the building’s energy performance changes over time. Besides that, the result is robust in relation to variations in the users’ behaviour it is also independent whether the measurement period coincides with a year with normal outdoor temperature or not.
Assessment of excluding site visit
When comparing the two methods, it can be stated that the site visit cannot be completely ruled out for the power signature method. When an energy performance certificate is produced for the first time for a single-family house, the energy expert needs to visit the building to:
determining the heated floor area,
distinguish between energy uses that should, or should not, be included in energy performance,
determine deviations from normal use.
Furthermore, the certified expert should propose cost-effective energy efficiency measures, which have not been investigated in this study, that in anyway require a site visit.
In the case of issuing a revised energy performance certificate, e.g. after an energy efficiency improvement, new energy data can be downloaded from the energy company, and the power signature method can be used directly to determine the new energy performance. This can then be done without site visits and automatically carried out in a few minutes.
Further work
This study demonstrates that the power signature method can be applied to single-family houses across energy classes ranging from F to A. However, the coefficient of determination (R²) of the power signature was generally lower for more energy-efficient houses, indicating a weaker temperature dependency of energy use. Consequently, the method as applied in this study is more suitable for houses with poorer energy performance, where energy use for heating constitutes a larger share of the total energy use.
However, to further improve the applicability of the method for buildings with low energy use, additional development of the automatic determination of the balance temperature is required. This also applies to buildings in which part of the base load exhibits temperature dependency.
For example, a regression model could be used with a breakpoint, also called a piecewise linear function. The breakpoint can be determined automatically by minimizing the sum of squared deviations between measured and modelled values together with other limitations such as a predetermined interval for the balance temperature. Boundary conditions can also be tested with standards of domestic electricity and domestic hot water or variation in energy efficiency of air-to water heat pumps with the outdoor temperature. In the study, analyses have mainly been carried out with daily resolution. With an automated process, power signatures can be generated from data with different temporal resolutions, for example weeks or 3-day averages, that may be more suitable for more heat-resistant buildings.
Analysis of user-related parameters, such as presence and absence in the house, needs to be further developed in order to be excluded in a structured way when using the power signature method. It also needs to be determined whether a single simple and relatively cheap meter can make correction to normal use more reliable, such as indoor temperature sensors. The results of this study indicated that separate meters for charging electric cars, other large domestic electricity uses, or hot water are not needed as long as the use is relatively constant during the year. However, this indication needs to be verified. In addition to this, other large electricity consumption that should not be included, also needs to be handled, such as outdoor temperature-dependent heating of a detached building.
Moreover, electricity use that is classified as operational electricity shall be included in the building’s energy performance. Although such electricity use is typically limited in single-family houses, it can be substantial in specific cases, for example when underfloor heating operates continuously irrespective of season or when dehumidifiers are used in older crawl spaces. In the power signature method, this temperature-independent electricity constitutes part of the base load and therefore does not influence the slope of the power signature or the calculated heating energy. Nevertheless, to ensure an accurate determination of the building’s total energy performance, this electricity use must still be identified and added to the building’s energy performance.
The study indicates that measurement for used produced photovoltaic electricity is not necessary to determine a building’s heat loss factor. This is because a normally dimensioned photovoltaic system located in the southern part of Sweden provides limited photovoltaic power production at low daily temperatures, which has a major impact on the slope of the power signature. The difference in heat loss factor could be greater for a building with a larger photovoltaic power plant or for a building located further north that has a large heating need in March and April when more photovoltaic electricity is produced. This needs to be investigated further.
An automated way of producing the power signature would both make the process easier and reduce variations in results from assessments of different experts. An analysis of a single-family house’s energy performance could thus be carried out in a few minutes, with the potential to be done at a very low cost.
Additional Files
The additional files for this article can be found as follows:
Förenklad metod för energideklarering av småhus
Detailed report in Swedish. DOI: https://doi.org/10.66506/essp.7-212-26.s1
PowerPoint Slides
PowerPoint Slides relating to this article. DOI: https://doi.org/10.66506/essp.7-212-26.s2
Acknowledgements
We thank the Swedish Energy Agency for financing this work and the participating homeowners for contributing data to the study.
eceee paper ID
7-212-26