
Table 1
Technology-specific operationalisation of well-being indicators for energy system modelling.
| WELL-BEING DIMENSION | OPERATIONALISED INDICATOR | DATA SOURCE | CONCEPTUAL BACKGROUND |
|---|---|---|---|
| Income and Wealth | Levelised cost of electricity per kWh by technology (€/kWh) | Secondary data sources (literature and existing databases) | Energy costs are a direct impact on disposable income, with limited options to reduce them for households. Income is a component of well-being in any market economy. |
| Employment | Full-time equivalents (FTE) per unit of energy or installed capacity by technology | Secondary data sources (literature and existing databases) | Energy production creates jobs, in many cases relatively well-paid jobs. Employment is highly relevant for well-being, both for income and for various psychological benefits. |
| Environmental Quality (objective) | Technology-specific CO2 emissions per kWh (t CO2/kWh) | Secondary data sources (literature and existing databases) | Emissions endanger the stability of the climate system and thereby the quality of the natural environment as a direct element of well-being. They also endanger future well-being. |
| Land use intensity per kWh by technology (m²/kWh) | Secondary data sources (literature and existing databases) | Land use by energy technologies directly degrades natural spaces that are relevant to well-being, they can also lose some of their ability to provide ecosystem services. | |
| Environmental Quality (subjective) | Perceived landscape impact of the respective technology (Likert scale 1–5) | Primary survey data | Parallel with objective indicators (see above), the perceived impact on landscape quality can directly influence well-being. |
| Level of concern regarding potential environmental impacts of technology expansion (Likert scale 1–5) | Primary survey data | Various elements of environmental quality influence well-being, e.g. air quality, water quality, noise. These can all be impacted by energy technologies. | |
| Personal Security | Import dependency of critical raw materials by technology (share of imported inputs, %) | Secondary data sources (literature and existing databases) | Security in different forms is relevant to well-being, here it is in the form of a reliable energy supply being secure or not, with security dropping if supply chains are easily disrupted. |
| Civic Engagement and Governance | Minimum required financial investment for participation in the technology (ordinal scale) | Secondary data sources (literature and existing databases) | Being able to partake in decision-making at various societal levels is a direct contributor to well-being. If more people can directly decide on the use of a technology by simply deploying it, it should be beneficial for well-being. |
| Degree of decentralised ownership or installation structure (scale value) | Secondary data sources (literature and existing databases) | As above, if more people are able to participate in a more decentralized system, it will optimize well-being. | |
| Perceived societal connectedness or trust in the technology (Likert scale 1–5) | Primary survey data | With more connectedness and trust in the technology a higher level of civic engagement is possible, leading to well-being gains. | |
| Perceived contribution of the technology to the energy transition (Likert scale 1–5) | Primary survey data | This indicator more broadly captures the multi-dimensional benefits of the energy transition, overlapping with some to the indicators above. |
Table 2
Descriptive statistics on indicator importance (1–5 Likert scale).
| ITEM | MEAN | STANDARD DEVIATION (SD) | MEAN/SD |
|---|---|---|---|
| f3_1: Low energy costs for the population | 4.34 | 0.88 | 4.95 |
| f3_2: Job creation | 3.91 | 1.01 | 3.87 |
| f3_3: Reduction of CO2 emissions | 4.03 | 1.15 | 3.51 |
| f3_4: Low land use/Minimal land consumption | 3.55 | 1.12 | 3.16 |
| f3_5: Low impact on environment and nature (e.g., biodiversity, soil, water balance) | 4.25 | 0.93 | 4.55 |
| f3_6: Minimal visual impact on the surroundings or landscape | 3.18 | 1.26 | 2.52 |
| f3_7: Easy financial participation for citizens through low entry-level contributions | 3.75 | 1.13 | 3.32 |
| f3_8: Diverse actors involved in energy supply (e.g., private individuals, cooperatives, municipalities, not just large corporations) | 3.62 | 1.14 | 3.17 |
| f3_9: Use of technologies that can be trusted | 4.43 | 0.83 | 5.35 |
| f3_10: Low dependence on raw material imports | 4.24 | 0.96 | 4.40 |
| f3_11: Positive impact on energy transition (climate protection, sustainability, energy independence) | 4.14 | 1.08 | 3.85 |
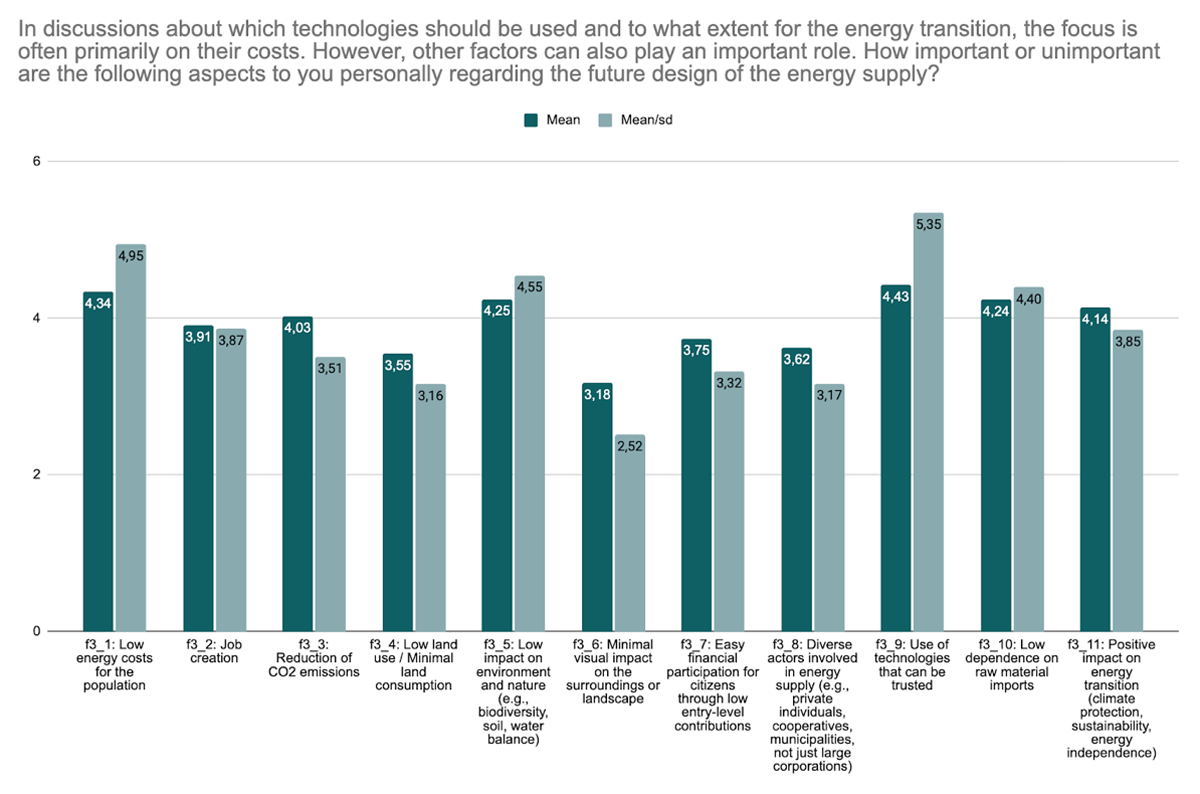
Figure 1
Results for indicator weights based on responses on importance (1–5 scale): simple mean and mean/sd (full sample).
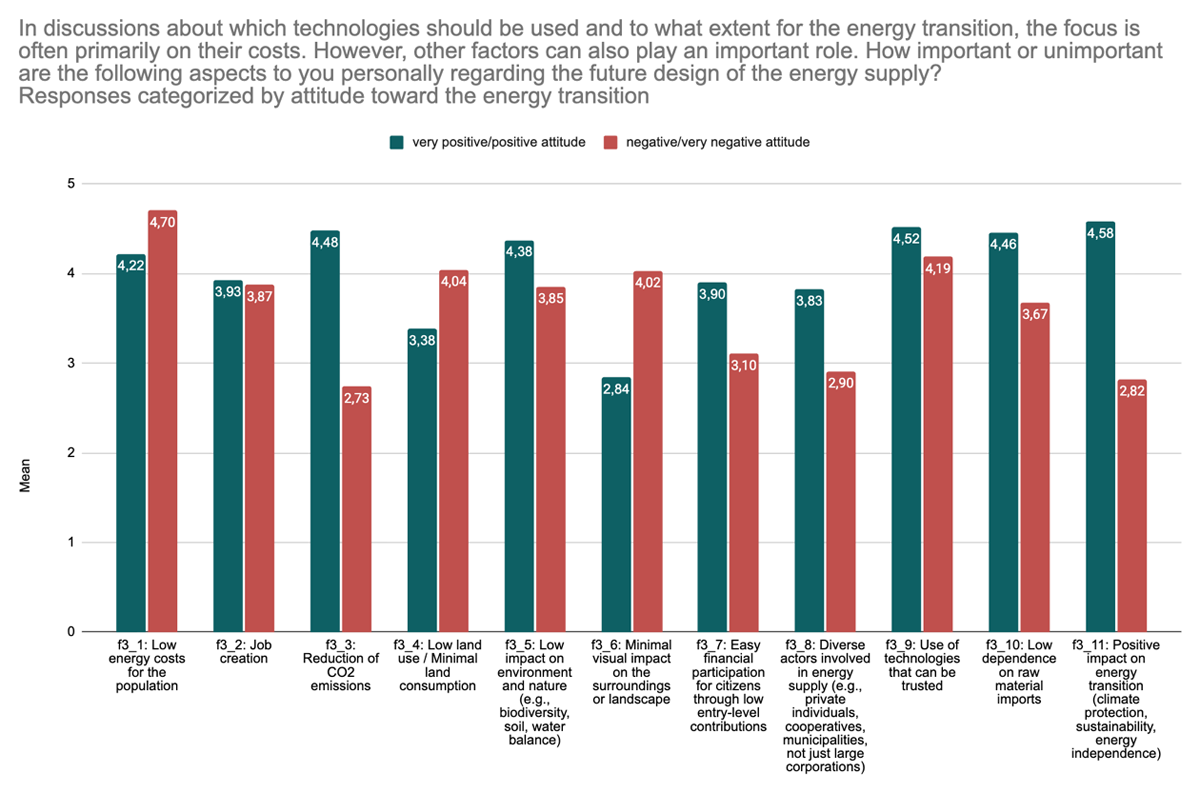
Figure 2
Results for indicator weights based on responses on importance (1–5 scale): mean by positive (n = 540) and negative (n = 183) attitude towards energy transition.
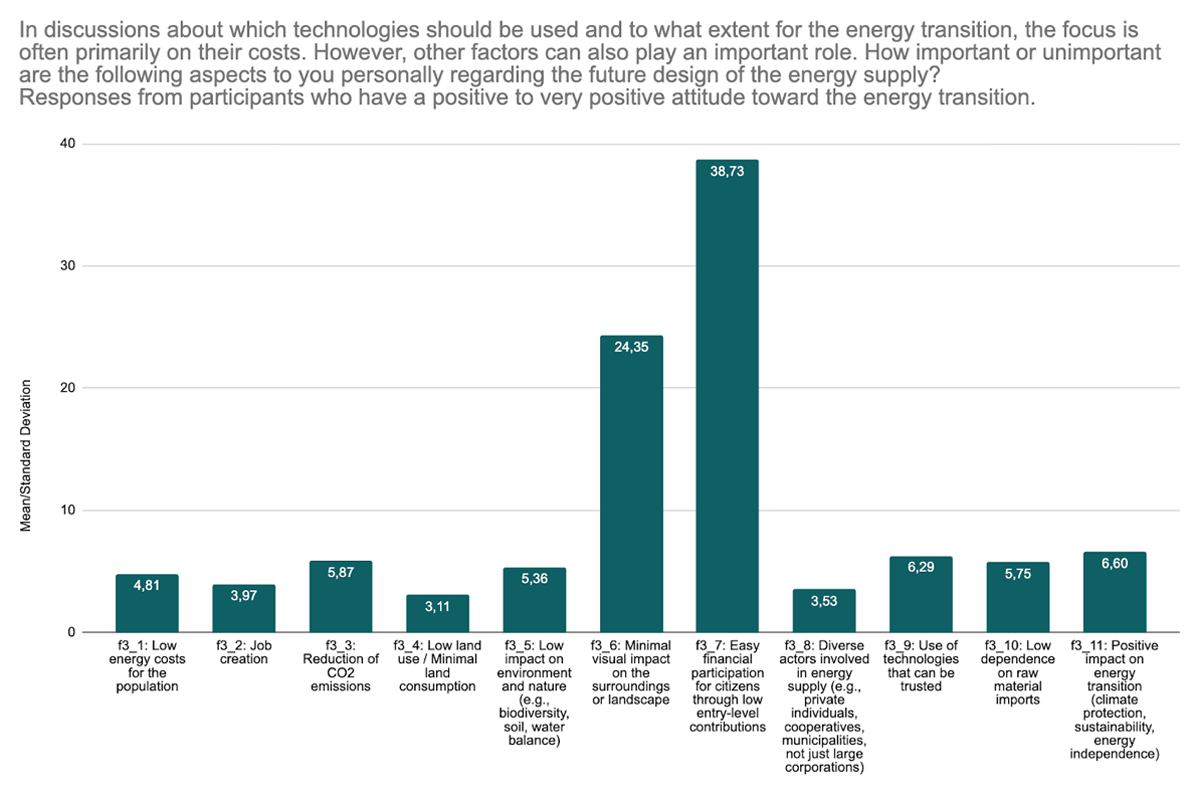
Figure 3
Results for indicator weights based on responses on importance (1–5 scale): mean/sd for sub-sample on positive attitude towards energy transition (n = 540).
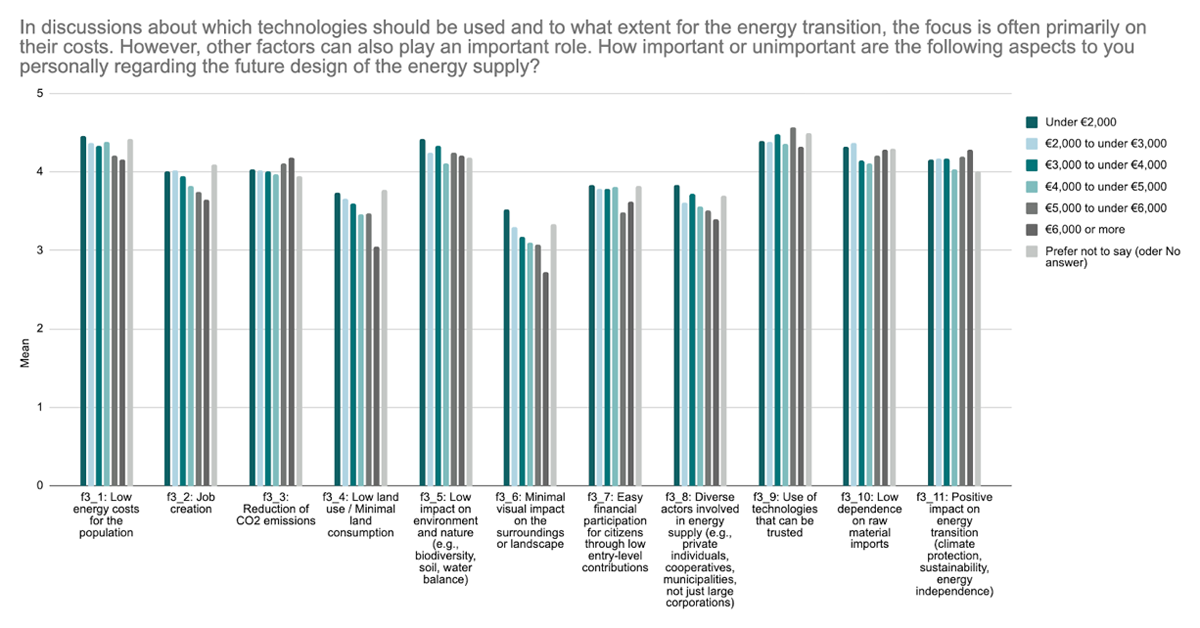
Figure 4
Results for indicator weights based on responses on importance (1–5 scale): mean by income classes (total n = 1019, income classes n = [112,193]).
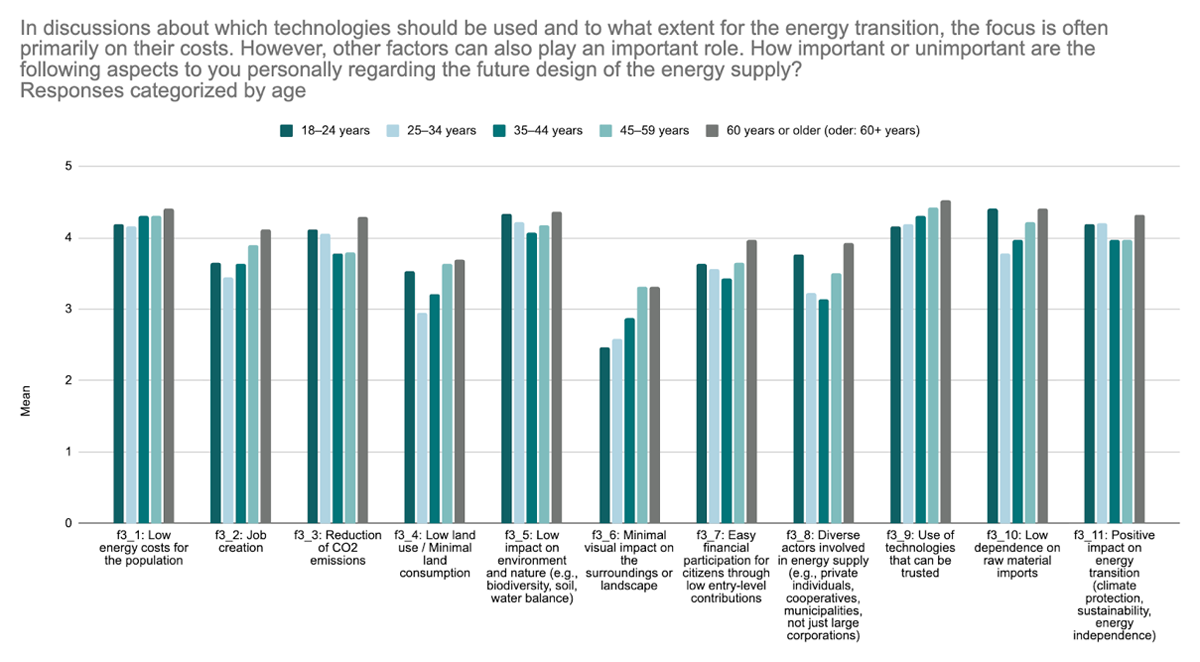
Figure 5
Results for indicator weights based on responses on importance (1–5 scale): mean by age groups (total n = 1019, n18–24 = 91, n25–34 = 153, n35–44 = 163, n45–59 = 254, n60+ = 367).
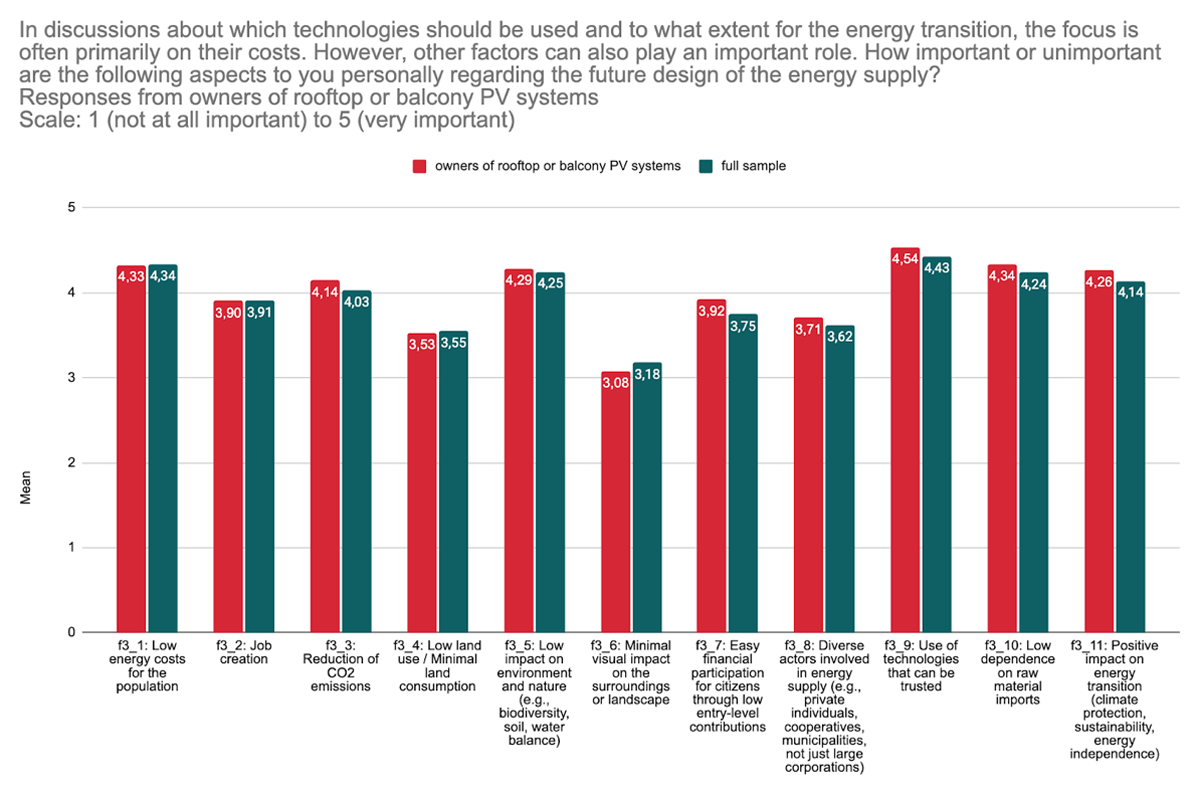
Figure 6
Results for indicator weights based on responses on importance (1–5 scale): mean for full sample and sub-sample of PV system owners (total n = 1019, nPV-owner = 306).