
Table 1
Quantification of social impacts related to energy efficiency measures in Germany in the MICATool.
| BEG | ENVIRONMENTAL BONUS | EEW | ||
|---|---|---|---|---|
| 2021–2023 | 2016–2023 | 2019–2023 | ||
| Avoided health effects linked to reduced air pollution | ||||
| Mortality | Reduction in casualties (#) | 78 | 52 | 99 |
| Hospital admissions | 58 | 39 | 74 | |
| Avoided lost working days due to air pollution | ||||
| Avoided absences | days | 27,010 | 18,892 | 35,048 |
| Reduction in disability adjusted life years | ||||
| Avoided asthma cases | years | 118 | N/A* | N/A* |
| Estimated number of people lifted out of energy poverty | ||||
| Energy expenditure half the median (M/2) | people | 214,737 | N/A* | N/A* |
| Energy expenditure twice the median (2M) | people | 297,790 | N/A* | N/A* |
| Reduction in excess cold weather mortality | ||||
| Reduction in casualties | Reduction in casualties (#) | 184 | N/A* | N/A* |
[i] Status of data and SEED MICATool 03.03.2026.
*Note: There are no values for the indicators for avoided asthma cases, energy poverty or the reduction in excess cold weather mortality for the Environmental bonus or EEW as the measures have no direct impact.
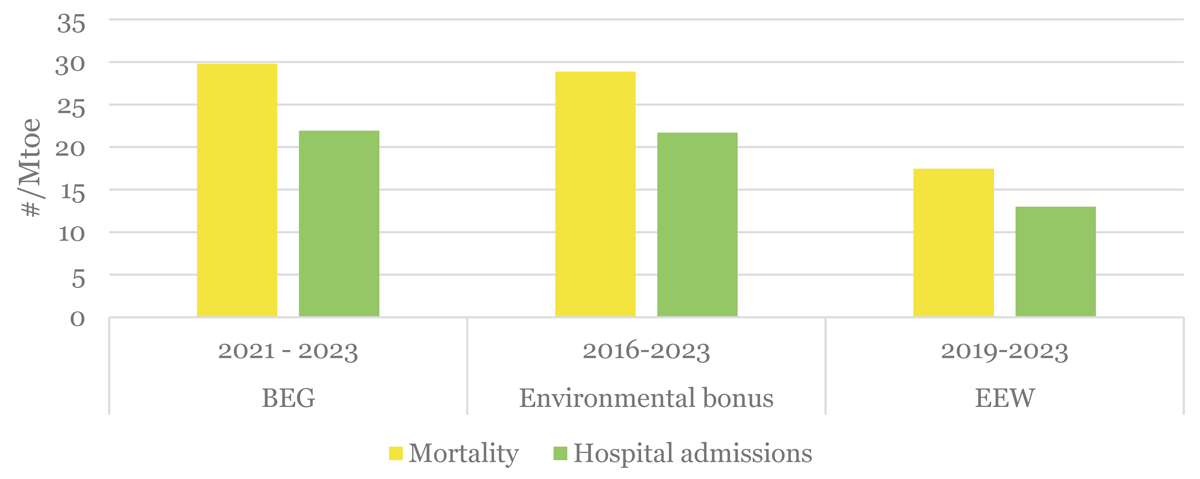
Figure 1
Specific avoided health impacts per unit of energy saved.
Table 2
Quantification of economic impacts related to energy efficiency programs evaluated in Germany in the MICATool.
| BEG | ENVIRONMENTAL BONUS | EEW | ||
|---|---|---|---|---|
| 2021–2023 | 2016–2023 | 2019–2023 | ||
| Energy impacts | ||||
| Energy intensity | Change in ktoe/Mio. € | –0.75 | –0.89 | –0.93 |
| Import dependency | % | –0.002 | 0.006 | –0.003 |
| Reduction of additional generation capacity | MW | 528 | –18,198 | 3,524 |
| Onshore wind | MW | 152 | –5,405 | 1,261 |
| Offshore wind | MW | 11 | –388 | 91 |
| Solar | MW | 365 | –12,405 | 2,173 |
| Economics and employment | ||||
| Gross Domestic Product | Added value (Mio. €) | 67,331 | 27,475 | 7,964 |
| Additional employment | Full-time employment years (years) | 1,122,018 | 410,678 | 129,431 |
[i] Status of data and SEED MICATool 03.03.2026.
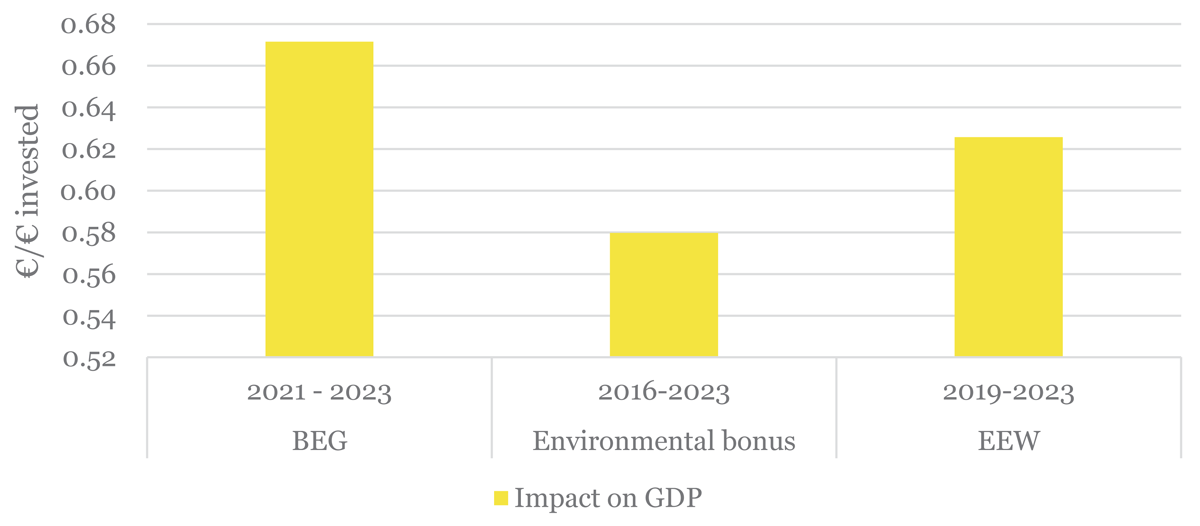
Figure 2
Specific impact on GDP per EUR invested by EE programme.
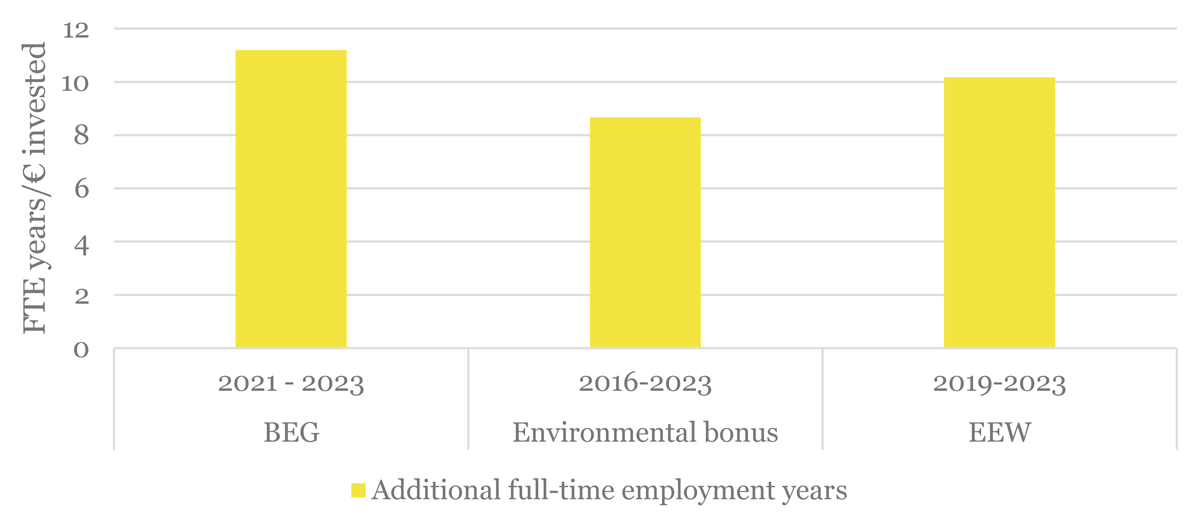
Figure 3
Specific impact on employment per million EUR invested by EE programme.
Table 3
Comparison of values in the evaluation reports with values from the MICATool.
| BEG | ENVIRONMENTAL BONUS | EEW 3A | |||
|---|---|---|---|---|---|
| 2023 | 2023 | 2023 | |||
| Energy impacts | |||||
| Gross Domestic Product | Added annual value (Mio. €) | MICATool | 22,444 | 8,058 | 2,060 |
| Reports | 22,640 | N/A | 1,200 | ||
| Additional employment | Full-time annual employment years (years) | MICATool | 374,006 | 120,438 | 33,437 |
| Reports | 359,000 | N/A | 22,500 | ||
[i] Status of data and SEED MICATool 03.03.2026 and comparison with (Heinrich et al. 2025b; Heinrich et al. 2025a; Rao et al. 2024; Neusel et al. 2024).
Table 4
Quantification of environmental impacts related to energy efficiency programs evaluated in Germany in the MICATool.
| BEG | ENVIRONMENTAL BONUS | EEW | ||
|---|---|---|---|---|
| 2021–2023 | 2016–2023 | 2019–2023 | ||
| Energy impacts | ||||
| Primary energy savings | Total ktoe | 2,623 | 1,814 | 5,687 |
| Oil | ktoe | 643 | 5,416 | 395 |
| Coal | ktoe | 74 | –1,441 | 692 |
| Gas | ktoe | 1,382 | –840 | 3,840 |
| Biomass and renewable waste | ktoe | 459 | –172 | 442 |
| Renewables | ktoe | 30 | –778 | 92 |
| Other | ktoe | 35 | –370 | 226 |
| Change in RES targets | % | 0.000 | 0.000 | 0.001 |
| Emissions | ||||
| Reduction in air pollution | kt | 7 | 26 | 15 |
| SO2 | kt | 1 | –4 | 3 |
| NOX | kt | 4 | 30 | 11 |
| PM_2_5 | kt | 1 | 0 | 0 |
| Reduction in GHG emissions (CO2) | kt | 6,455 | 8,423 | 12,974 |
[i] Status of data and SEED MICATool 03.03.2026.
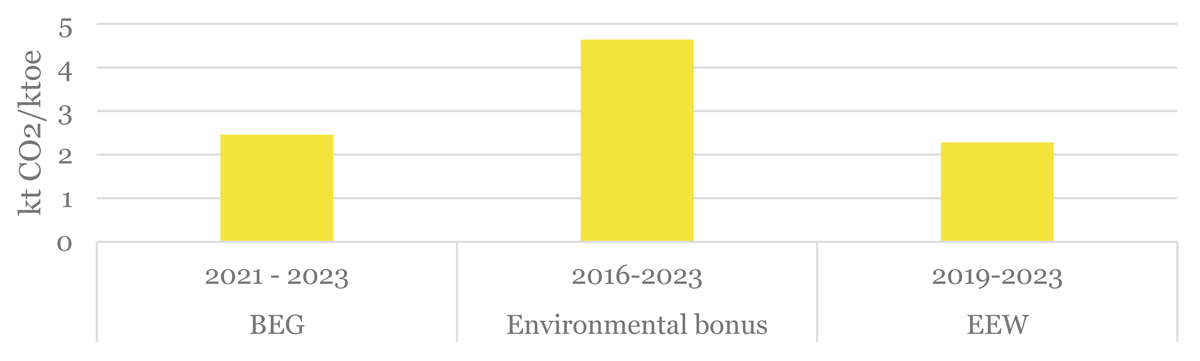
Figure 4
Specific impact on CO2 emissions per unit of primary energy saved by EE programme.
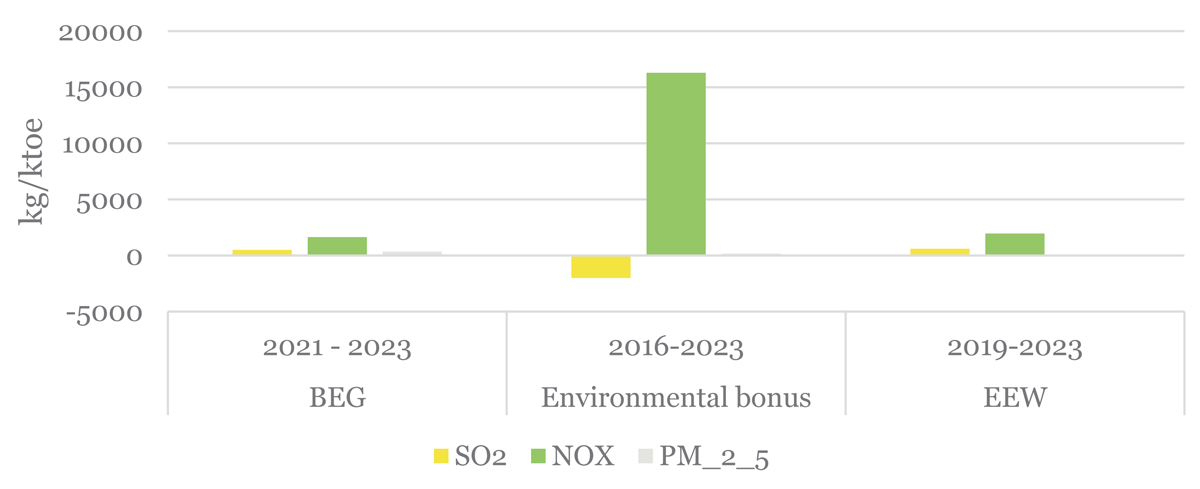
Figure 5
Specific impact on air pollution per unit of primary energy saved by EE programme.
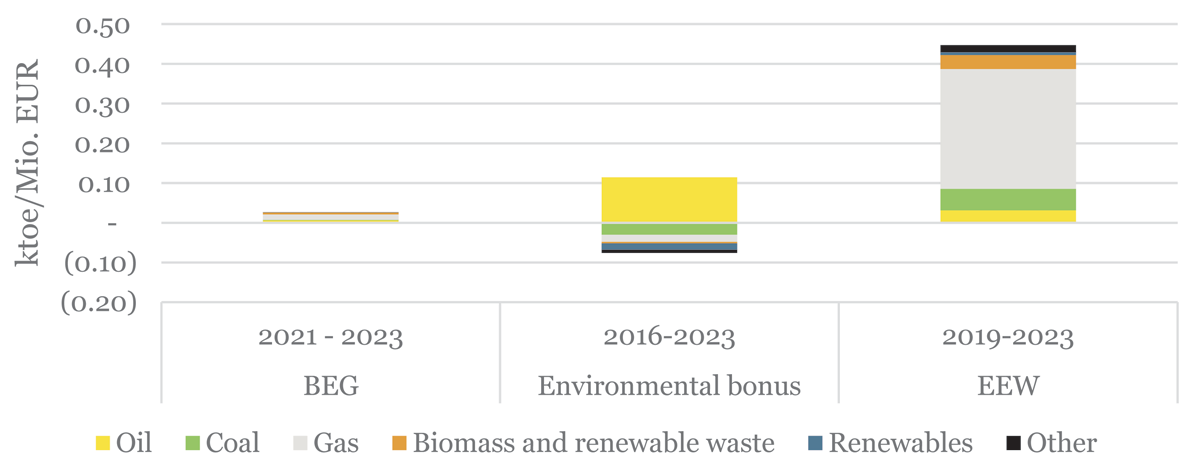
Figure 6
Specific impact on primary energy saved per million EUR invested by EE programme.
Table 5
Comparison of values in the evaluation reports with values from the MICATool.
| BEG | ENVIRONMENTAL BONUS | EEW 3a | |||
|---|---|---|---|---|---|
| 2023 | 2023 | 2023 | |||
| Energy and emission impacts | |||||
| Primary energy savings | Total ktoe | MICATool | 400 | Oil: 628 | 411 |
| Reports | 383 | Oil: 601 | 238 | ||
| Reduction in GHG emissions (CO2-eq.) | kt | MICATool | 968 | 1,471 | 857 |
| Reports | 1,511 | 1,617 | 1,262 | ||
[i] Status of data and SEED MICATool 03.03.2026 and comparison with (Heinrich et al. 2025b; Heinrich et al. 2025a; Rao et al. 2024; Neusel et al. 2024).
Table 6
Monetisation of the multiple impacts related to energy efficiency programs evaluated in Germany (2016–2023) in the MICATool.
| BEG | ENVIRONMENTAL BONUS | EEW | ||
|---|---|---|---|---|
| 2021–2023 | 2016–2023 | 2019–2023 | ||
| Reduction of energy costs | Total savings in Mio. € | 2,766 | 3,191 | 2,612 |
| Reduction of GHG emissions | Value in Mio. € | 1,197 | 1,962 | 561 |
| Health effects linked to reduced air pollution | Value in Mio. € | 205 | 208 | 198 |
| Avoided asthma cases | Value in Mio. € | 11 | N/A | N/A |
| Avoided excess cold winter mortality | Value in Mio. € | 470 | N/A | N/A |
| Avoided lost working days due to air pollution | Value in Mio. € | 3 | 4 | 7 |
| Impact on RES targets | Value in Mio. € | 58 | 39 | 120 |
| Impact on gross domestic product | Value in Mio. € | 67,331 | 27,475 | 7,964 |
| Total multiple benefits generated per million EUR invested | Mio. €/Mio. € | 0.72 | 0.69 | 0.9 |
[i] Status of data and SEED MICATool 03.03.2026.
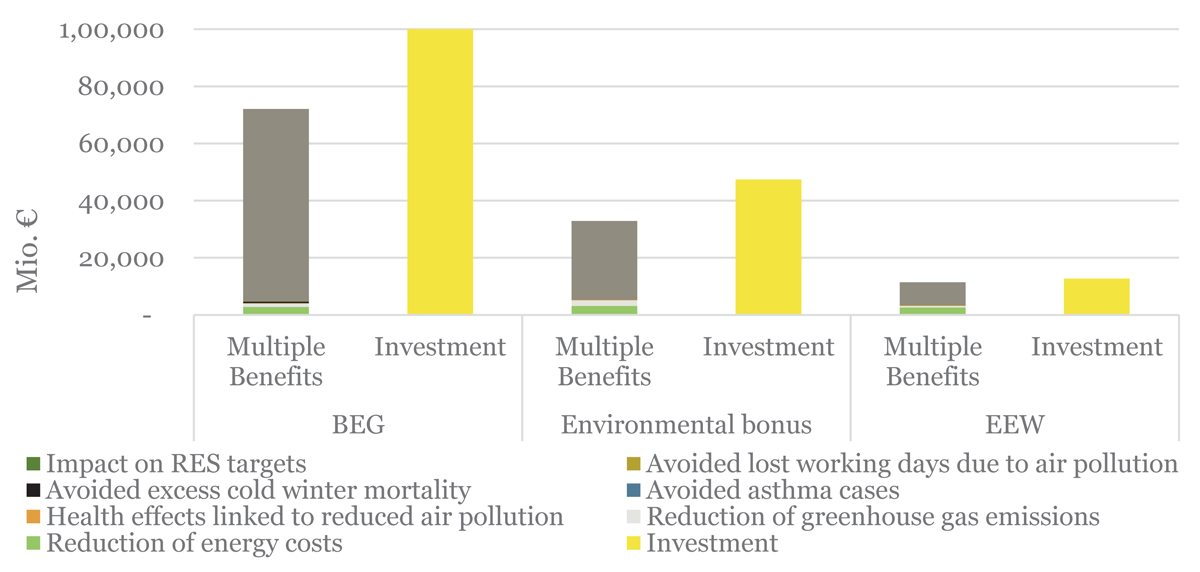
Figure 7
Monetisation of key indicators and comparison of total investment and multiple benefits by EE programme.
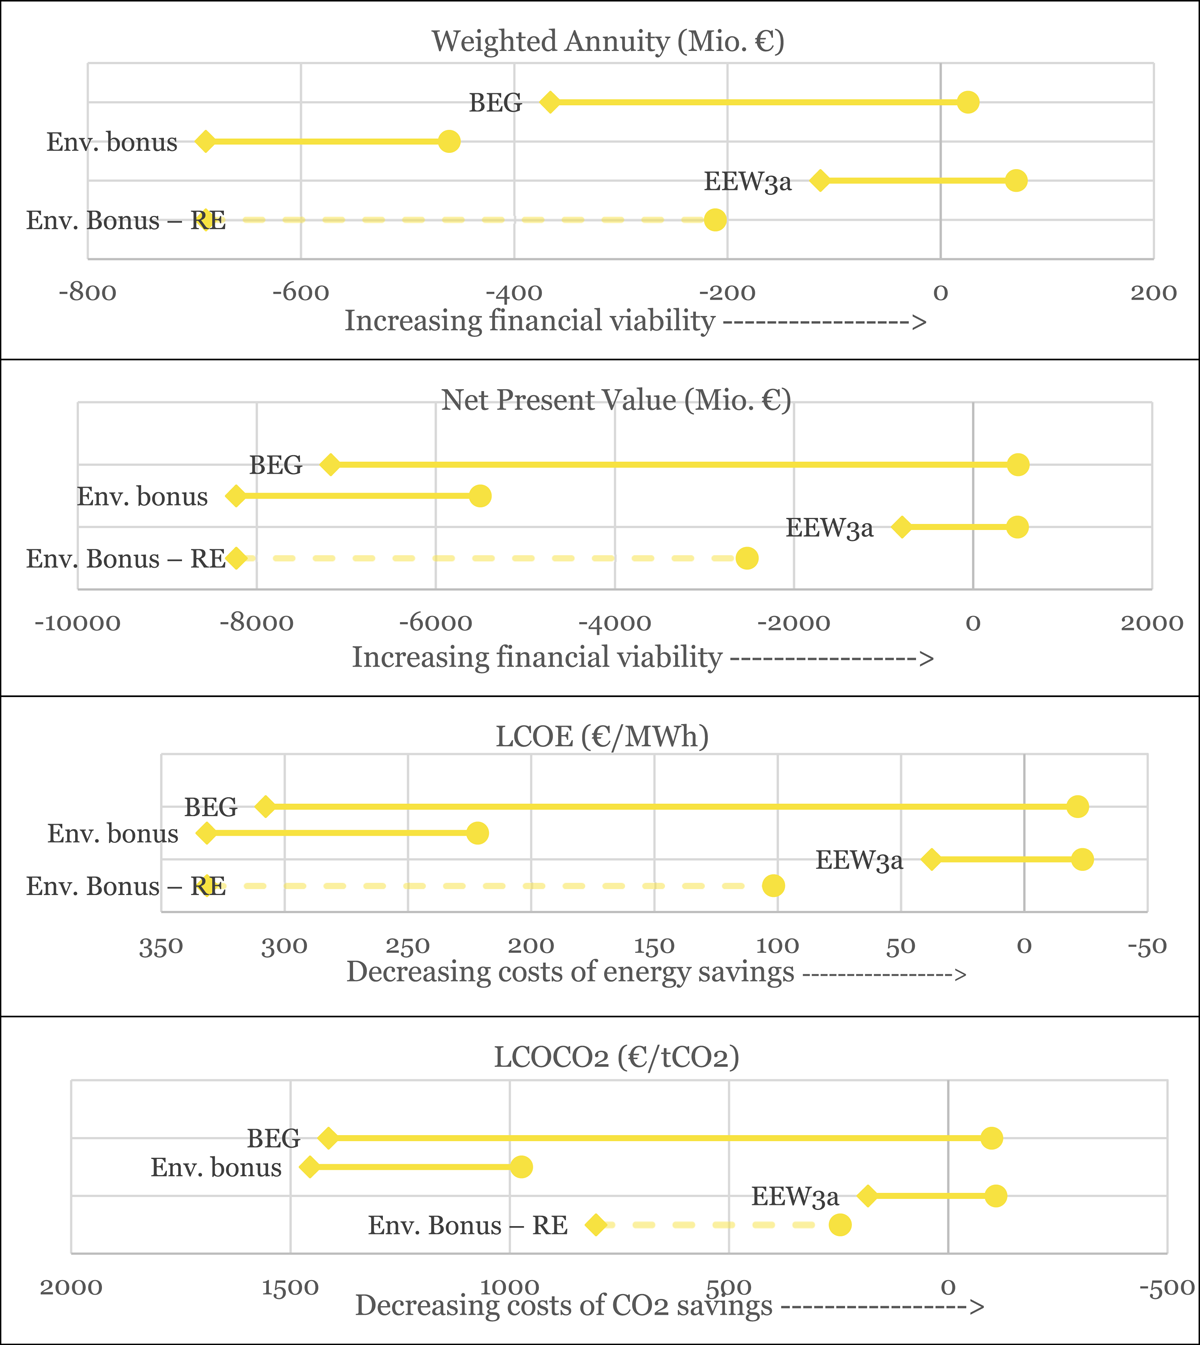
Figure 8
Comparison of cost benefit indicators for EE programmes (BEG, Environmental bonus, EEW3a, Environmental bonus—RE). The values show the difference between considering the benefit of the reduction in energy costs only (left points) with the inclusion of all MIs without the impact of GDP (right points). Status of data and SEED MICATool 03.03.2026.
Table 7
Monetisation of multiple impacts related to the installation of rooftop PV instead of implementing energy efficiency in buildings through the BEG envelope renovations (aggregated over 2021–2023).
| BEG, RENOVATIONS ONLY | ROOFTOP PV* | ||
|---|---|---|---|
| Reduction of GHG emissions | Mio. € | 260.0 | 177.2 |
| Health effects linked to reduced air pollution | Mio. € | 45.1 | 37.4 |
| Avoided asthma cases | Mio. € | 6.2 | N/A |
| Avoided excess cold winter mortality | Mio. € | 282.4 | N/A |
| Avoided lost working days due to air pollution | Mio. € | 0.7 | 0.6 |
| Impact on RES targets | Mio. € | 12.7 | 30.8 |
| Impact on gross domestic product | Mio. € | 33,528.6 | 1393.2 |
| Total multiple benefits generated | Mio. € | 34,743.03 | 1,639.24 |
| Multiple benefits generated per EUR invested | €/€ | 0.72 | 0.43 |
[i] *Not all features are yet fully available in the renewable energy module of the MICATool.