
Table 1:
Demographic data of study population
| Mean±SD or n (%) | Study group A, n=41 | Study group B, n=81 |
|---|---|---|
| Age | 58±9 | 63±14.6 |
| Gender (M) | 33 (80%) | 56 (69%) |
| Comorbidities | ||
| Solid neoplasia*/lymphoma/leukemia | 6/0/0 (14.6%) | 12/0/0 (14.8%) |
| Chronic Pulmonary Disease (CPD) | 2 (5%) | 11 (13.6%) |
| Diabetes Mellitus (DM) | 9 (22%) | 22 (27.2%) |
| History of stroke/Hemiplegia | 3(7.3%) | 14/5 (17%/6%) |
| Chronic Heart Failure (CHF) | 6 (10%) | 14 (17.3%) |
| History of myocardial infarct | 1(2.4%) | 6 (7.4%) |
| Peripheral vascular disease | 0 | 4 (5%) |
| Connective tissue disease | 0 | 1 (1.2%) |
| Peptic ulcer disease | 2(4.9%) | 8 (10%) |
| Dementia | 0 | 0 |
| Chronic Renal Disease/severe acute Renal | 3 (7.3%) | 19 (23.5%) |
| Disease (creatinine ≥ 3mg/dl) | 1 (1.2%) | |
| Chronic Liver Disease (CLD) | 41 (100%) | 0 |
| Acquired Immunodeficiency Syndrome (AIDS) | 0 | 0 |
| Charlson index** | 3±3 | 4±2 |
| Septic shock | 11 | 52 |
| MELDNa/Child-Pugh score | 28±7/11±2 | - |
| SOFA score*** | 10±3 | 9±4 |
| Type of infection | ||
| Abdominal | 16 (39%) | 42 (51%) |
| Pulmonary | 3 (7%) | 31 (38%) |
| Urinary | 11 (27%) | 0 |
| Soft tissue | 0 | 5 (6%) |
| Other | 11 (27%) | 3 (2%) |
| Isolated etiological agent | 45 | 85 |
| Gram positive-14 (31%) | Gram positive-39 (46%) | |
| Gram negative-16 (35%) | Gram negative-43 (50%) | |
| Other-15 (34%) | Other-3 (4%) | |
| Mortality at 28 days | 24 (58%) | 32 (39.5%) |
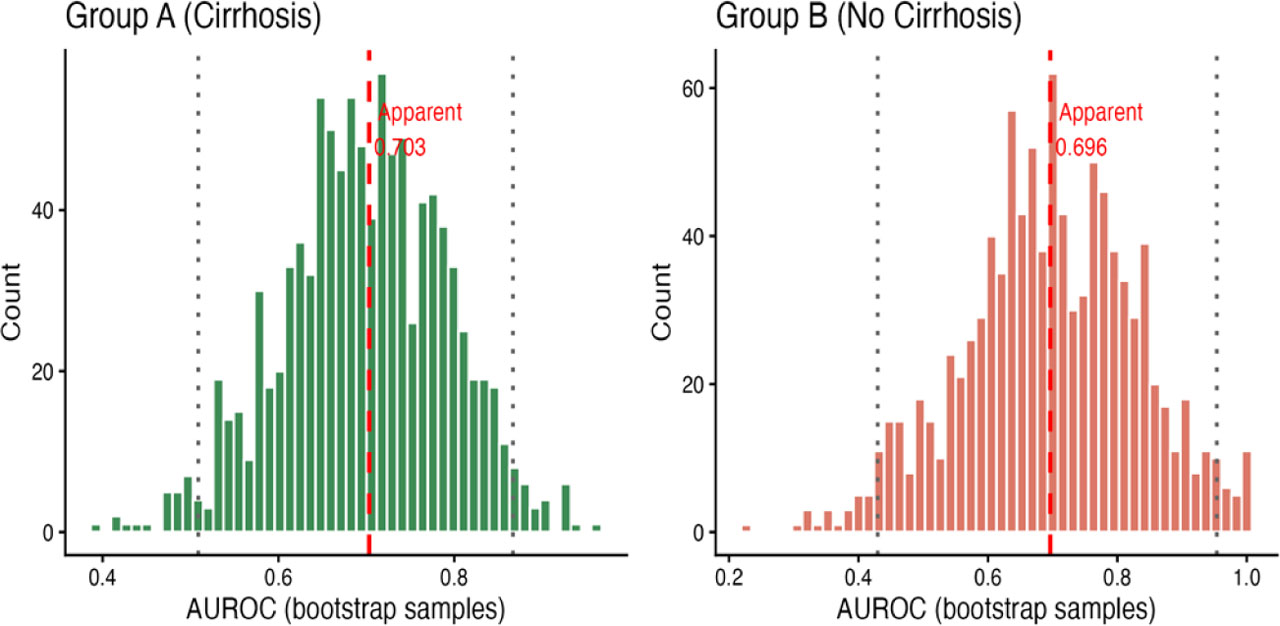
Fig. 1.
Bootstrap sampling distribution of AUROC (B=1,000 Iteration): group A and B.
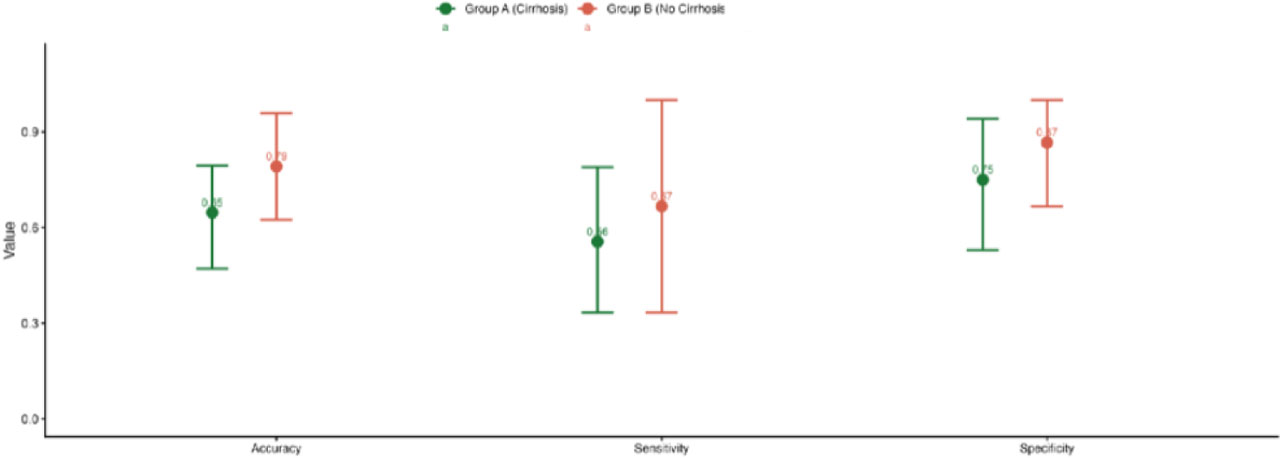
Fig. 2.
Diagnostic performance of the Δ500 pg/mL threshold for 28-day mortality with 95% bootstrap Confidence Intervals.
Table 2.
Prognostic performances of the tested infection markers
| AUROC (95%CI) | Se | Sp | Best cut-off level* | Accuracy | P value(AUROC) | |
|---|---|---|---|---|---|---|
| Study group A | ||||||
| CRP (mg/dl) | 0.67 (0.50–0.84) | 0.87 | 0.53 | 3.53 | 76% | 0.05 |
| PCT(ng/ml) | 0.73 (0.57–0.80) | 0.82 | 0.58 | 0.44 | 70% | 0.01 |
| Presepsin_baseline (pg/ml) | 0.78(0.63–0.92) | 0.87 | 0.65 | 1303 | 79% | 0.002 |
| Presepsin48h (pg/ml) | 0.91 (0.79–1.00) | 0.87 | 0.90 | 1644 | 87% | <0.0001 |
| Study group B | ||||||
| CRP(mg/dl) | 0.55 (0.42–0.68) | 0.41 | ||||
| PCT(ng/ml) | 0.52 (0.39–0.65) | 0.68 | ||||
| Presepsin baseline (pg/ml) | 0.71 (0.60–0.83) | 0.62 | 0.73 | 1235 | 69% | 0.001 |
| Presepsin48h (pg/ml) | 0.72 (0.52–0.84) | 0.61 | 0.77 | 1050 | 72% | 0.002 |
Table 3:
Multivariate analysis models were constructed for Study Group A, consisting of four models, each including three variables identified as being associated with survival in univariate analysis. This approach was chosen to minimize collinearity between variables and to account for the relatively limited number of patients with events.
| First model | P value | HR | 95%CI |
|---|---|---|---|
| Presepsin baseline* | 0.42 | 1.00 | 1.00–1.00 |
| MELDNa* | 0.37 | 1.04 | 0.94–1.15 |
| CLIF-SOFA score | <0.001 | 1.35 | 1.13–1.61 |
| Second model | |||
| Presepsin 48 hours | 0.005 | 1 | 1.00–1.00 |
| MELDNa* | 0.50 | 1.04 | 0.92–1.17 |
| CLIF-SOFA score* | 0.67 | 1.08 | 0.75–1.55 |
| Third model | |||
| ∆500 | 0.005 | 5.01 | 1.64–15.26 |
| MELDNa* | 0.87 | 0.99 | 0.88–1.10 |
| CLIF-SOFA score* | 0.18 | 1.26 | 0.89–1.78 |
| Forth model | |||
| ∆neg | 0.001 | 0.11 | 0.02–0.40 |
| CLIF-SOFA score | 0.04 | 1.45 | 1.01–2.08 |
| MELDNa* | 0.25 | 0.93 | 0.83–1.04 |
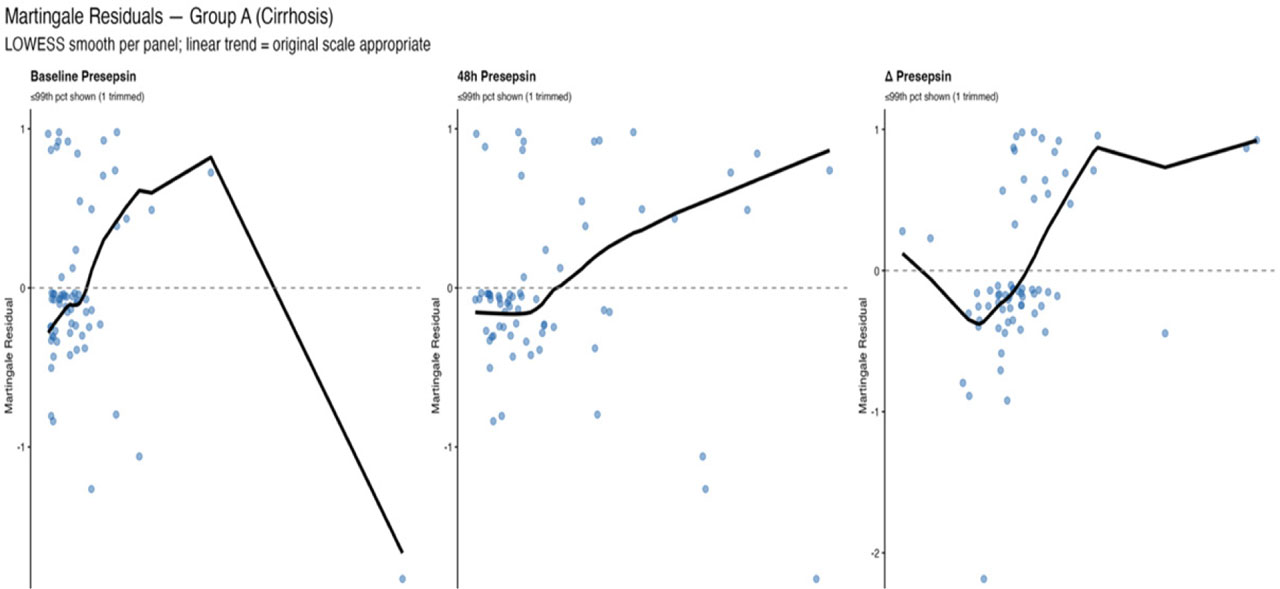
Fig. 3.
Martingale plots in group A for baseline presepsin, 48h presepsin and Δ presepsin
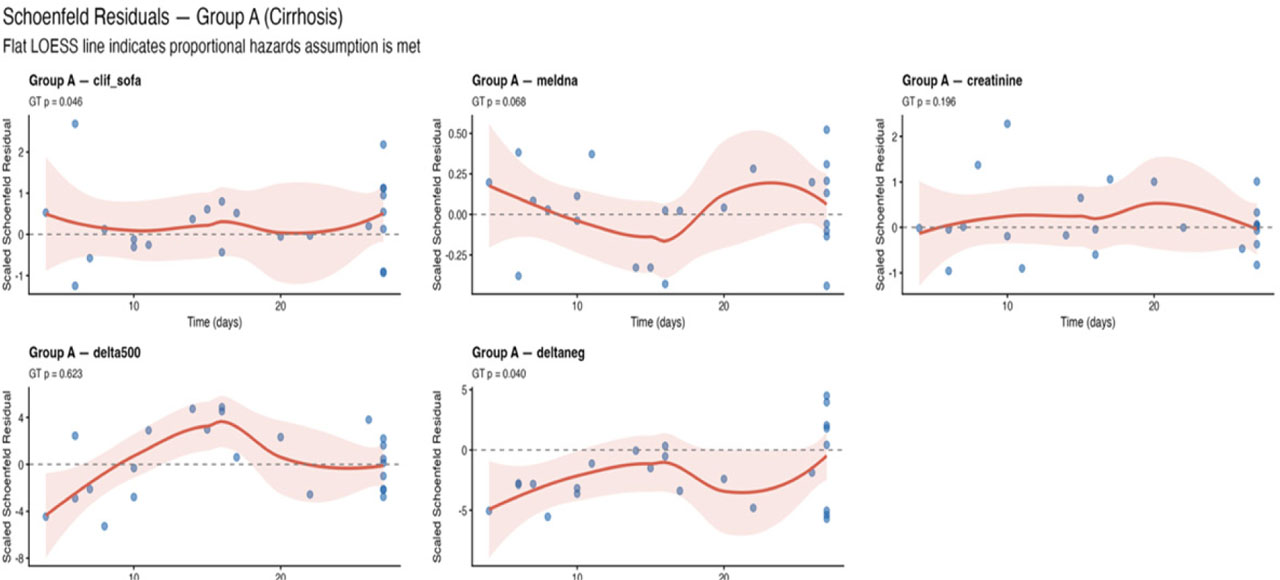
Fig. 4.
Schoenfeld plots in group A for CLIF-SOFA, MELD-Na, creatinine, Δ presepsin and Δ neg
Table 4:
Mean values of CRP, PCT, presepsin (baseline and at 48 hours) and WBC in survivors vs non-survivors in study group A and B
| Variable* | Study group A | Study group B | ||||
|---|---|---|---|---|---|---|
| survivors (n=17) | non-survivors (n=24) | p | survivors (n=49) | non-survivors (n=32) | p | |
| Presepsin-baseline (pg/ml)* | 1358±922 | 3596±4445 | 0.07 | 1131.90±1050.8 | 2763±2658 | <0.0001 |
| Presepsin-48h * (pg/ml) | 1295.63±1281.42 | 4385.81±4525.38 | 0.008 | 930.70±1149.10 | 2415±2508 | <0.0001 |
| ∆ Presepsin (median) | −190±337 | 1088±2378 | 0.1 | −201±962 | −324±1927 | 0.7 |
| CRP (mg/dl) * | 4.60±4.02 | 8.40± 5.94 | 0.03 | 27.70±35.30 | 25.80±11.06 | 0.6 |
| Procalcitonin * (ng/ml) | 1.77± 3.50 | 3.49±4.25 | 0.2 | 28.40±66.10 | 27.10±55.20 | 0.9 |
| WBC (×103/ml) * | 11.99±7.55 | 13.51±7.16 | 0.5 | 14.99±9.27 | 17.45±10.08 | 0.2 |
Table 5:
Models for multivariate analysis Study group B
| First model | P value | HR | 95%CI |
|---|---|---|---|
| Presepsin baseline | 0.005 | 1.00 | 1.00–1.00 |
| Charlson index | <0.0001 | 1.34 | 1.15–1.57 |
| SOFA score* | 0.11 | 1.10 | 0.97–1.25 |
| Second model | |||
| Presepsin 48 hours | 0.002 | 1.00 | 1.00–1.00 |
| Charlson index | 0.009 | 1.30 | 1.10–1.54 |
| SOFA score* | 0.17 | 1.09 | 0.96–1.24 |
| Third model | |||
| ∆ 500 | 0.01 | 2.69 | 1.06–6.81 |
| Charlson index | 0.001 | 1.33 | 1.12–1.59 |
| SOFA score | 0.03 | 1.13 | 1.00–1.30 |
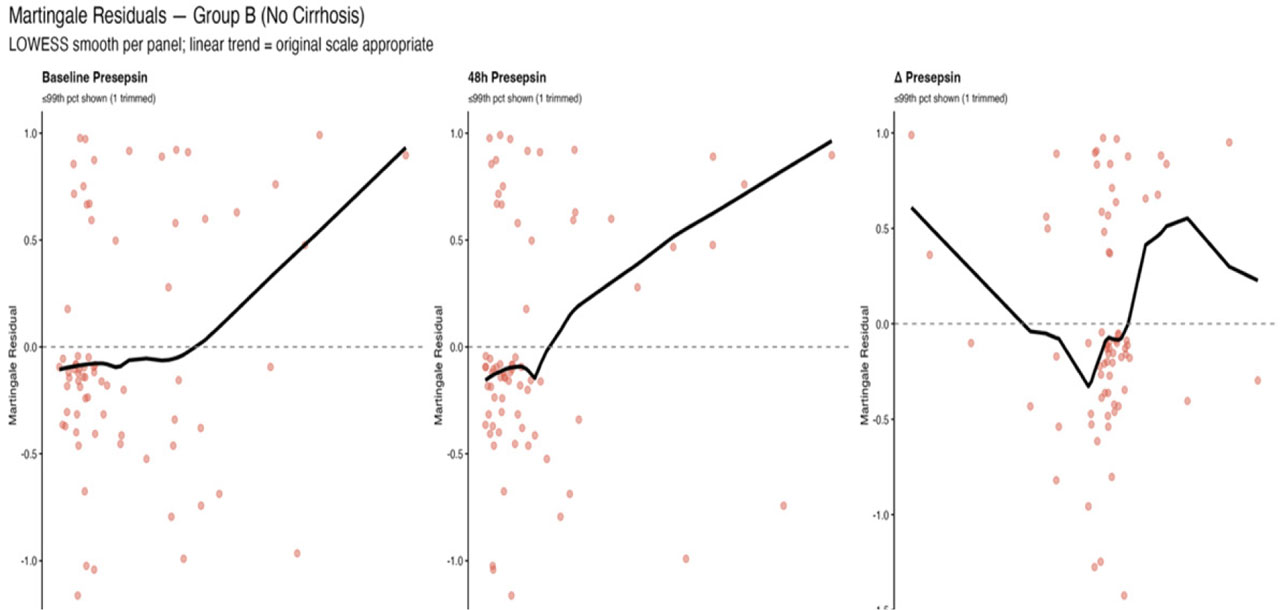
Fig. 5.
Martingale plots in group B for baseline presepsin, 48h presepsin and Δ presepsin
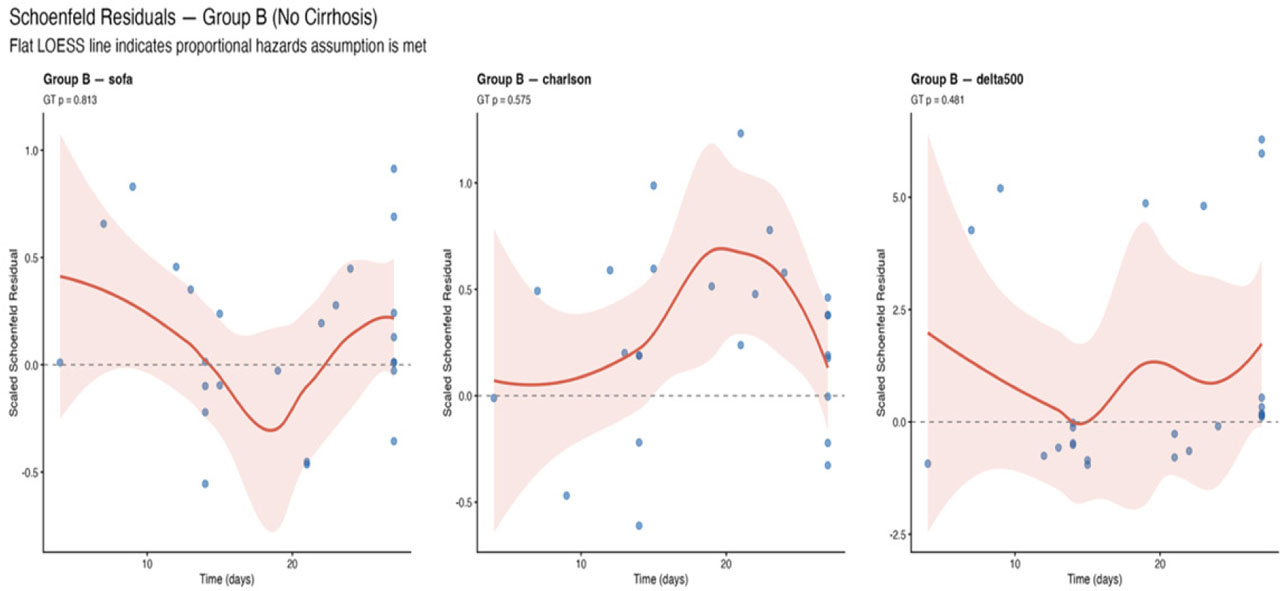
Fig. 6.
Schoenfeld plots in group B for SOFA score, Charlson and Δ presepsin.
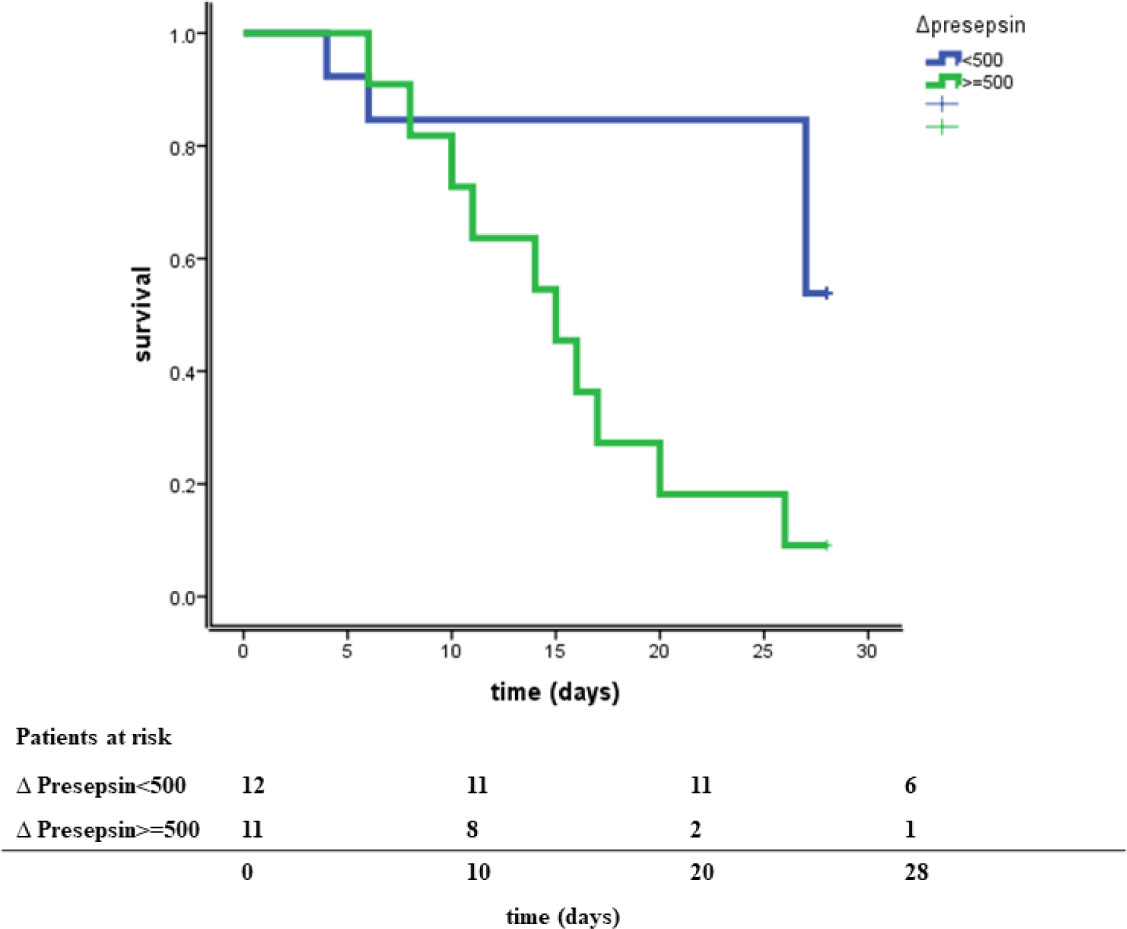
Fig. 7.
Kaplan Maier curve for study group A. Curves were compared using a Log-rank test
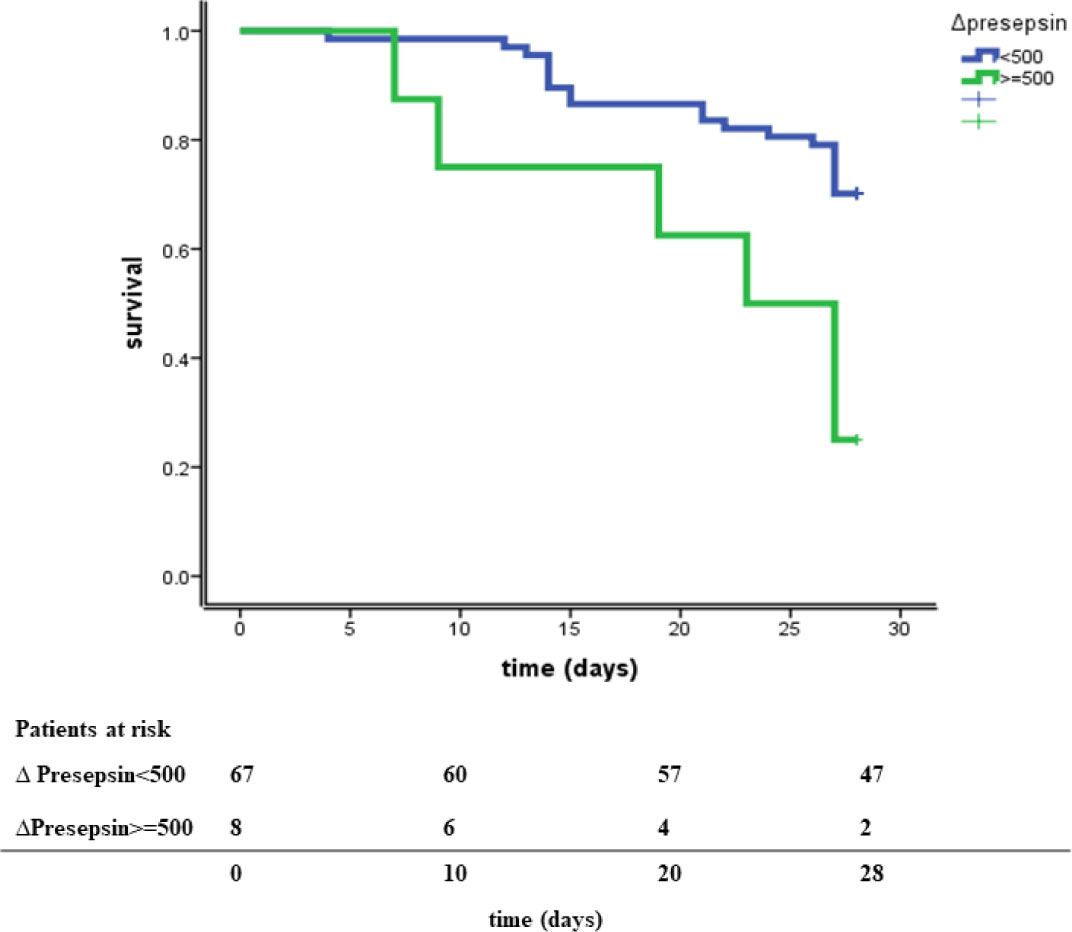
Fig. 8.
Kaplan Maier curve for study group B. Curves were compared using a Log-rank test