
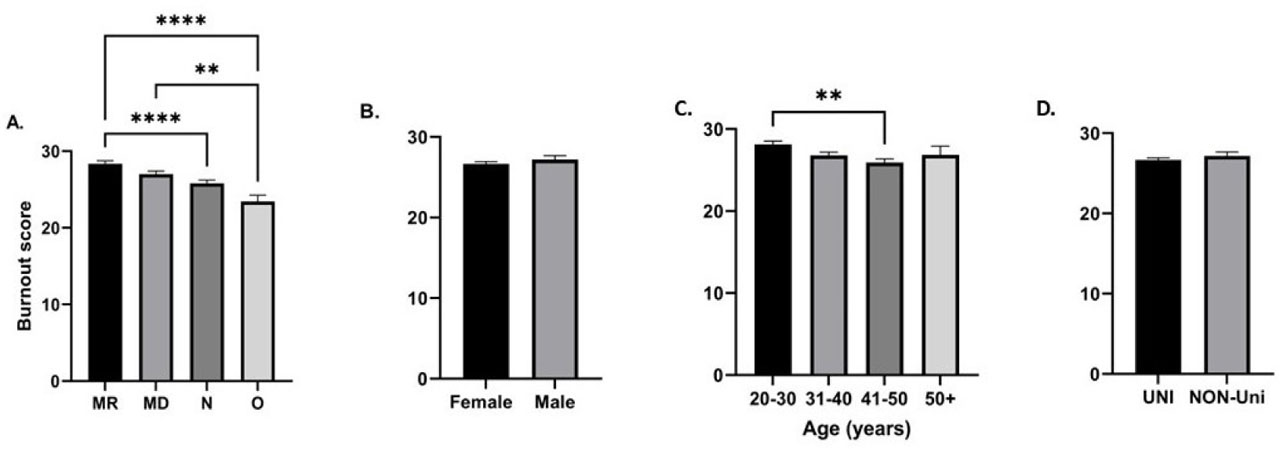
Fig.1
Differences in burnout score with regard to the category of the health care provider (A), gender (B), age (C), and the hospital status (D). The date is illustrated as means±SEM. ** represents a p value between 0.001–0.01, **** represents a p value less than 0.0001.
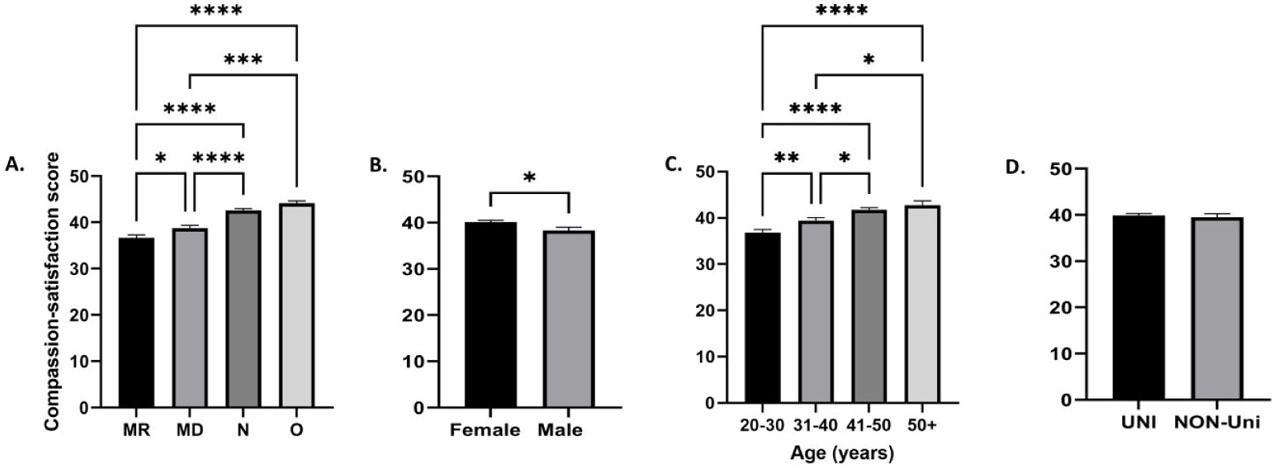
Fig.2
Differences in compassion-satisfaction score with regard to the category of the health care provider (A), gender (B), age (C), and the hospital status (D). The date is illustrated as means±SEM. * represents a p value between 0.05–0.01, ** represents a p value between 0.001–0.01, *** represents a p value between 0.0001–0.001, and **** represents a p value less than 0.0001.
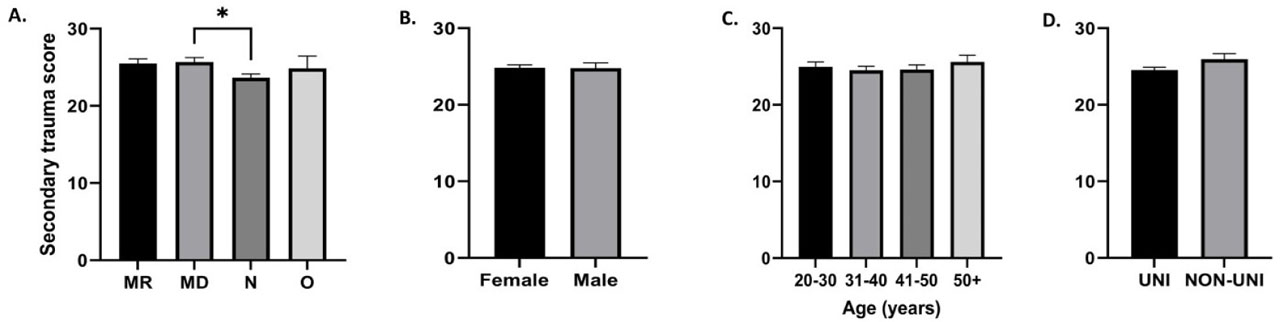
Fig.3
Differences in the secondary trauma score with regard to the category of the health care provider (A), gender (B), age (C), and the hospital status (D). The date is illustrated as means±SEM. * represents a p value between 0.05–0.01.
Table 1.
Differences in perception of various items included in the Safety Attitudes Questionnaire (SAQ) among medical staff categories.
| Medical residents (MR) (mean+/− SEM) | Nurses (N) (mean+/− SEM) | Medical doctors (MD) (mean+/− SEM) | Others (O) (mean+/−SEM) | ANOVA results (p value) | |
|---|---|---|---|---|---|
| Enough staff for patients | 2.63+/−0.11 | 2.22+/−0.12 | 2.8+/−0.12 | 2.85+/−0.32 | p=0.005 |
| Adequate equipment | 3.423+/−0.11 | 4.078+/−0.10 | 3.875+/−0.10 | 4.714+/−0.22 | p˂0.0001 |
| Conflicts resolved for patients’ good | 3.479+/−0.11 | 3.93+/−0.09 | 3.81+/−0.11 | 4.42+/−0.20 | P=0.001 |
| Good teamwork | 3.845+/−0.10 | 3.967+/−0.10 | 4.278+/−0.07 | 4.429+/−0.20 | P=0.007 |
| Safe environment | 4.014+/−0.10 | 4.156+/−0.11 | 4.125+/−0.08 | 4.571+/−0.20 | P=0.24 |
| Staff often ignore rules | 2.042+/−0.07 | 1.989+/−0.09 | 2.194+/−0.09 | 1.500+/−0.25 | P=0.03 |
| Ineffectiveness when tired | 3.930+/−0.10 | 2.600+/−0.09 | 3.431+/−0.11 | 2.500+/−0.32 | P˂0.0001 |
| Excessive workload hurts performance | 3.930±0.10 | 2.789±0.12 | 3.472±0.11 | 2.571±0.35 | p˂0.0001 |
| I like my job | 3.845±0.09 | 4.311±0.10 | 4.083±0.09 | 4.571±0.29 | P=0.02 |
| Good workplace | 3.648±0.10 | 4.244±0.10 | 4.069±0.08 | 4.714±0.12 | p˂0.001 |
Table 2.
Correlations in the perception of various items included in the Safety Attitudes Questionnaire (SAQ) and burnout, compassion-satisfaction, and secondary trauma scores respectively. r represents the correlation coefficient.
| CO (r, p) | BO (r, p) | ST (r, p) | |
|---|---|---|---|
| Enough staff for patients | −0.02917 (0.64) | −0.1472 (0.02) | −0.05600 (0.38) |
| Adequate equipment | 0.2646 (˂0.0001) | −0.3718 (˂0.0001) | −0.1284 (0.04) |
| Conflicts resolved for patients’ good | 0.3217 (˂0.0001) | −0.4247 (˂0.0001) | −0.2443 (0.0001) |
| Good teamwork | 0.2587 (˂0.0001) | −0.3836 (˂0.0001) | −0.1233 (0.052) |
| Safe environment | 0.3270 (˂0.0001) | −0.4777 (˂0.0001) | −0.2098 (0.0009) |
| Staff often ignore rules | −0.3231 (˂0.0001) | 0.3865 (˂0.0001) | 0.2364 (0.0002) |
| Ineffectiveness when tired | −0.4704 (˂0.0001) | 0.5727 (˂0.0001) | 0.3846 (˂0.0001) |
| Excessive workload hurts performance | −0.4124 (˂0.0001) | 0.5186 (˂0.0001) | 0.4175 (˂0.0001) |
| I like my job | 0.5350 (˂0.0001) | −0.4577 (˂0.0001) | −0.2565 (˂0.0001) |
| Good workplace | 0.5128 (˂0.0001) | −0.5888 (˂0.0001) | −0.2492 (˂0.0001) |