
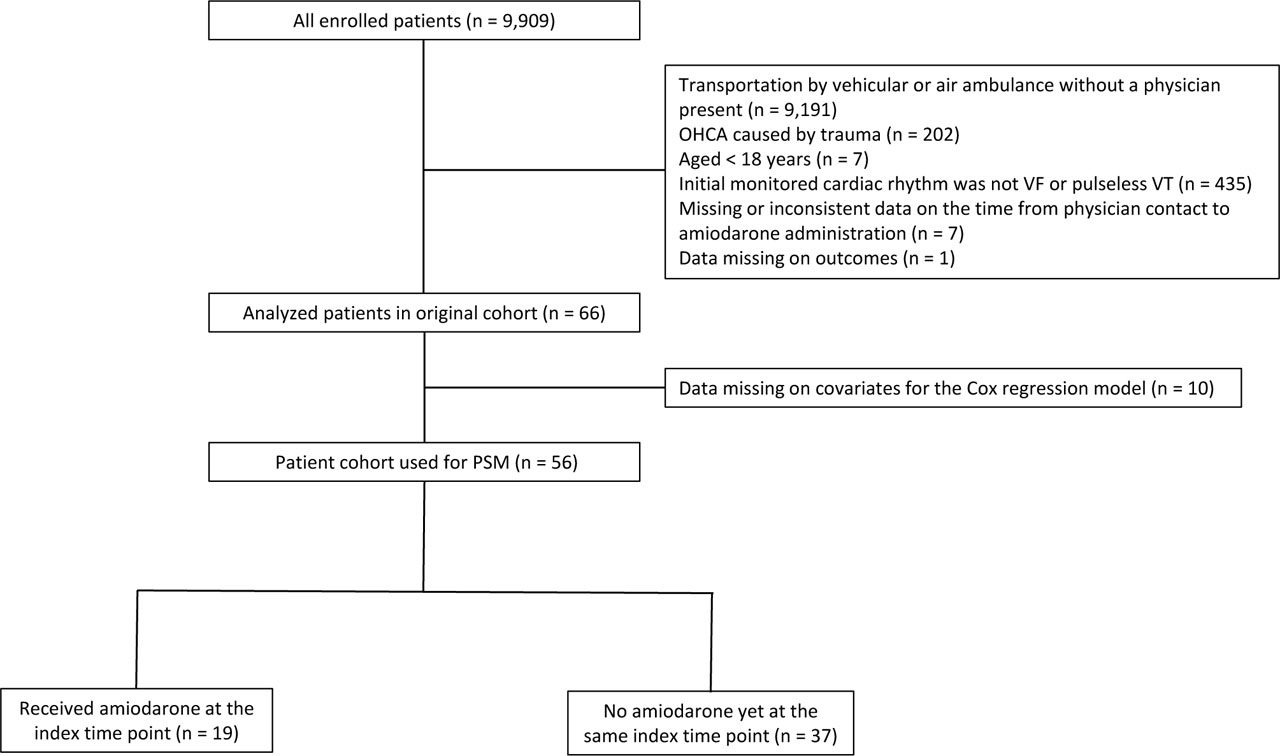
Fig. 1
Flowchart of the screening and enrolment process within the current study. Exposure was amiodarone administration at each index time point; controls were patients who had not yet received amiodarone at that same index time point (and could receive it later).
Table 1.
Characteristics of adults with OHCA with and without amiodarone in original cohort
| Overall (n = 66) | No amiodarone (n = 45) | Amiodarone (n = 21) | SD | |
|---|---|---|---|---|
| Age, median (IQR) | 65 (52–76) | 69 (52–77) | 63 (53–71) | 0.19 |
| Male, n (%) | 54 (81.8) | 40 (88.9) | 14 (66.7) | 0.55 |
| Clinical frailty scalea, n (%) | −0.06 | |||
| Very fit | 3 (5.0) | 2 (5.0) | 1 (5.0) | |
| Well | 9 (15.0) | 7 (17.5) | 2 (10.0) | |
| Managing well | 29 (48.3) | 19 (47.5) | 10 (50.0) | |
| Vulnerable | 10 (16.7) | 6 (15.0) | 4 (20.0) | |
| Mildly frail | 4 (6.7) | 2 (5.0) | 2 (10.0) | |
| Moderately frail | 2 (3.3) | 2 (5.0) | 0 (0) | |
| Severely frail | 3 (5.0) | 2 (5.0) | 1 (5.0) | |
| Very severely frail | 0 (0) | 0 (0) | 0 (0) | |
| Terminally ill | 0 (0) | 0 (0) | 0 (0) | |
| Charlson comorbidity indexb, median (IQR) | 0 (0–1) | 0 (0–1) | 0 (0–1) | 0.38 |
| Time of emergency call, n (%) | 0.42 | |||
| 7:00–14:59 | 32 (48.5) | 21 (46.7) | 11 (52.4) | |
| 15:00–22:59 | 25 (37.9) | 16 (35.6) | 9 (42.9) | |
| 23:00–6:59 | 9 (13.6) | 8 (17.8) | 1 (4.8) | |
| Witness status, n (%) | 0.25 | |||
| None | 8 (12.1) | 6 (13.3) | 2 (9.5) | |
| EMS personnel | 1 (1.5) | 1 (2.2) | 0 (0) | |
| Others | 57 (86.4) | 38 (84.4) | 19 (90.5) | |
| Bystander CPR, n (%) | 0.47 | |||
| Presence | 43 (65.2) | 29 (64.4) | 14 (66.7) | |
| Absence | 23 (34.8) | 16 (35.6) | 7 (33.3) | |
| Initial monitored cardiac rhythm, n (%) | 0.38 | |||
| VF | 63 (95.5) | 42 (93.3) | 21 (100) | |
| Pulseless VT | 3 (4.5) | 3 (6.7) | 0 (0) | |
| Cause of cardiac arrest, n (%) | 0.16 | |||
| Cardiogenic | 61 (92.4) | 41 (91.1) | 20 (95.2) | |
| Other intrinsic disease | 5 (7.6) | 4 (8.9) | 1 (4.8) | |
| Time from scene to initiation of CPRc, min, median (IQR) | 11 (9–13) | 11 (10–14) | 10 (9–12) | 0.17 |
| Adrenaline administration by EMS before physician contactd, n (%) | 34 (68.0) | 21 (70.0) | 13 (65.0) | 0.31 |
| AAM by EMS before physician contact, n (%) | 39 (59.0) | 25 (55.5) | 14 (66.6) | 0.39 |
| Type of AAM by EMS, n (%) | 0.39 | |||
| Supraglottic airway device | 36 (54.5) | 24 (53.3) | 12 (57.1) | |
| Endotracheal tube | 3 (4.5) | 1 (2.2) | 2 (9.5) | |
| Shock delivery by EMS before physician contact, n (%) | 60 (90.9) | 41 (91.1) | 19 (90.5) | 0.16 |
| Adrenaline administration before amiodarone administration, n (%) | 24 (36.4) | 16 (35.6) | 8 (38.1) | 0.05 |
| Time from physician contact to adrenaline administration before amiodarone administratione, min, median (IQR) | 3 (1.8–4.3) | 3.5 (1.8–5.3) | 2.5 (1.8–3) | 0.39 |
| AAM before amiodarone administration, n (%) | 24 (36.4) | 16 (35.6) | 8 (38.1) | 0.05 |
| Time from physician contact to AAM before amiodarone administrationf, min, median (IQR) | 3 (3–5) | 4.5 (3–5) | 3 (2.8–3) | 0.84 |
| Time from scene to amiodarone administration, min, median (IQR) | 27 (22–32) | - | 27 (22–32) | - |
| Time from physician contact to amiodarone administration, min, median (IQR) | 4 (2–7) | - | 4 (2–7) | - |
| Time from physician contact to hospital arrival, min, median (IQR) | 13 (9–16) | 14 (8–16) | 11 (10–15) | −0.18 |
| Time from scene to ROSCg, min, median (IQR) | 27 (21–38) | 26 (21–37) | 28 (23–49) | −0.34 |
Abbreviations: AAM, advanced airway management; CPR, cardiopulmonary resuscitation; IQR, interquartile range; EMS, emergency medicine service; OHCA, out-of-hospital cardiac arrest; ROSC, return of spontaneous circulation; SD, standardized difference; VF, ventricular fibrillation; VT, ventricular tachycardia.
Table 2.
Outcomes in original cohort
| Overall (n = 66) | No amiodarone (n = 45) | Amiodarone (n = 21) | SD | |
|---|---|---|---|---|
| 30-day neurological outcome | ||||
| CPC 1 | 10 (15.2) | 9 (20.0) | 1 (4.8) | 0.67 |
| CPC 2 | 5 (7.6) | 3 (6.7) | 2 (9.5) | |
| CPC 3 | 3 (4.5) | 1 (2.2) | 2 (9.5) | |
| CPC 4 | 7 (10.6) | 6 (13.3) | 1 (4.8) | |
| CPC 5 | 41 (62.1) | 26 (57.8) | 15 (71.4) | |
| 30-day favorable neurological outcome | 15 (22.7) | 12 (26.7) | 3 (14.3) | 0.31 |
| 30-day survival | 25 (37.9) | 19 (42.2) | 6 (28.6) | 0.29 |
Table 3.
Characteristics of adults with OHCA with and without amiodarone after time-dependent propensity score matching
| Overall (n = 76) | No amiodarone yet at the same index time point (n = 57) | Received amiodarone at the index time point (n = 19) | SD | |
|---|---|---|---|---|
| Age, median (IQR) | 63 (52–76) | 59 (52–80) | 65 (57–73) | −0.01 |
| Male, n (%) | 53 (69.7) | 41 (71.9) | 12 (63.2) | 0.19 |
| Clinical frailty scalea, n (%) | −0.13 | |||
| Very fit | 2 (2.8) | 1 (1.9) | 1 (5.6) | |
| Well | 16 (22.5) | 15 (28.3) | 1 (5.6) | |
| Managing well | 30 (42.3) | 21 (39.6) | 9 (50.0) | |
| Vulnerable | 14 (19.7) | 10 (18.9) | 4 (22.2) | |
| Mildly frail | 2 (2.8) | 0 (0) | 2 (11.1) | |
| Moderately frail | 7 (9.9) | 6 (11.3) | 1 (5.6) | |
| Severely frail | 2 (2.8) | 1 (1.9) | 1 (5.6) | |
| Very severely frail | 0 (0) | 0 (0) | 0 (0) | |
| Terminally ill | 0 (0) | 0 (0) | 0 (0) | |
| Charlson comorbidity index, median (IQR) | 0 (0–1) | 0 (0–0) | 0 (0–1) | 0.05 |
| Time of emergency call, n (%) | 0.10 | |||
| 7:00–14:59 | 39 (51.3) | 29 (50.9) | 10 (52.6) | |
| 15:00–22:59 | 34 (44.7) | 26 (45.6) | 8 (42.1) | |
| 23:00–6:59 | 3 (3.9) | 2 (3.5) | 1 (5.3) | |
| Witness status, n (%) | 0 | |||
| None | 0 (0) | 0 (0) | 0 (0) | |
| EMS personnel | 0 (0) | 0 (0) | 0 (0) | |
| Others | 76 (100) | 57 (100) | 19 (100) | |
| Bystander CPR, n (%) | 0.16 | |||
| Presence | 56 (73.7) | 43 (75.4) | 13 (68.4) | |
| Absence | 20 (26.3) | 14 (24.6) | 6 (31.6) | |
| Initial monitored cardiac rhythm, n (%) | 0 | |||
| VF | 76 (100) | 57 (100) | 19 (100) | |
| Pulseless VT | 0 (0) | 0 (0) | 0 (0) | |
| Cause of cardiac arrest, n (%) | 0.09 | |||
| Cardiogenic | 73 (96.1) | 55 (96.5) | 18 (94.7) | |
| Other intrinsic disease | 3 (3.9) | 2 (3.5) | 1 (5.3) | |
| Time from scene to initiation of CPR, min, median (IQR) | 11 (10–12) | 11 (10–13) | 10 (9–12) | 0.10 |
| Adrenaline administration by EMS before physician contactb, n (%) | 44 (74.6) | 32 (78.0) | 12 (66.7) | 0.26 |
| AAM by EMS before physician contact, n (%) | 49 (64.5) | 36 (63.1) | 13 (68.5) | 0.22 |
| Type of AAM by EMS, n (%) | 0.22 | |||
| Supraglottic airway device | 44 (57.9) | 32 (56.1) | 12 (63.2) | |
| Endotracheal tube | 5 (6.6) | 4 (7.0) | 1 (5.3) | |
| Shock delivery by EMS before physician contact, n (%) | 71 (93.4) | 54 (94.7) | 17 (89.5) | 0.33 |
| Adrenaline administration before amiodarone administration, n (%) | 21 (27.6) | 14 (24.6) | 7 (36.8) | 0.27 |
| Time from physician contact to adrenaline administration before amiodarone administrationc, min, median (IQR)* | 3 (2–3) | 3 (2.3–3) | 2 (1.5–3) | 0.67 |
| AAM before amiodarone administration, n (%) | 21 (27.6) | 14 (24.6) | 7 (36.8) | 0.27 |
| Time from physician contact to AAM before amiodarone administrationd, min, median (IQR)* | 3 (2–3) | 3 (2.3–3.8) | 3 (2.5–3) | 0.24 |
| Time from physician contact to hospital arrival, min, median (IQR) | 14 (11–17) | 14 (11–17) | 11 (10–15) | 0.28 |
| Time from scene to ROSCe, min, median (IQR) | 25 (17–35) | 25 (17–28) | 28 (23–49) | −0.51 |
Abbreviations: AAM, advanced airway management; CPR, cardiopulmonary resuscitation; IQR, interquartile range; EMS, emergency medicine service; OHCA, out-of-hospital cardiac arrest; ROSC, return of spontaneous circulation; SD, standardized difference; VF, ventricular fibrillation; VT, ventricular tachycardia.
Table 4.
Outcomes in time-dependent propensity score matched cohort
| Outcomes | Number of patients with outcome/total number of patients (%) | Risk ratio (95% CI) | |
|---|---|---|---|
| No amiodarone yet at the same index time point | Received amiodarone at the index time point | ||
| 30-day neurological outcome | |||
| CPC 1 | 12 (21.1) | 1 (5.3) | |
| CPC 2 | 6 (10.5) | 2 (10.5) | |
| CPC 3 | 1 (1.8) | 2 (10.5) | |
| CPC 4 | 1 (3.5) | 1 (5.3) | |
| CPC 5 | 36 (63.2) | 13 (68.4) | |
| 30-day favorable neurological outcome | 18/57 (31.6) | 3/19 (15.8) | 0.45 (0.14–1.47) |
| 30-day survival | 21/57 (36.8) | 6/19 (31.6) | 0.74 (0.31–1.73) |
Table 5.
Results of sensitivity analysis
| Outcomes (RR [95%CI]) | GEE results including covariates with SD > 0.25 in time-dependent PSM | 1:1 time-dependent PSM |
|---|---|---|
| 30-day favorable neurological outcome | 0.92 (0.29–2.89) | 1 (0.26–3.83) |
| 30-day survival | -* | 1.6 (0.53–4.86) |