
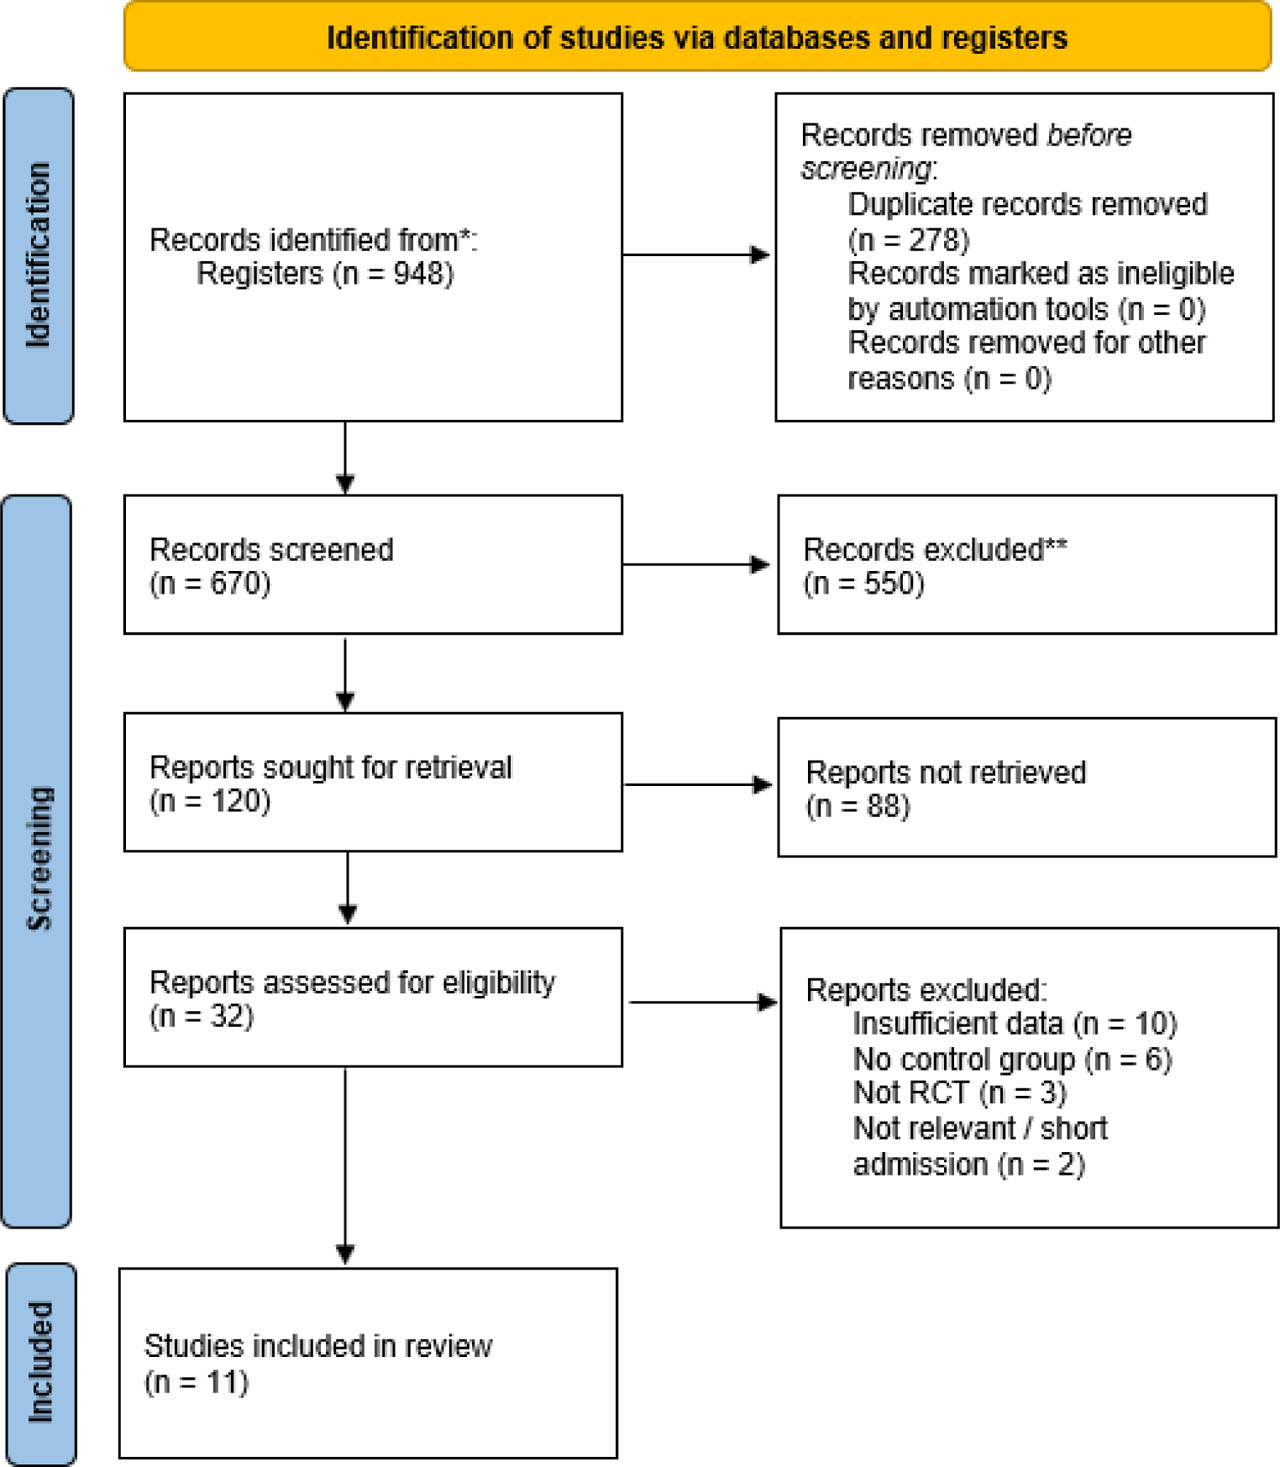
Figure 1.
PRISMA 2020 flow diagram of study selection
Table 1.
Characteristics of Included Studies
| Study | Country | Study design | Population | Intervention group (N) | Control group (N) | Primary outcome | Key findings |
|---|---|---|---|---|---|---|---|
| Aditianingsih et al. (2017) [24] | Indonesia | Single-blind RCT | Adults with DKA | Ringerfundin (15) | NS (15) | Standard Base Excess (SBE) and Strong Ion Difference (SID). | BES resulted in higher SBE and SID but was not significantly superior to NS. Noted significant baseline imbalance in SID. |
| Agarwal et al. (2025) [25] | India | Double-blind RCT | Pediatric (9 mo-12 yrs) with DKA | RL (33) | NS (34) | Time to DKA resolution. | Time to resolution of DKA was shorter in the RL group compared to the NS group. |
| Attokaran et al. (2023) [26] | Australia | Nested cohort within an open-label, cluster-crossover RCT | Adults with DKA in the ED | PL (46) | NS (38) | Proportion of patients requiring ICU admission. | No significant difference in ICU admission rates. Noted very low compliance (40%) with the allocated PL fluid. |
| Mahler et al. (2011) [27] | USA | Double-blind RCT | Adults with moderate-to-severe DKA | PL (22) | NS (23) | Prevention of hyperchloremic metabolic acidosis. | PL prevented hyperchloremic metabolic acidosis and resulted in higher serum bicarbonate levels compared to NS. |
| Ramanan et al. (2021) [8] | Australia | Open-label, cluster-crossover RCT (SCOPE-DKA) | Adults with severe DKA admitted to ICU | PL (48) | NS (42) | DKA resolution defined as base excess ≥ −3 mEq/L at 48 hours. | PL led to a faster resolution of metabolic acidosis at 24 hours compared to NS. |
| Self et al. (2020) [12]1 | USA | Pre-planned subgroup analysis of two cluster-crossover RCTs (SMART & SALT-ED) | Adults with DKA in the ED or ICU | BC (94) | NS (78) | Time to DKA resolution. | Treatment with BC resulted in a more rapid resolution of DKA compared with NS. |
| Trifi et al. (2025) [28] | Tunisia | Open-label RCT | Adults with severe DKA admitted to ICU | RL (46) | NS (42) | Composite of DKA resolution at 48 hours. | No significant difference in the rate of DKA resolution at 48 hours between the RL and NS groups. |
| Van Zyl et al. (2012) [13] | South Africa | Double-blind RCT | Adults with DKA | RL (28) | NS (29) | Time to pH normalization (pH ≥ 7.32). | The study failed to demonstrate a benefit from RL. The trial was stopped early due to slow enrolment. |
| Williams et al. (2020) [29] | India | Double-blind RCT (SPinK trial) | Pediatric (>1 mo- 12 yrs) with DKA | PL (34) | NS (32) | Incidence of new or progressive Acute Kidney Injury (AKI). | No significant difference in the incidence of AKI or the time to DKA resolution between groups. |
| Yan et al. (2024) [11] | Canada | Triple-blind pilot RCT (BRISK-ED trial) | Adults with DKA in the ED | RL (25) | NS (27) | Feasibility (recruitment rate) and efficacy (time to DKA resolution). | The trial protocol was feasible. Efficacy results showed a non-significant trend favouring NS for faster DKA resolution. |
| Yung et al. (2017) [30] | Australia | Double-blind RCT | Pediatric with moderate-to-severe DKA | HS (38) | NS (39) | Time to plasma bicarbonate ≥ 15 mmol/L. | No overall difference in outcomes, but a subgroup analysis suggested faster resolution of acidosis in patients with severe DKA. |
Abbreviations: BC, Balanced Crystalloid; DKA, Diabetic Ketoacidosis; ED, Emergency Department; HS, Hartmann’s Solution; ICU, Intensive Care Unit; N, Number of participants; NS, Normal Saline (0.9% Sodium Chloride); PL, plasma lactate; RCT, randomized controlled trial; RL, Ringer’s lactate.
1 Self et al. performed a prespecified subgroup analysis of patients with DKA from the larger SMART and SALT-ED trials [12].
Table 2.
Definitions of DKA Resolution in Included Studies
| Study | Definition of DKA Resolution |
|---|---|
| Agarwal et al. (2025) [25] | pH >7.3 OR Bicarbonate >15, Ketones <2, Anion Gap <12 |
| Self et al. (2020) [12] | Glucose <200 mg/dL + 2 of: Bicarbonate ≥15, pH >7.3, Anion Gap ≤12 |
| Williams et al. (2020) [29] | pH >7.3, Bicarbonate >15, normal sensorium |
| Yan et al. (2024) [11] | Glucose <200 + 2 of: Bicarbonate ≥15, pH >7.3, Anion Gap ≤12 |
| Yung et al. (2017) [30] | Bicarbonate >15 mmol/L (Biochemical only) |
| Van Zyl et al. (2012) [13] | pH ≥ 7.32 (Biochemical only) |
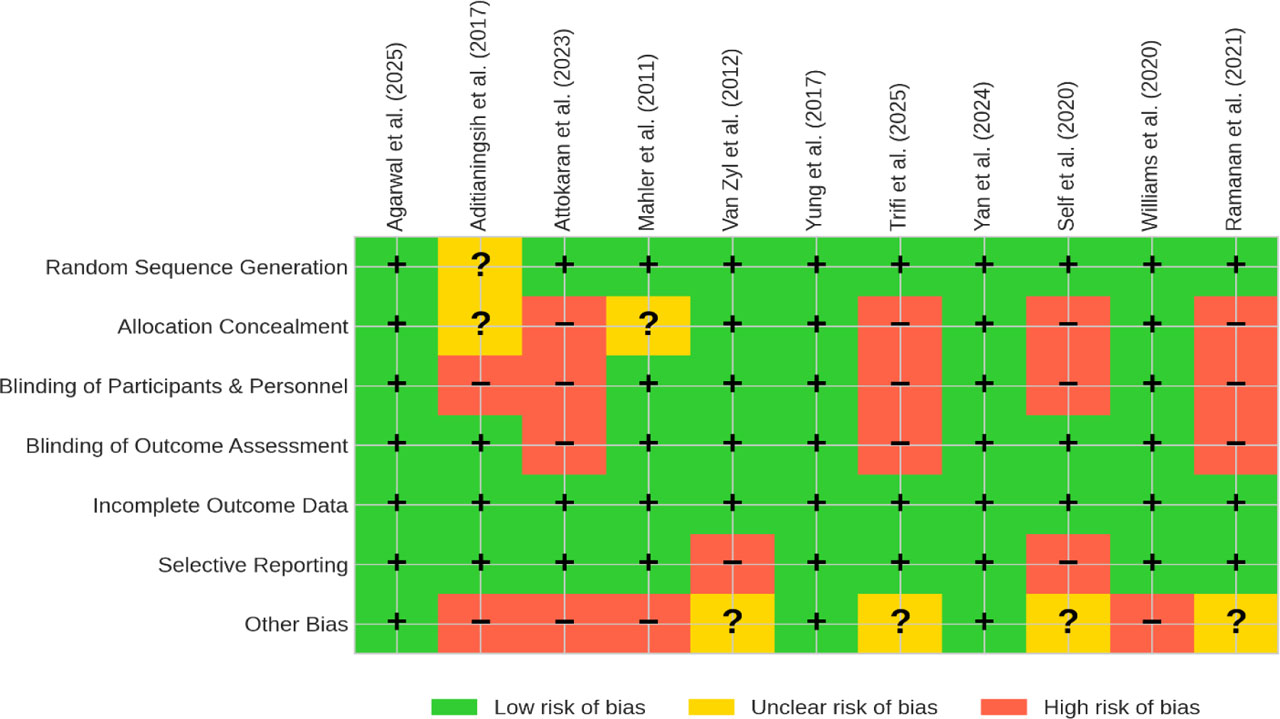
Figure. 2.
Risk of bias summary for included studies
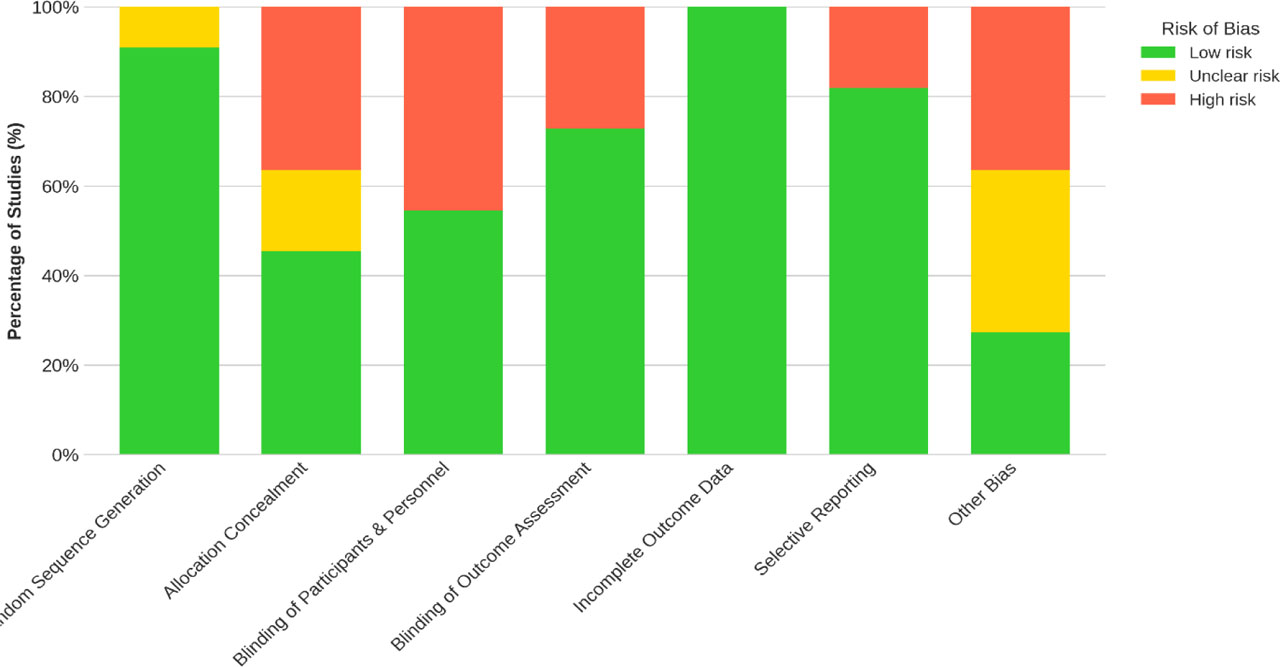
Figure. 3.
Risk of bias graph: Review authors’ judgements
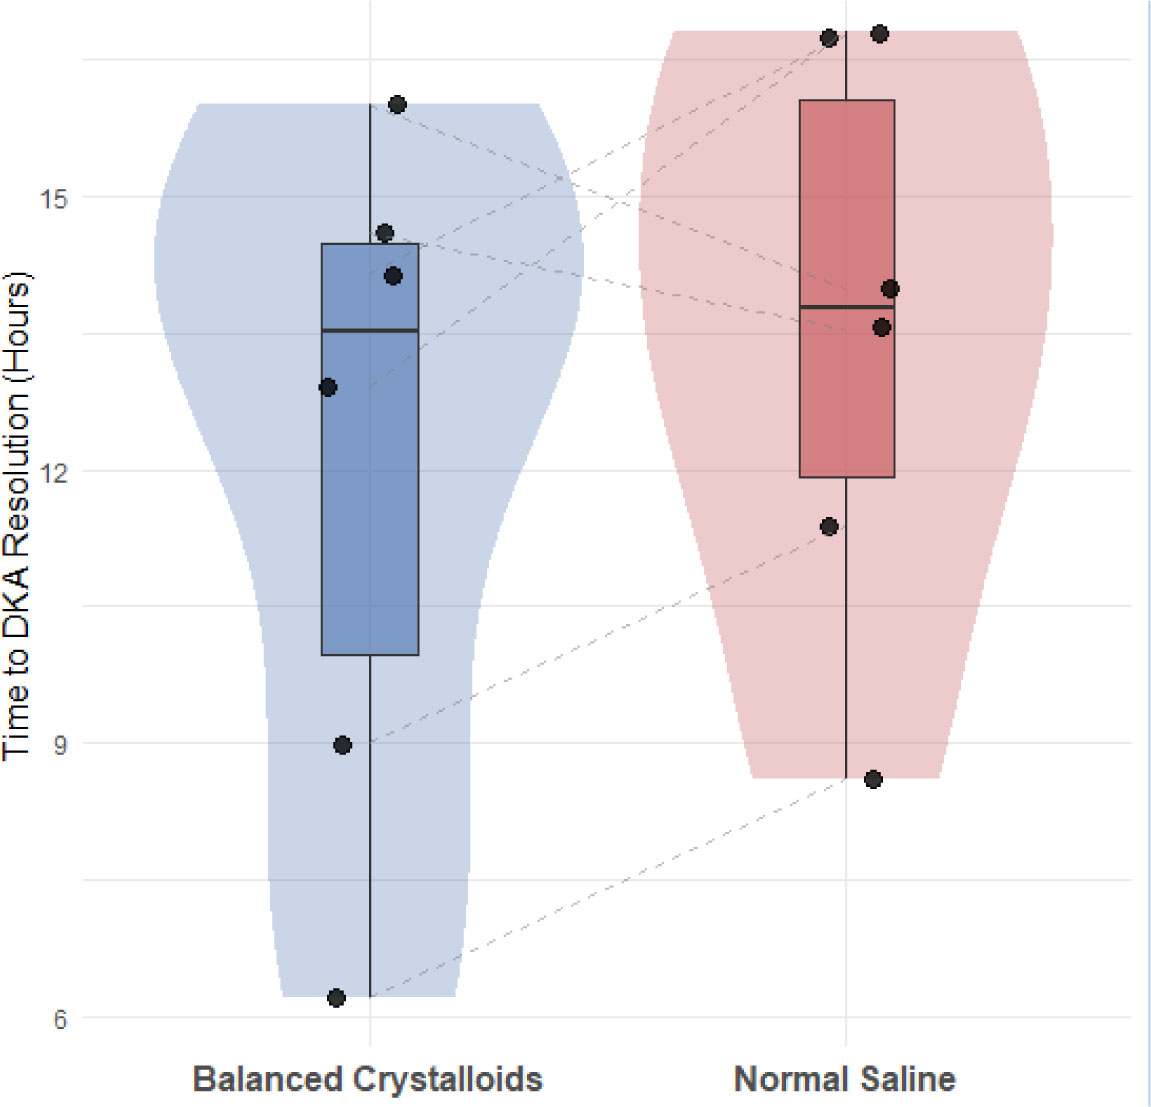
Figure 4.
Distribution of study means for time to DKA resolution
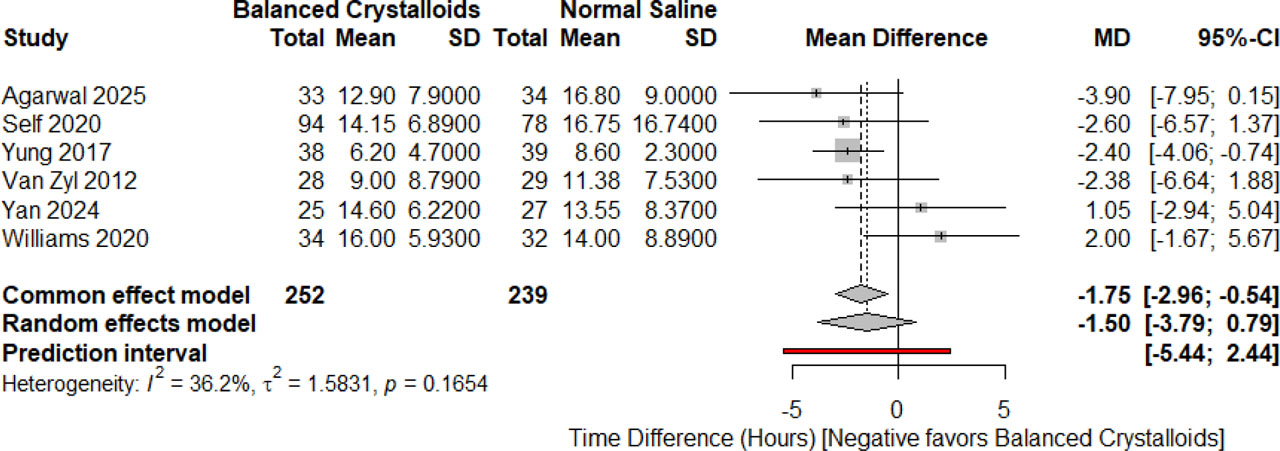
Figure. 5.
Forest plot of the mean difference in time to DKA resolution. The prediction interval (red line) estimates the range in which the true effect of the treatment is expected to lie in a future similar study, highlighting the potential for both benefit and harm in clinical practice.
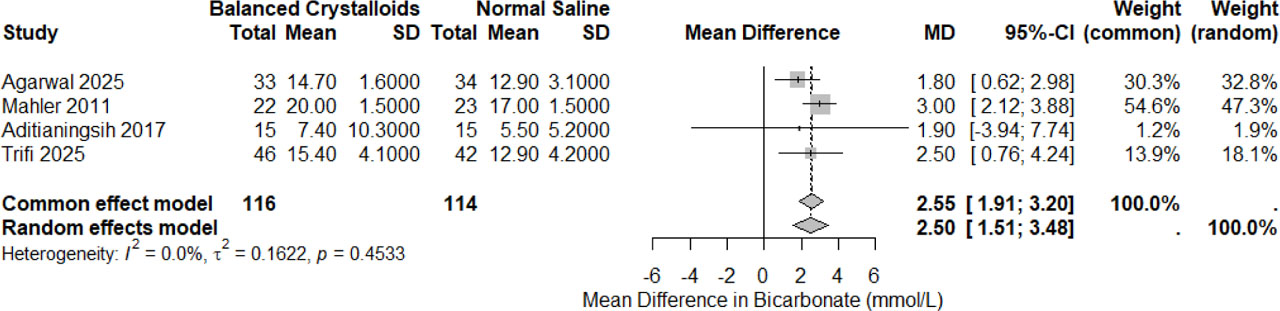
Figure. 6.
Forest plot of the odds ratio for the change in serum bicarbonate
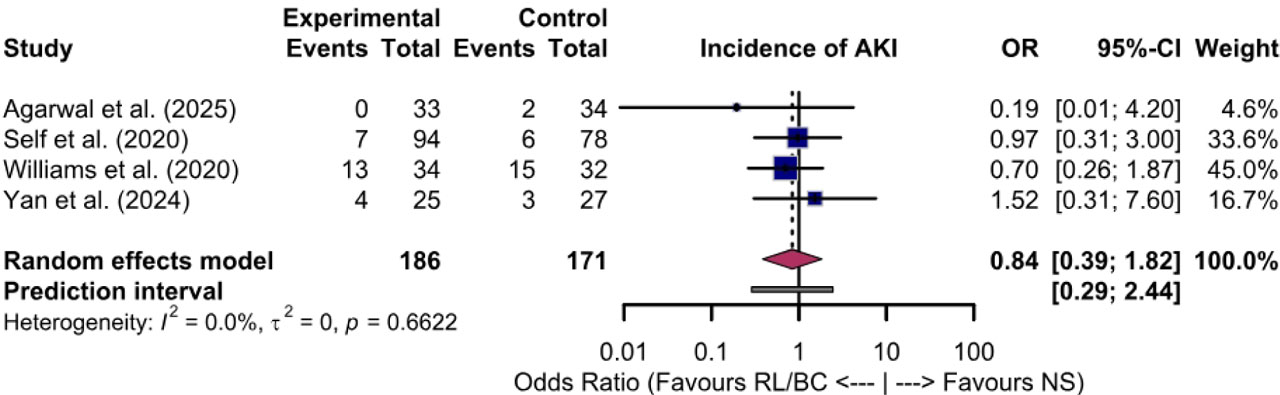
Figure. 7.
Forest plot of the odds ratio for the incidence of AKI
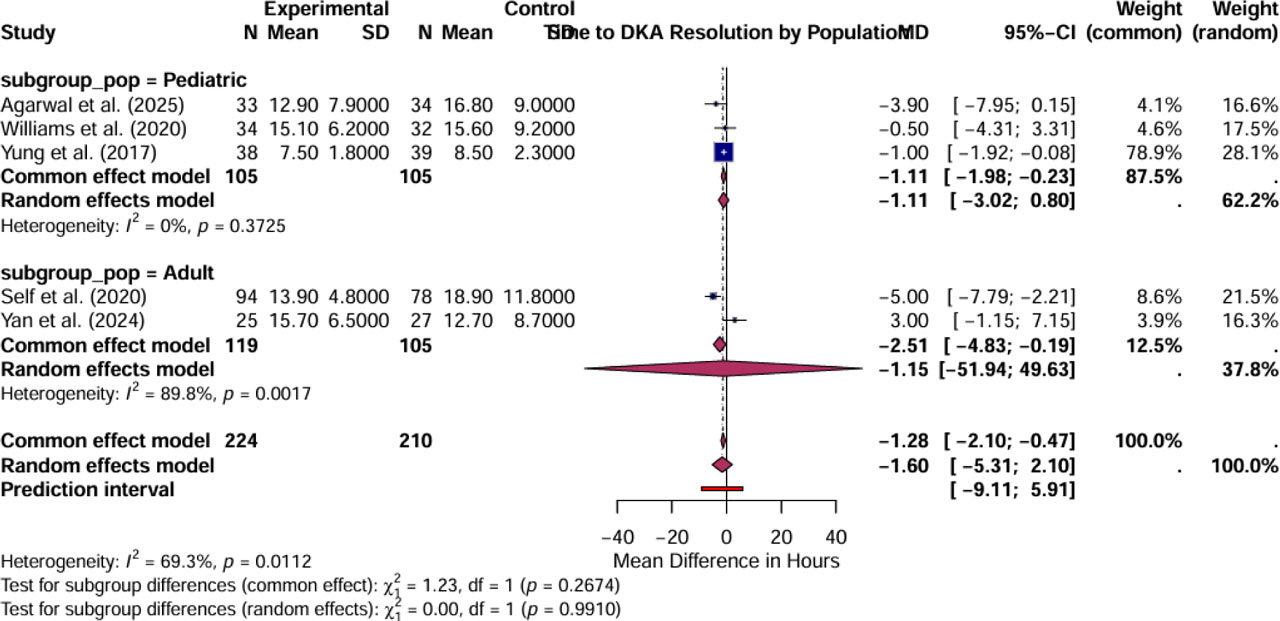
Figure. 8.
Subgroup analysis of time to DKA resolution by patient population (Pediatric vs. Adult). Prediction intervals are displayed to indicate the expected range of effects for future individual studies within each subgroup.
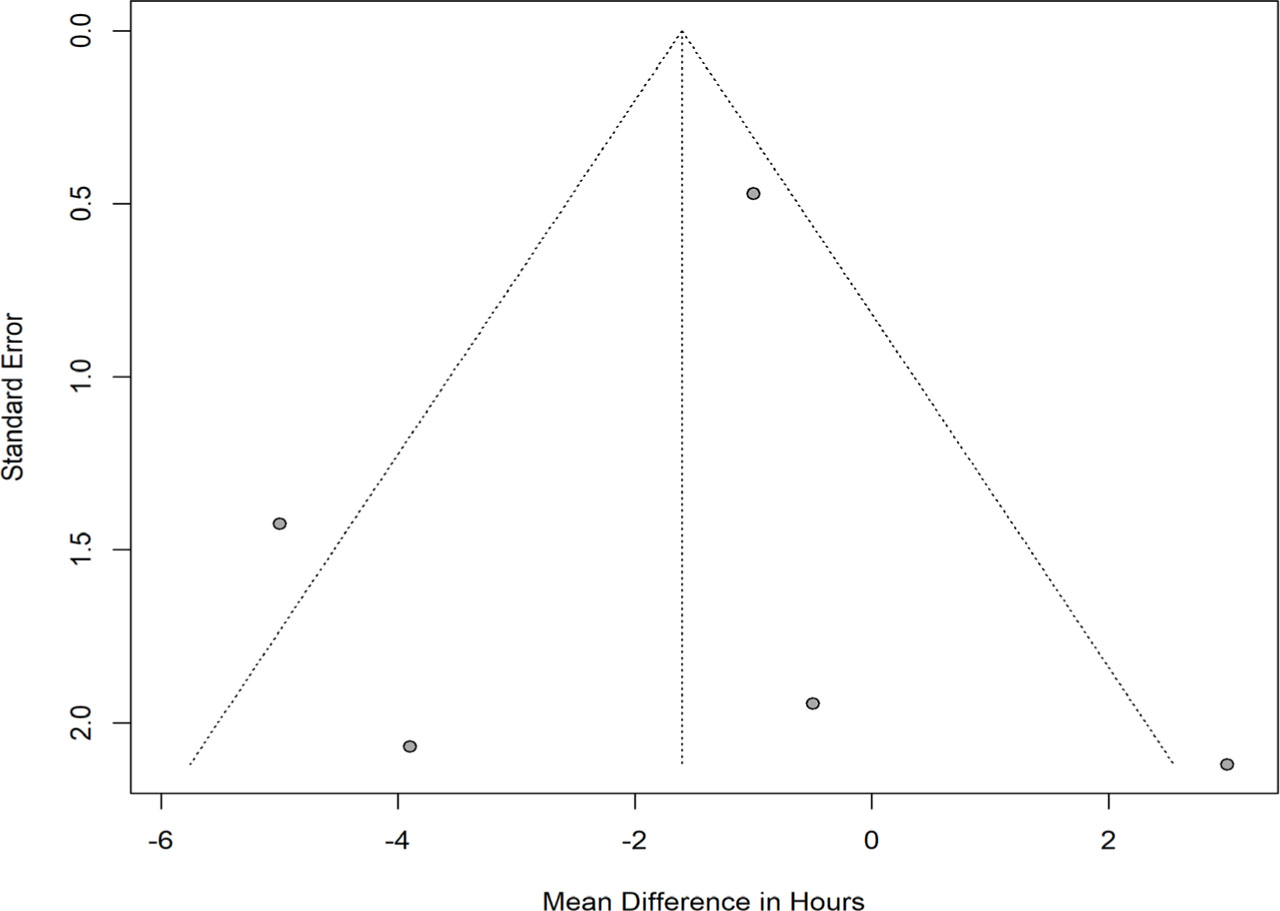
Figure. 9.
Funnel plot for the assessment of publication bias for the outcome of time to DKA resolution
Table 3.
GRADE Summary of Findings
| Outcome | Participants (Studies) | Effect (95% CI) | Certainty | Comments |
|---|---|---|---|---|
| Time to DKA resolution | 491 (6 RCTs) | MD-1.50 hrs (−3.79 to 0.79) | ⨁⨁◯◯ Low | Downgraded for imprecision (wide CI) and inconsistency |
| Bicarbonate at 12h | 230 (4 RCTs) | MD +2.50 mmol/L (1.51 to 3.48) | ⨁⨁⨁◯ Moderate | Downgraded for imprecision (small sample size) |
| Acute kidney injury | 357 (4 RCTs) | OR 0.84 (0.39 to 1.82) | ⨁⨁◯◯ Low | Downgraded for imprecision (wide CI) |