
Table 1.
Epidemiological characteristics of patients undergoing percutaneous tracheostomy in intensive care units of the Costa Rican Social Security Fund (CCSS), 2019–2022.
| Characteristics | |
|---|---|
| Age (years) | |
| Mean (SD) | 53.15 (16.28) |
| Median (Interquartile Range 25–75) | 55 (41.5–65) |
| Men (%) / Women (%) | 352 (68.2) / 164 (31.8) |
| Weight (kg) | |
| Mean (SD) | 78.67 (17.73) |
| Median (Interquartile Range 25–75) | 78 (67–89) |
| Height (cm) | |
| Mean (SD) | 166.5 (9.20) |
| Median (Interquartile Range 25–75) | 168 (160–173) |
| SOFA score at admission (n (%)) | N:443 |
| 0–6 | 141 (31.8) |
| 7–9 | 132 (29.8) |
| 10–12 | 123 (27.8) |
| 13–14 | 30 (6.8) |
| Greater than 15 | 17 (3.8) |
| Reason for ICU admission (n (%)) | |
| Pneumonia | 57 (11) |
| Polytrauma | 51 (9.9) |
| Traumatic brain injury | 86 (16.7) |
| Intracranial hemorrhage | 51 (9.9) |
| Postoperative neurosurgical care | 41 (7.9) |
| Acute respiratory distress syndrome | 20 (3.9) |
| Ischemic stroke | 11 (2.1) |
| Intra-abdominal infection | 14 (2.7) |
| Postoperative abdominal surgery | 7 (1.4) |
| Postoperative cardiac surgery | 4 (0.8) |
| COVID-19 | 47 (9.1) |
Table 2.
Ventilatory parameters of patients undergoing percutaneous tracheostomy in intensive care units of the Costa Rican Social Security Fund (CCSS), 2019–2022.
| Variable | Distribution |
|---|---|
| Duration of mechanical ventilation at the time of tracheostomy (days) | |
| Mean (SD) | 7.02 (4.89) |
| Median (Interquartile Range 25–75) | 6 (4–9) |
| Endotracheal tube internal diameter (F), n (%) | |
| 6.5 | 1 (0.19) |
| 7 | 54 (10.47) |
| 7.5 | 302 (58.53) |
| 8 | 150 (29.07) |
| 8.5 | 8 (1.55) |
| 9 | 1 (0.19) |
| FiO2 on the day of tracheostomy (%) | |
| Mean (SD) | 42.26 (18.46) |
| Median (Interquartile Range 25–75) | 35 (30–50) |
| Respiratory index on the day of the procedure (n = 214) | |
| Mean (SD) | 252.55 (96.95) |
| Median (Interquartile Range 25–75) | 255 (182–312) |
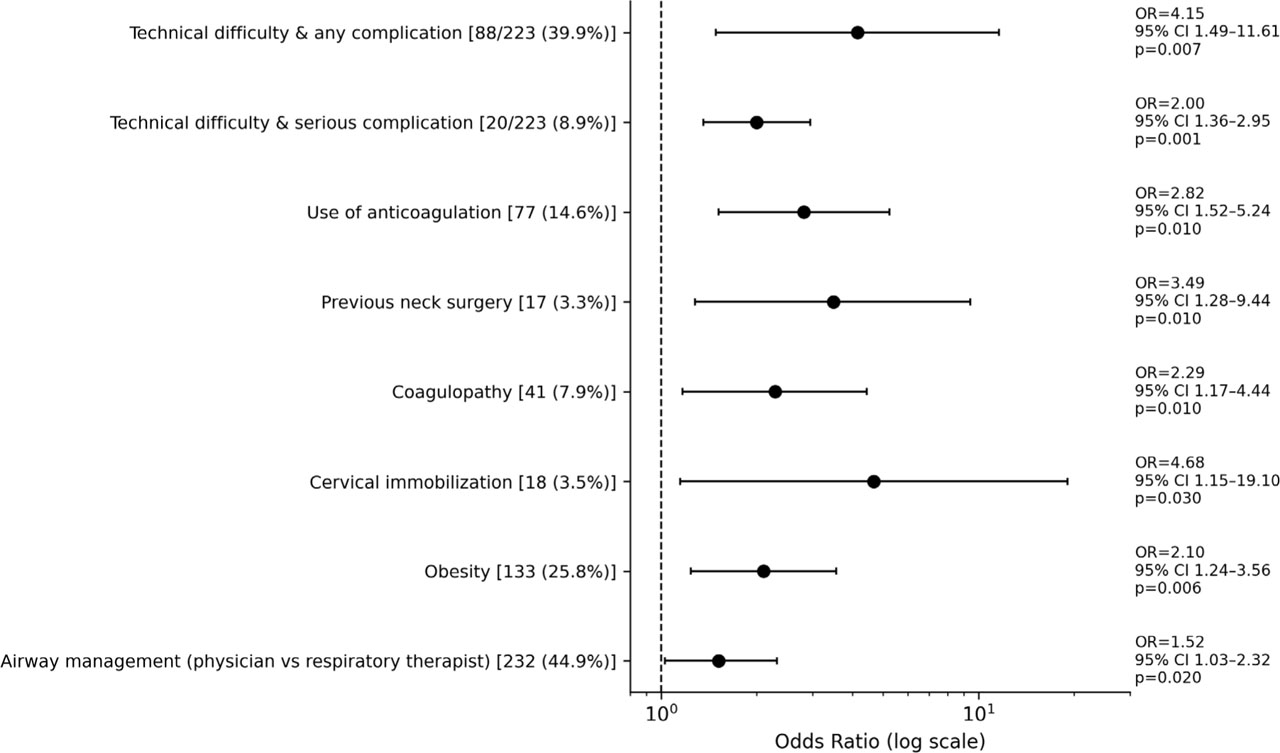
Fig. 1.
Forest plot of odds ratios (OR) and confidence intervals for immediate complications in percutaneous tracheostomy in intensive care units of the Costa Rican Social Security Fund (CCSS), 2019–2022.
Table 3.
Clinical parameters associated with greater difficulty in performing percutaneous tracheostomy in patients from intensive care units of the Costa Rican Social Security Fund (CCSS), 2019–2022.
| Characteristic | (%) |
|---|---|
| Short neck | 115 (22.3) |
| Coagulopathy | 41 (7.9) |
| Previous neck surgery | 17 (3.3) |
| Goiter | 9 (1.7) |
| Neck burn | 4 (0.8) |
| Cervical immobilization | 18 (3.5) |
| Obesity | 133 (25.8) |
| Procedure performed in an emergency situation | 13 (2.5) |
Table 4.
Immediate complications associated with percutaneous tracheostomy in patients from intensive care units of the Costa Rican Social Security Fund (CCSS), 2019–2022.
| Complication | n (%) |
|---|---|
| Bleeding controlled by pressure | 93 (18.02) |
| Bleeding controlled with suture | 31 (6.01) |
| Bleeding requiring surgical intervention | 7 (1.36) |
| Airway loss | 7 (1.36) |
| Desaturation | 20 (3.88) |
| Pneumothorax | 2 (0.39) |
| False passage | 7 (1.36) |
| Pneumomediastinum | 1 (0.19) |
| Subcutaneous emphysema | 2 (0.39) |
| Posterior tracheal wall injury | 1 (0.19) |
| Guidewire loss | 2 (0.39) |
| Failed tracheostomy | 2(0.39) |
Table 5.
Factors associated with immediate complications during percutaneous tracheostomy in patients from intensive care units of the Costa Rican Social Security Fund (CCSS), 2019–2022.
| Factors Associated with Complications | n (%) | OR | 95% CI | p |
|---|---|---|---|---|
| Technical difficulty and any complication | 88/223 (39.91) | 4.15 | 1.49–11.61 | 0.007 |
| Technical difficulty and serious complication | 20/223 (8.9) | 2.00 | 1.36–2.95 | 0.001 |
| Use of anticoagulation | 77 (14.56) | 2.82 | 1.52–5.24 | 0.01 |
| Previous neck surgery | 17 (3.3) | 3.49 | 1.28–9.44 | 0.01 |
| Coagulopathy | 41 (7.9) | 2.29 | 1.17–4.44 | 0.01 |
| Cervical immobilization | 18 (3.5) | 4.68 | 1.15–19.1 | 0.03 |
| Obesity | 133 (25.8) | 2.1 | 1.24–3.56 | 0.006 |
| Airway management by medical staff vs. respiratory therapist | 232 (44.9) | 1.52 | 1.03–2.32 | 0.02 |