
Table 1.
Trends in average doses of phenobarbital and lorazepam, hospital LOS and ICU LOS during the 4 complete years in which the study was completed.
Table 2.
Demographics of patients included in the study during the baseline period and post-intervention period. P values reported from paired t-tests.
| Baseline | p | Post-intervention | p | |||
|---|---|---|---|---|---|---|
| PB | Lor | PB | Lor | |||
| N | 189 | 460 | 26 | 12 | ||
| Age | 51 | 58.6 | <0.001 | 49.54 | 57 | 0.12 |
| Female | 35 (18.5%) | 139 (30.2%) | 6 (23.1%) | 1 (8.3%) | ||
| Male | 154 (81.5%) | 321 (69.8%) | 20 (77.0%) | 11 (91.7%) | ||
| Max CIWA1 | 58 | 48 | <0.001 | 53 | 22 | 0.01 |
| Avg2 CIWA | 32 | 18 | 23 | 15 | ||
| Cirrhosis (n) | 7 | 18 | 0 | 0 | ||
| Avg PB3 (mg/kg) | 11.44 | na | 15.6 | na | 0.10 | |
| Avg Lor4 (mg) | 142 | 30 | 30.9 | 11 | 0.22 | |
| Dex5 (n received) | 112 received (59.26%) | 113 received (24.57%) | na | na | ||
| Avg Dex (mcg/kg) | 34.21 | 14.92 | na | na | ||
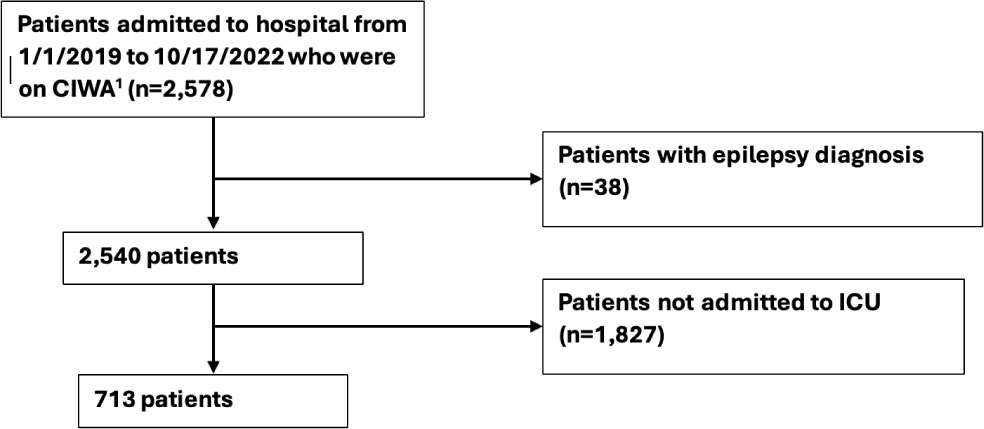
Fig. 1.
Patient inclusion criteria for baseline period (1/1/2019 through 10/17/2022).
1 CIWA (clinical institute of withdrawal assessment)
Table 3.
Patients treated with phenobarbital and lorazepam compared with those treated with only lorazepam in the ICU during the baseline (top two rows) and post-intervention (bottom two rows) periods. LOS p-values were obtained from Mann-Whitney U tests; all other p-values are from paired t tests.
| n | Hospital LOS3 (mean days +/−SD) | P-value | ICU LOS (mean days +/−SD) | P-value | Medication Amount | Mechanical Vent | P-Value | Discharge Alive (n) | P-Value | |
|---|---|---|---|---|---|---|---|---|---|---|
| PB1 | 189 (26.51%) | 12.83 (+/− 12.44) | 0.05 (95%CI: −2.21, 0.0014) | 7.33 (+/− 8.35) | p<0.001 (95% CI: −2.36, −1.32) | 11.44mg/kg | 59 (31.22%) | 0.65 | 180 (95.24%) | 0.0008 |
| Lor2 | 460 (64.52%) | 14.74 (+/− 21.01) | 5.09 (+/− 7.05) | 30.12mg | 152 (33.04%) | 396 (86.09%) | ||||
| PB (post intervention) | 26 (59.01%) | 6.14 (+/− 8.58) | 0.12 (95% CI: −1.21, 15.29) | 3.77 (+/− 3.59) | 0.13 (95%CI: −0.29, 4.28) | 15.60mg/kg | 8 (18.18%) | 0.94 | 24 (92.31%) | 0.04 |
| Lor (post intervention) | 12 (27.27%) | 16.26 (+/− 12.67) | 9.89 (+/− 13.00) | 11.17mg | 4 (9.09%) | 8 (66.67%) |
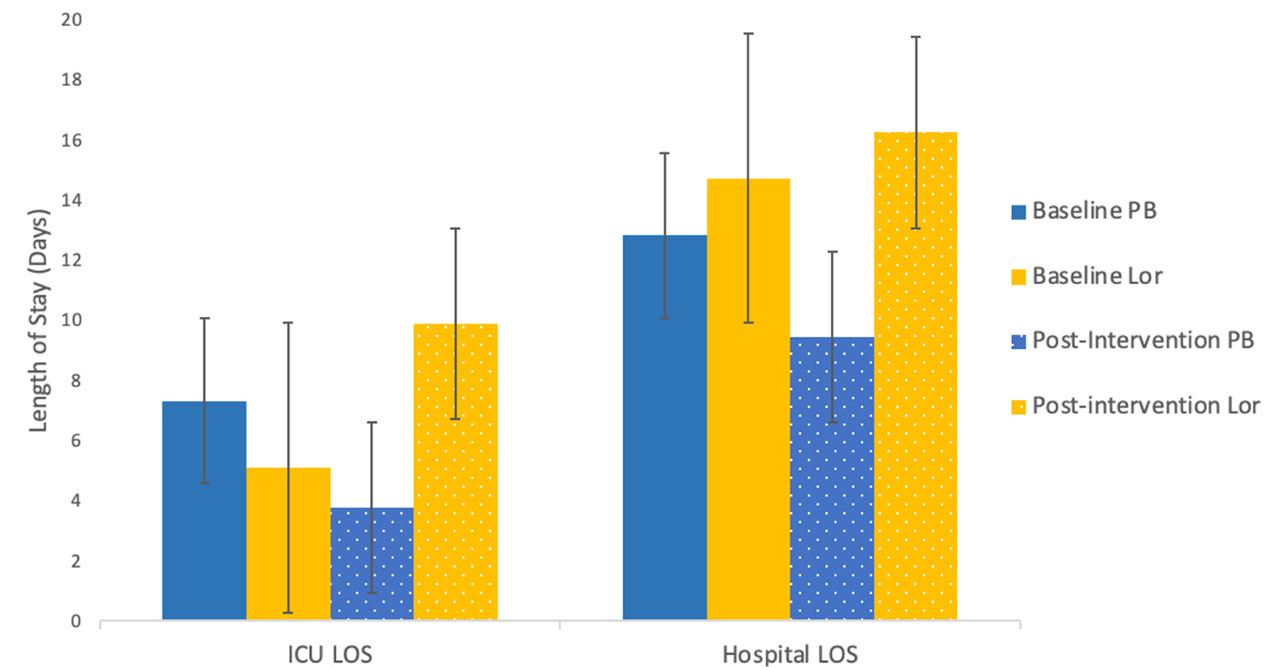
Fig. 2.
Mean ICU and hospital lengths of stay in patients treated with phenobarbital (PB) or lorazepam (Lor) +/− 1SD during the baseline and intervention periods. ICU LOS were significantly longer for those received PB compared to those who received lorazepam at baseline, but had no significant difference after the intervention. Hospital LOS was not significantly different during the baseline or intervention periods. (Mann-Whitney U testing used to test differences between mean LOS).
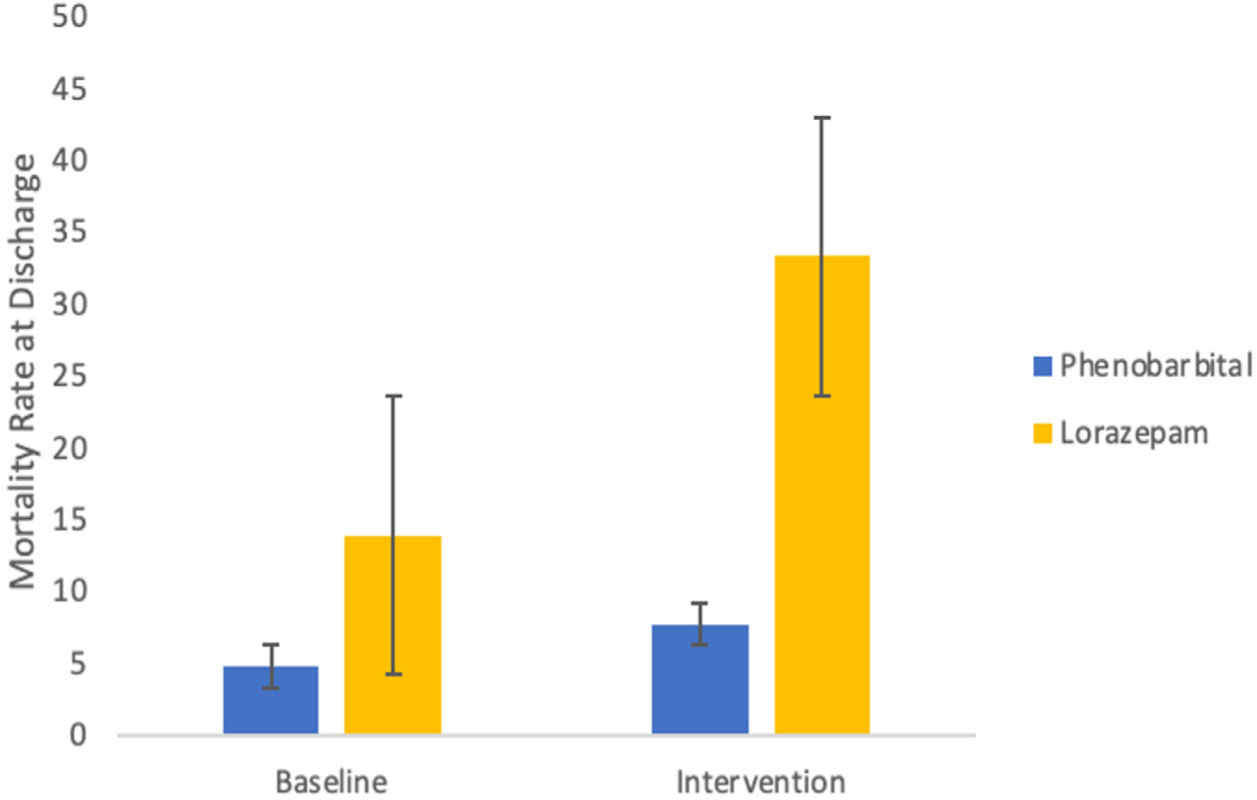
Fig. 3.
Mortality rate of patients treated with lorazepam versus phenobarbital +/− 1SD during the baseline and intervention periods. For both time periods there was a significantly lower mortality rate in those who received phenobarbital.