
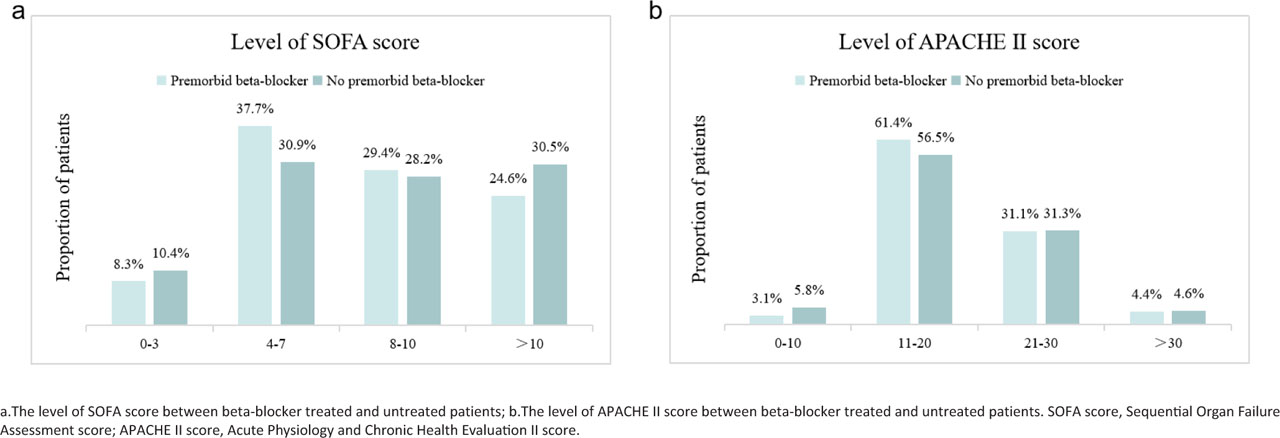
Fig. 1.
Levels of SOFA and APACHE II score among patients with or without premorbid beta-blocker.
Table 1.
Patient Characteristics.
| Overall population (N=1005, 100%) | Premorbid beta-blocker (N=228, 22.7%) | No premorbid beta-blocker (N=777, 77.3%) | P value | |
|---|---|---|---|---|
| Baseline characteristics | ||||
| Age, years, mean ± SD | 70 ± 14 | 71 ± 11 | 69 ± 14 | 0.203 |
| Gender (male), n, (%) | 651 (64.8) | 157 (68.9) | 494 (63.6) | 0.142 |
| BMI (kg/m2), mean ± SD | 22.8 ± 3.4 | 22.9 ± 3.6 | 22.9 ± 3.4 | 0.811 |
| Coexisting conditions, n. (%) | ||||
| Hypertension | 702 (69.9) | 194 (85.1) | 508 (65.4) | < 0.001 |
| Coronary heart disease | 73 (7.3) | 42 (18.4) | 31 (4.0) | < 0.001 |
| Heart failure | 57 (5.8) | 20 (8.8) | 37 (4.8) | 0.021 |
| Arrhythmia | 80 (8.0) | 36 (15.8) | 44 (5.7) | < 0.001 |
| Valvular heart disease | 14 (1.3) | 5 (2.2) | 9 (1.2) | 0.241 |
| Diabetes | 261 (26.0) | 70 (30.7) | 191 (24.6) | 0.064 |
| Chronic obstructive pulmonary disease | 37 (3.7) | 8 (3.5) | 29 (3.7) | 0.875 |
| Chronic bronchitis | 19 (1.9) | 4 (1.8) | 15 (1.9) | 0.864 |
| Bronchiectasis | 10 (1.0) | 4 (1.8) | 6 (0.8) | 0.190 |
| Chronic kidney disease | 89 (8.9) | 24 (10.5) | 65 (8.4) | 0.313 |
| Cerebrovascular disease | 160 (15.9) | 46 (20.2) | 114 (14.7) | 0.046 |
| Malignancy | 107 (10.6) | 26 (11.4) | 81 (10.4) | 0.674 |
| Autoimmune diseases | 17 (1.7) | 2 (0.9) | 15 (1.9) | 0.278 |
| Source of sepsis, n. (%) | ||||
| Pulmonary | 666 (66.3) | 162 (71.1) | 504 (64.9) | 0.082 |
| Intraabdominal | 268 (26.7) | 47 (20.6) | 221 (28.4) | 0.019 |
| Urinary infections | 137 (13.6) | 33 (14.5) | 104 (13.4) | 0.674 |
| Soft tissue infection | 27 (2.7) | 6 (2.6) | 21 (2.7) | 0.953 |
| Bacteraemia | 43 (4.3) | 8 (3.5) | 34 (4.4) | 0.565 |
| Other sources | 21 (2.1) | 4 (1.8) | 17 (2.2) | 0.678 |
| Pathogen, n. (%) | ||||
| Gram-positive | 142 (14.1) | 34 (14.9) | 108 (13.9) | 0.700 |
| Gram-negative | 431 (42.9) | 110 (48.2) | 321 (41.3) | 0.063 |
| Anaerobic bacteria | 7 (0.7) | 1 (0.4) | 6 (0.6) | 0.074 |
| Fungus | 150 (14.9) | 43 (18.9) | 107 (13.8) | 0.058 |
| Virus | 123 (12.2) | 33 (14.5) | 90 (11.6) | 0.242 |
| Unknown | 290 (28.9) | 63 (27.6) | 227 (29.2) | 0.643 |
| Vital signs | ||||
| T (°C) | 38.3 [37.7, 39] | 38.2 [37.8, 38.9] | 38.3 [37.7, 39] | 0.556 |
| HR (min−1) | 104 [94, 117] | 104 [95, 117] | 103 [94, 117] | 0.861 |
| RR (min−1) | 22 [20, 25] | 22 [21, 26] | 22 [20, 25] | 0.251 |
| MAP (mmHg) | 71.3 [64.7, 77.0] | 72.7 [66.7, 77.0] | 71.0 [64.0, 77.0] | 0.219 |
| Vital lab data, median (IQR) | ||||
| WBC (109/L) | 11.0 [7.0, 16.7] | 10.9 [7.3, 16.7] | 11.1 [6.9, 16.9] | 0.988 |
| RBC (109/L) | 3.4 [2.8, 4.0] | 3.4 [2.8, 4.1] | 3.4 [2.8, 4.0] | 0.497 |
| PLT (109/L) | 141.0 [79.5, 217.5] | 158.5 [93,229.8] | 134.0 [74.5, 214.0] | 0.038 |
| HGB (g/L) | 102.0 [83.2, 120.0] | 102.0 [82.3, 121.8] | 101.0 [83.7, 120.0] | 0.959 |
| CRP (mg/L) | 99.0 [46.1, 160.0] | 108.4 [52.2, 160.0] | 97.9 [43.8, 160.0] | 0.693 |
| TBIL (umol/L) | 16.2 [10.7, 30.1] | 14.4 [10.3, 26.0] | 16.6 [10.9, 31.9] | 0.035 |
| ALB (g/L) | 29.7 [26.3, 33.6] | 29.9 [26.4, 34.4] | 29.7 [26.3, 33.3] | 0.295 |
| BNU (mmol/L) | 11.9 [7.4, 20.0] | 11.1 [7.1, 19.9] | 11.9 [7.7, 20.0] | 0.421 |
| LAC (mmol/L) | 3.3 [2.4, 4.5] | 3.4 [2.4, 4.7] | 3.3 [2.3, 4.7] | 0.267 |
| Severity, mean ± SD | ||||
| SOFA score | 8.5 ± 3.8 | 8.3 ± 3.8 | 8.5 ± 3.8 | 0.519 |
| APACHE II score | 19.0 ± 6.2 | 18.8 ± 5.9 | 19.0 ± 6.2 | 0.677 |
[i] T, temperature; HR, heart rate; RR, respiratory rate; MAP, mean arterial pressure; WBC, White Blood Cells; RBC, Red Blood Cells; PLT, Platelet; HGB, hemoglobin; CRP, hypersensitive C-reactive protein; TBIL, total bilirubin; ALB, albumin; BUN, blood urea nitrogen; LAC, lactic acid; SOFA score, Sequential Organ Failure Assessment score; APACHE II score, Acute Physiology and Chronic Health Evaluation II score; SD, standard deviation; IQR, interquartile range; Premorbid beta-blocker, patients with premorbid beta blocker therapy before septic episodes; No premorbid beta-blocker, patients without premorbid beta blocker therapy before septic episodes.
Table 2.
Comparison of myocardial injury markers, echocardiography and electrocardiogram abnormalities.
| Premorbid beta-blocker (N=228, 22.7%) | No premorbid beta-blocker (N=777, 77.3%) | P value | |
|---|---|---|---|
| Myocardial injury markers, median (IQR) | |||
| TnI (pg/ml) | 87.9 (23.4–306.0) | 142.0 (37.8–481.2) | 0.004 |
| BNP (pg/ml) | 267.9 (118.1–1065.1) | 509.3 (184.8–1203.0) | 0.002 |
| MYO (ng/ml) | 209.8 (100.3–600.4) | 283.6 (103.0–1046.0) | 0.053 |
| CK (U/L) | 107.5 (43.3–253.0) | 127.0 (48.0–307.0) | 0.147 |
| CKMB (U/L ) | 28.0 (13.0–97.0) | 29.0 (16.0–63.0) | 0.077 |
| LDH (U/L) | 274.0 (175.0–496.0) | 319.0 (229.0–456.8) | 0.022 |
| Echocardiographic parameters, median (IQR) | |||
| LVEF, (%) | 58.0 (52.0–60.0) | 55.0 (50.0–60.0) | 0.009 |
| LAD, (cm) | 3.4 (3.0–3.9) | 3.4 (3.1–3.9) | 0.243 |
| LVEDD, (cm) | 4.3 (4.2–4.6) | 4.5 (4.3–4.8) | < 0.001 |
| RAD, (cm) | 3.3 (3.2–3.6) | 3.4 (3.3–3.7) | 0.035 |
| RVD, (cm) | 3.4 (3.2–3.5) | 3.4 (3.2–3.6) | 0.007 |
| PA, (cm) | 2.3 (2.2–2.5) | 2.3 (2.2–2.5) | 0.092 |
| Electrocardiogram manifestations, no. (%) | |||
| Atrial fibrillation | 41 (18.0) | 113 (14.5) | 0.205 |
| Premature atrial contractions | 27 (11.8) | 127 (16.3) | 0.097 |
| Atrial flutter | 7 (3.1) | 26 (3.3) | 0.837 |
| Atrial tachycardia | 3 (1.3) | 16 (2.1) | 0.469 |
| Supraventricular tachycardia | 3 (1.3) | 7 (1.0) | 0.579 |
| Premature ventricular contractions | 19 (8.3) | 66 (8.5) | 0.939 |
| Ventricular tachycardia | 2 (0.8) | 10 (1.3) | 0.616 |
| Atrioventricular block | 5 (2.2) | 16 (2.1) | 0.901 |
| Bundle branch block | 41 (18.0) | 143 (18.4) | 0.885 |
[i] TnI, troponin I; BNP, B-type natriuretic peptide; MYO, myoglobin; CK, creatine kinase; CKMB,creatine kinase isoenzyme; LDH, lactic dehydrogenase; LVEF, left ventricular ejection fraction; LAD, left atrial diameter; LVEDD, left ventricular end diastolic diameter; RAD, right atrial diameter; RVD, right ventricular diameter; PA, pulmonary artery diameter; IQR, interquartile range. Premorbid beta-blocker, patients with premorbid beta blocker therapy before septic episodes; No premorbid beta-blocker, patients without premorbid beta blocker therapy before septic episodes.
Table 3.
Analysis of mortality between premorbid beta-blocker treated and untreated patients.
| Overall population (N=1005, 100%) | Premorbid beta-blocker (N=228, 22.7%) | No premorbid beta-blocker (N=777, 77.3%) | P value | |
|---|---|---|---|---|
| In-hospital mortality, (%), 95%CI | 26.6 [23.8–29.3] | 18.9 [13.7–24.0] | 28.8 [25.6–32.0] | 0.003 |
| 7-day mortality, (%), 95%CI | 12.0 [10.0–14.1] | 9.2 [5.4–13.0] | 12.9 [10.5–15.2] | 0.135 |
| 14-day mortality, (%), 95%CI | 19.7 [17.2–22.2] | 13.6 [9.1–18.1] | 21.5 [18.6–24.4] | 0.008 |
| 28-day mortality, (%), 95%CI | 25.2 [22.5–27.9] | 17.5 [12.6–22.5] | 27.4 [24.3–30.6] | 0.003 |
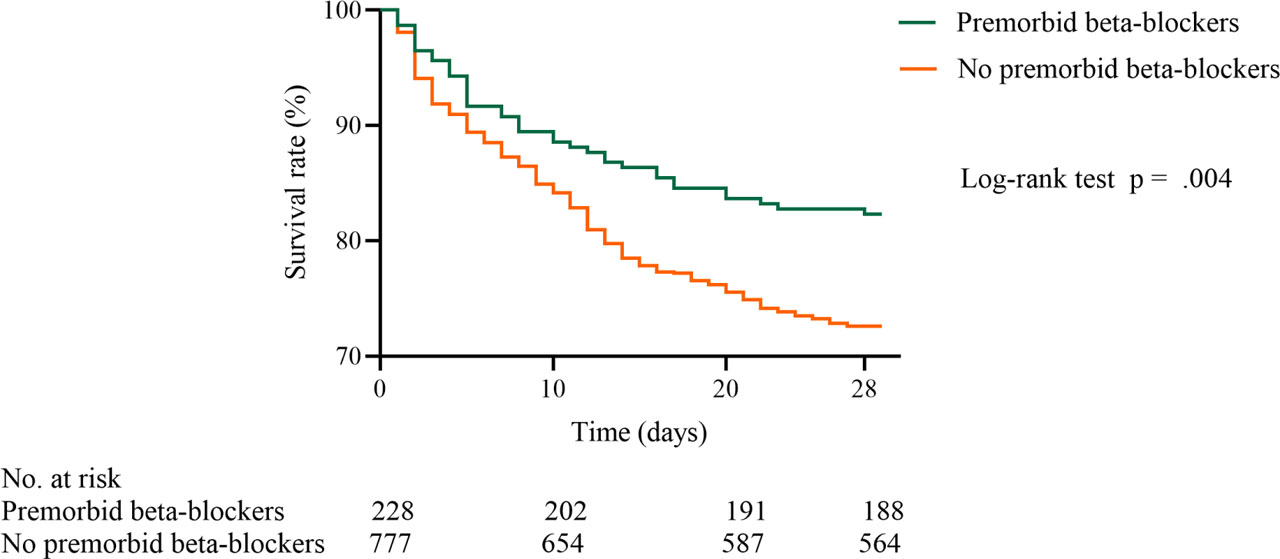
Fig. 2.
28-day survival rate for primary cohort.