Table 1.
Admission and observation characteristics of the sample (N=709)
| Variable | Category | n |
|---|---|---|
| Age, Mean (SD) | 51.04 (12.57) | |
| Gender, n (%) | Male | 468 (65.9%) |
| Female | 241 (34.1%) | |
| Admission Diagnosis, n (%) | Sepsis | 216 (30.5%) |
| Respiratory | 176 (24.8%) | |
| Trauma | 136 (19.2%) | |
| Cardiovascular | 97 (13.7%) | |
| Neurologic | 35 (4.9%) | |
| Gastrointestinal | 22 (3.1%) | |
| Other | 27 (3.8%) | |
| Admission BMI (Kg/m2), n (%) | Underweight (<18.5) | 11 (1.6%) |
| Normal (18.5−24.9) | 272 (38.4%) | |
| Overweight (25−29.9) | 260 (36.7%) | |
| Obese (>30) | 166 (23.4%) | |
| Admission APACHE II score, Mean (SD) | 18.22 (6.5) | |
| Admission SOFA score, Mean (SD) | 7.15 (3.0) | |
| Length of ICU stay (Days), Median (IQR) | 12 (10–19) | |
| Range: 6–61 days | ||
| Duration of EN (Days), Median (IQR) | 7 (4–10) | |
| Range: 1–30 days | ||
| Duration of MV (Days), Median (IQR) | 10 (5–13) | |
| Range: 1–36 days | ||
| Mortality, n (%) | Number of deaths (%) | 85 (12.0%) |
| Day of death, Median (IQR) | Day 8th day (5th – 11th) |
Table 2.
Malnutrition screening using bioelectrical, physiological, and qualitative measures (N=709)
| Variable | Category | Value |
|---|---|---|
| Assessment day of BIA since admission, Median (IQR) | Day 9th (7th – 11th) | |
| Phase Angle (PA) score | >4 “Mild malnutrition”, n (%) | 312 (44.0%) |
| ≤4 “Severe Malnutrition”, n (%) | 397 (56.0%) | |
| PA mean (SD) | 3.27 (1.58) | |
| Skeletal Muscle Mass (SMM) ‘lbs’, Median (IQR) | DECREASE | 30 (24–34) |
| Body Fat Mass ‘lbs’, Median (IQR) | NORMAL | 17 (6–24) |
| ECW/TBW Ratio, Median (IQR) | Decreased | 0.4 (0.36–0.44) |
| Admission NUTRIC score | 0–4 “Low Risk”, n (%) | 389 (54.9%) |
| 5–9 “High Risk”, n (%) | 320 (45.1%) | |
| NUTRIC mean (SD) | 4.73 (2.0) | |
| Admission MUST score, n (%) | 0 “Low Risk” | 380 (53.6%) |
| 1 “Medium Risk” | 202 (28.5%) | |
| ≥2 “High Risk” | 127 (17.9%) | |
| Admission NRS-2002, n (%) | <3 Low Nutritional risk | 329 (46.4%) |
| ≥3 High nutritional risk | 380 (53.6%) |
Table 3.
Predictive characteristics of malnutrition screening tools (N=709)
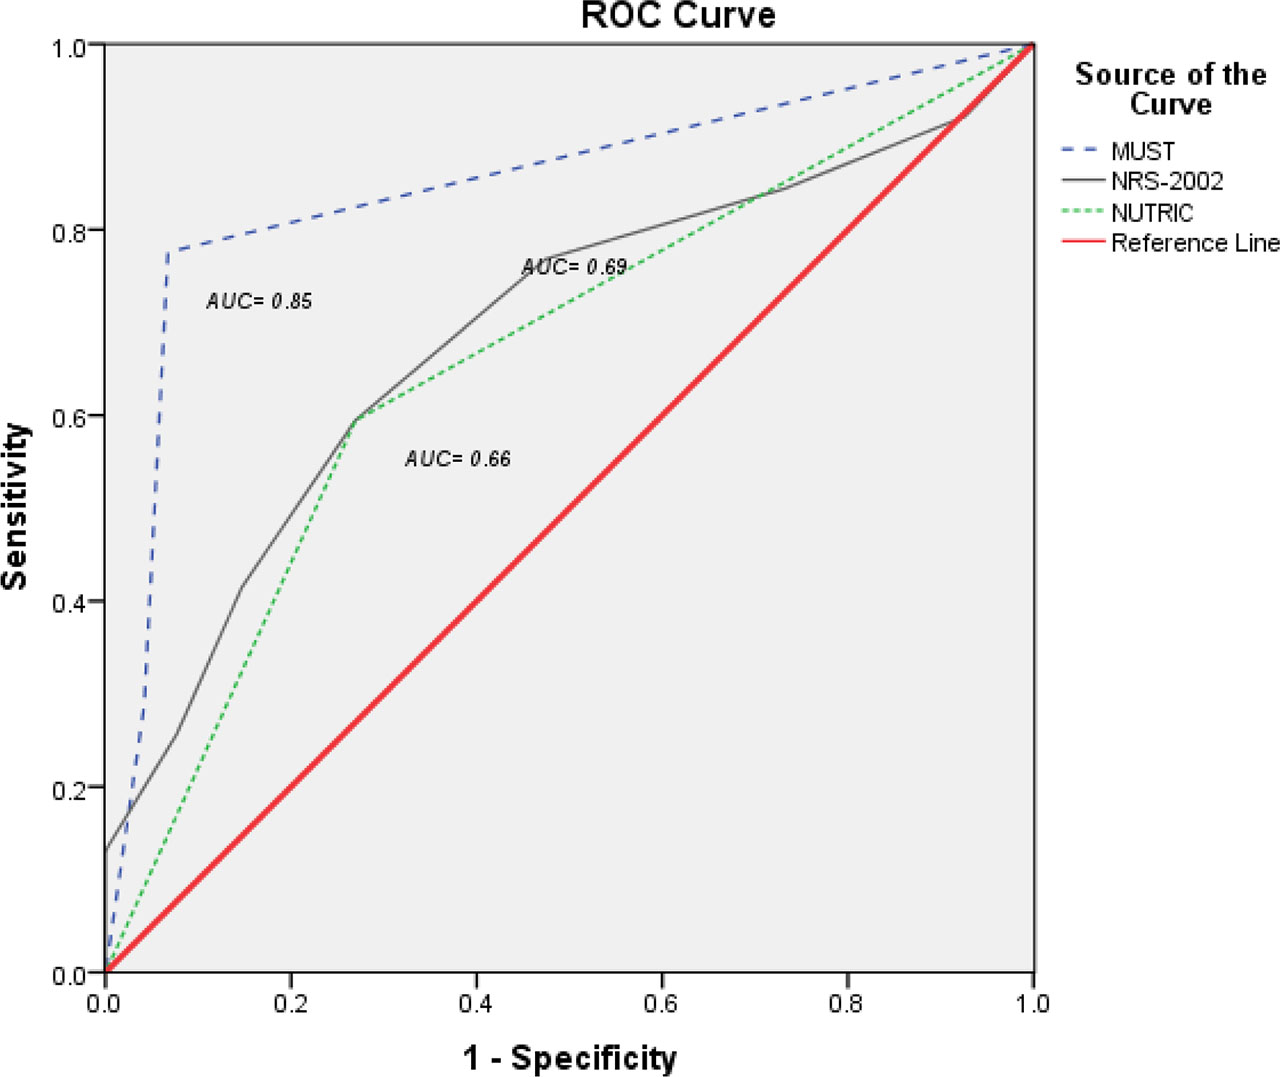
| Variable | Sensitivity | Specificity | PPV | NPV | Accuracy |
|---|---|---|---|---|---|
| NUTRIC score | 59.4% | 73.1% | 73.8% | 58.6% | 56.1% |
| MUST score | 77.6% | 93.3% | 93.6% | 76.6% | 70.4% |
| NRS-2002 | 76.8% | 90.7% | 91.3% | 75.5% | 66.1% |
[i] BMI: Body mass index, MUST: malnutrition universal screening tool, NRS: nutritional risk screening, NUTRIC: nutrition risk in critically ill, PPV: positive predictive value, NPV: negative predictive value. NUTRIC, MUST, and NRS-2002 were set as Diagnostic tests. Phase Angle was set as True/Outcome.
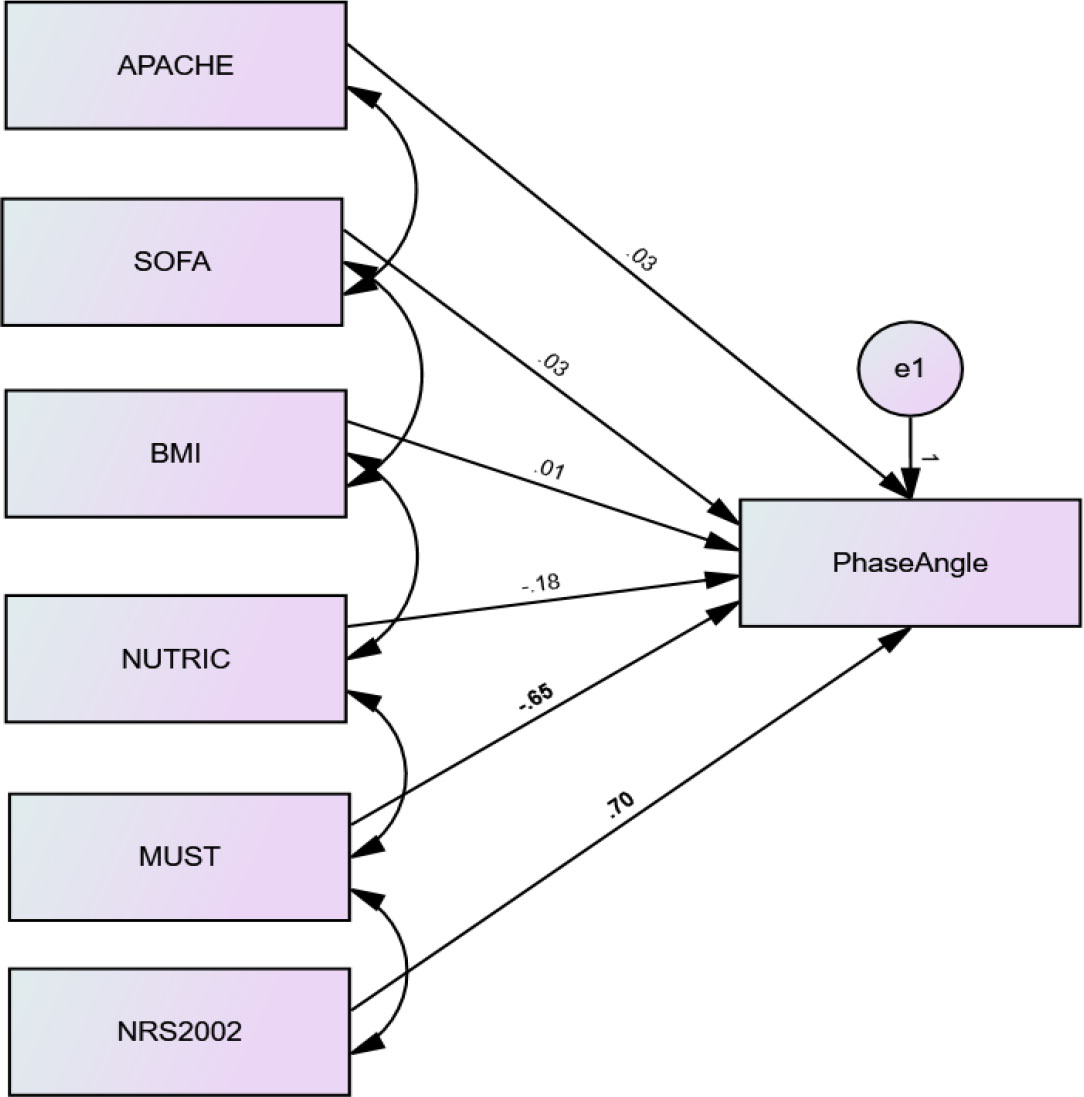
Fig. 2.
Structural equation model of relationship between observed variables (indicators) toward the PhA (dependent variable)
Table 4.
Machine-learning model to identify effective nutritional screening tools (N=709)
| Models | CC | MAE | RMSE | RAE (%) | RRSE (%) |
|---|---|---|---|---|---|
| Model 1 | 0.64 | 0.81 | 1.21 | 66.76 | 76.4 |
| Model 2 | 0.54 | 0.87 | 1.33 | 71.41 | 84.39 |
| Model 3 | 0.31 | 1.12 | 1.50 | 92.24 | 94.92 |
| Model 4 | 0.69 | 0.70 | 1.15 | 57.60 | 72.76 |
| Model 5 | 0.90 | 0.28 | 0.71 | 23.45 | 45.13 |
| Model 6 | 0.91 | 0.29 | 0.66 | 24.27 | 42.03 |
[i] CC: Correlation coefficient, MAE: Mean Absolute Error, RMSE: Root Mean Squared Error, RAE: The relative absolute error, RRSE: The root relative square error. Variables included in the models: Model 1 (APACHE II), Model 2 (SOFA), Model 3 (BMI), Model 4 (NUTRIC), Model 5 (MUST), Model 6 (NRS-2002).