
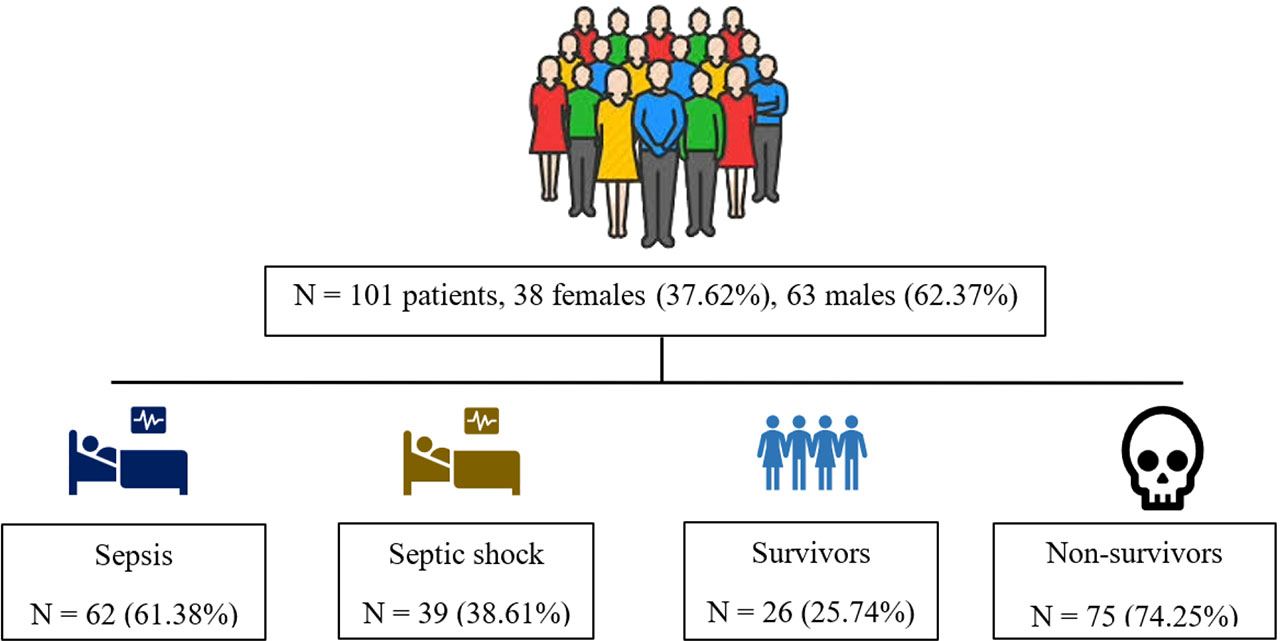
Fig. 1.
Demographics of the main studied groups
Table 1.
Comparison of the studied parameters between sepsis and septic shock patients on day 1 and day 5 (median value and interquartile range (IQR)).
| Parameter | Sepsis | pa value | Septic shock | pa value | ||
|---|---|---|---|---|---|---|
| Day 1 | Day 5 | Day 1 | Day 5 | |||
| SOFA, points | 9 (6.25) | 8 (9.25) | 0.0319 | 11 (6) | 8.5 (10.75) | 0.0314 |
| APACHE II, points | 22 (12.5) | 20 (12.25) | 0.3137 | 27 (15) | 19.5 (23) | 0.9743 |
| SAPS II, points | 60.5 (29) | 49 (30.5) | 0.0875 | 61 (39) | 44.5 (43) | 0.8909 |
| NLMR | 18.04 (31.94) | 13.16 (29.55) | 0.8141 | 33.84 (47.25) | 14.01 (22.66) | 0.7990 |
| PLR | 249.9 (269) | 204.2 (222.8) | 0.3027 | 297.7 (309.1) | 224.1 (275.3) | 0.4319 |
| Carboxyhemoglobin, % | 1.3 (0.95) | 0.9 (0.9) | 0.0944 | 1.1 (1.2) | 1 (1.1) | 0.4880 |
| Ferritin, μg/L | 393 (481.8) | 386 (759) | 0.5044 | 1180 (1250) | 521 (859) | 0.3926 |
Table 2.
Correlations of severity scores for sepsis and septic shock groups on day 1 and day 5
| Parameters | APACHE II (points) | SAPS II (points) | ||
|---|---|---|---|---|
| SOFA (points) | Sepsis | Day 1 | r = 0.6879 | r = 0.6865 |
| (95% CI: 0.529 to 0.8002) | (95% CI: 0.5271 to 0.7992) | |||
| pb <0.0001 | pb <0.0001 | |||
| Day 5 | r = 0.7559 | r = 0.7697 | ||
| (95% CI: 0.5752 to 0.8663) | (95% CI: 0.5968 to 0.8742) | |||
| pb <0.0001 | pb <0.0001 | |||
| Septic shock | Day 1 | r = 0.7966 | r = 0.6953 | |
| (95% CI: 0.6427 to 0.8888) | (95% CI: 0.4866 to 0.829) | |||
| pb <0.0001 | pb <0.0001 | |||
| Day 5 | r = 0.8393 | r = 0.8475 | ||
| (95% CI: 0.6227 to 0.9364) | (95% CI: 0.6398 to 0.9398) | |||
| pa <0.0001 | pa <0.0001 | |||
| APACHE II (points) | Sepsis | Day 1 | r = 0.8227 | |
| (95% CI: 0.7211 to 0.8896) | ||||
| pb <0.0001 | ||||
| Day 5 | r = 0.8797 | |||
| (95% CI: 0.7791 to 0.9361) | ||||
| pb <0.0001 | ||||
| Septic shock | Day 1 | r = 0.8836 | ||
| (95% CI: 0.7877 to 0.9377) | ||||
| pb <0.0001 | ||||
| Day 5 | r = 0.9575 | |||
| (0.8937 to 0.9834) | ||||
| pb <0.0001 | ||||
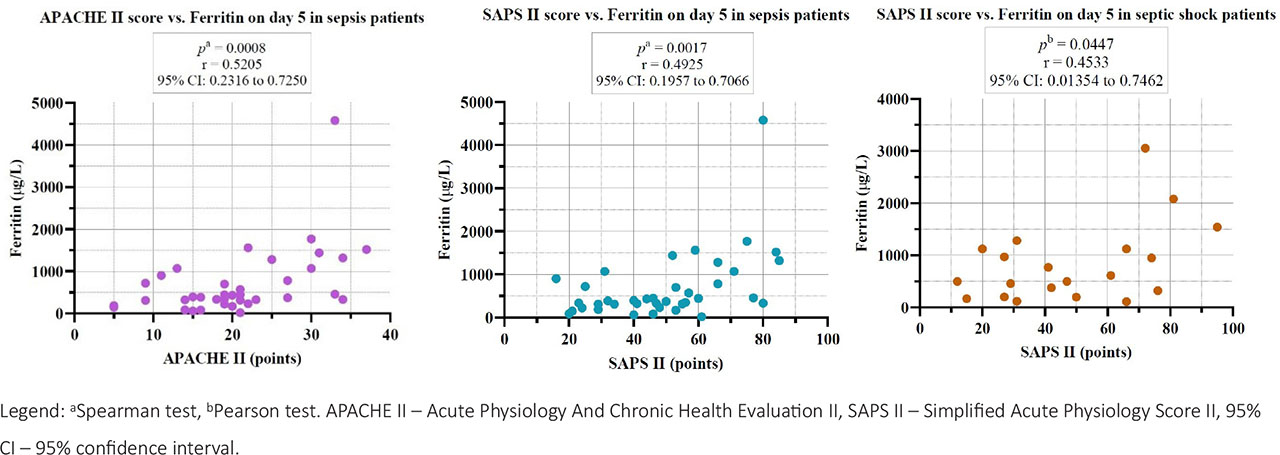
Fig. 2.
Correlations between APACHE II score and SAPS II score with Ferritin on day 5 for sepsis and septic shock groups.
Table 3.
Correlations of cellular ratios for sepsis and septic shock patients on day 1 and day 5
| Parameters | NLMR | COHb (%) | Ferritin (μg/L) | ||
|---|---|---|---|---|---|
| PLR | Sepsis | Day 1 | r = 0.3823 | r =−0.2078 | r =−0.2343 |
| (95% CI: 0.1391 to 0.582) | (95% CI:−0.4411 to 0.0517) | (95% CI:−0.4632 to 0.024) | |||
| pa = 0.0022 | pa = 0.1051 | pa = 0.0669 | |||
| Day 5 | r = 0.3949 | r =−0.1745 | r =−0.3216 | ||
| (95% CI: 0.09414 to 0.6296) | (95% CI:−0.472 to 0.1587) | (95% CI:−0.5848 to 0.00291) | |||
| pa = 0.0097 | pa = 0.2881 | pa = 0.0459 | |||
| Septic shock | Day 1 | r = 0.4856 | r =−0.2406 | r = 0.0534 | |
| (95% CI: 0.1916 to 0.6997) | (95% CI:−0.5169 to 0.08111) | (95% CI:−0.2755 to 0.3712) | |||
| pa = 0.0017 | pb = 0.1402 | pa = 0.7466 | |||
| Day 5 | r = 0.1558 | r =−0.1444 | r =−0.3063 | ||
| (95% CI:−0.3082 to 0.5599) | (95% CI:−0.5517 to 0.3184) | (95% CI:−0.6594 to 0.1576) | |||
| pa = 0.4999 | pb = 0.5435 | pb = 0.189 | |||
| NLMR | Sepsis | Day 1 | r =−0.1283 | r = 0.2989 | |
| (95% CI:−0.3729 to 0.1329) | (95% CI: 0.04561 to 0.5161) | ||||
| pa = 0.3203 | pa = 0.0183 | ||||
| Day 5 | r =−0.0445 | r = 0.3542 | |||
| (95% CI:−0.3635 to 0.2837) | (95% CI: 0.03387 to 0.6085) | ||||
| pa = 0.7877 | pa = 0.027 | ||||
| Septic shock | Day 1 | r =−0.3976 | r = 0.1028 | ||
| (95% CI:−0.6394 to −0.0842) | (95% CI:−0.229 to 0.4132) | ||||
| pa = 0.0122 | pa = 0.5333 | ||||
| Day 5 | r = 0.3455 | r = 0.05521 | |||
| (95% CI:−0.1148 to 0.6836) | (95% CI:−0.3972 to 0.4861) | ||||
| pa = 0.125 | pa = 0.8121 | ||||
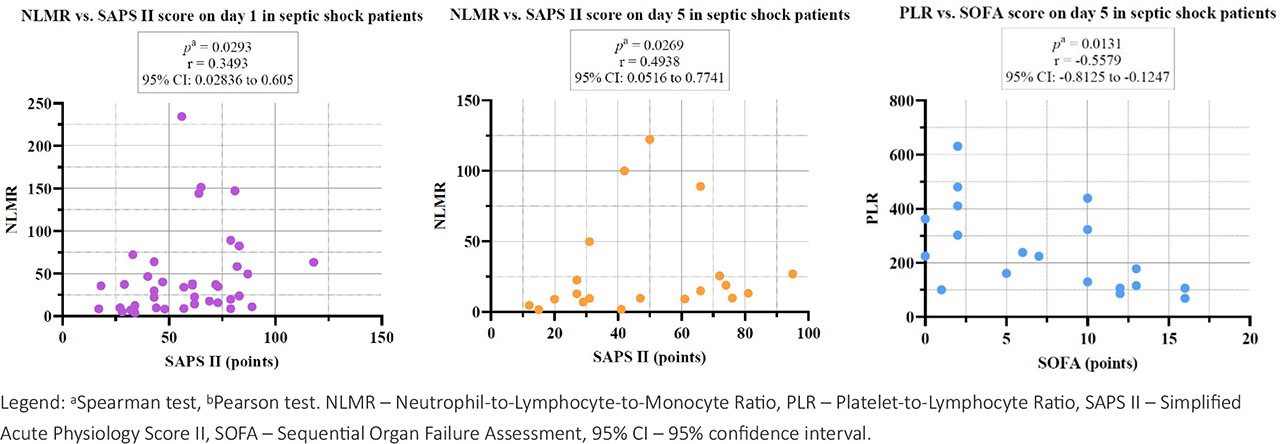
Fig. 4.
Correlations between cellular ratios and severity scores on day 1 and 5 in the septic shock group.
Table 4.
Comparison of the studied parameters between survivors and non-survivor patients on day 1 and day 5 (median value and interquartile range (IQR)).
| Parameter | Survivors | pa value | Non-survivors | pa value | ||
|---|---|---|---|---|---|---|
| Day 1 | Day 5 | Day 1 | Day 5 | |||
| SOFA, points | 6 (6) | 2 (5.75) | 0.0028 | 11 (5) | 10 (8) | 0.0795 |
| APACHE II, points | 14 (11.5) | 10.5 (10.75) | 0.0942 | 27 (12) | 22.5 (16) | 0.9814 |
| SAPS II, points | 36 (28.5) | 28 (16) | 0.0335 | 65 (26) | 54 (29) | 0.6534 |
| NLMR | 11.22 (23.54) | 9.722 (19.41) | 0.8906 | 23.74 (48.65) | 14.88 (28.28) | 0.5236 |
| PLR | 257 (286.7) | 224.8 (308.5) | 0.8906 | 283.2 (304.9) | 185.7 (207.7) | 0.1091 |
| Carboxyhemoglobin, % | 1.35 (1.42) | 1 (0.95) | 0.1134 | 1.1 (1.1) | 0.9 (0.875) | 0.9928 |
| Ferritin, μg/L | 393.5 (714.3) | 341.5 (548.7) | 0.5958 | 666 (1296) | 458.5 (867) | 0.9113 |
Table 5.
Correlations of severity scores for survivors and non-survivors on day 1 and day 5
| Parameters | APACHE II (points) | SAPS II (points) | ||
|---|---|---|---|---|
| SOFA (points) | Survivors | Day 1 | r = 0.6478 | r = 0.6398 |
| (95% CI: 0.3371 to 0.8313) | (95% CI: 0.3356 to 0.8231) | |||
| pa = 0.0003 | pb = 0.0004 | |||
| Day 5 | r = 0.8628 | r = 0.7807 | ||
| (95% CI: 0.6320 to 0.9530) | (95% CI: 0.4523 to 0.9227) | |||
| pa <0.0001 | pa = 0.0005 | |||
| Non-survivors | Day 1 | r = 0.6273 | r = 0.5823 | |
| (95% CI: 0.4655 to 0.7485) | (95% CI: 0.4081 to 0.7156) | |||
| pb <0.0001 | pb <0.0001 | |||
| Day 5 | r = 0.7256 | r = 0.6918 | ||
| (95% CI: 0.5409 to 0.8435) | (95% CI: 0.4911 to 0.8227) | |||
| pb <0.0001 | pb <0.0001 | |||
| APACHE II (points) | Survivors | Day 1 | r = 0.7618 | |
| (95% CI: 0.5226 to 0.8899) | ||||
| pa <0.0001 | ||||
| Day 5 | r = 0.6086 | |||
| (95% CI: 0.1461 to 0.8528) | ||||
| pa = 0.014 | ||||
| Non-survivors | Day 1 | r = 0.818 | ||
| (95% CI: 0.7258 to 0.8814) | ||||
| pb <0.0001 | ||||
| Day 5 | r = 0.9224 | |||
| (95% CI: 0.8569 to 0.9586) | ||||
| pa <0.0001 | ||||
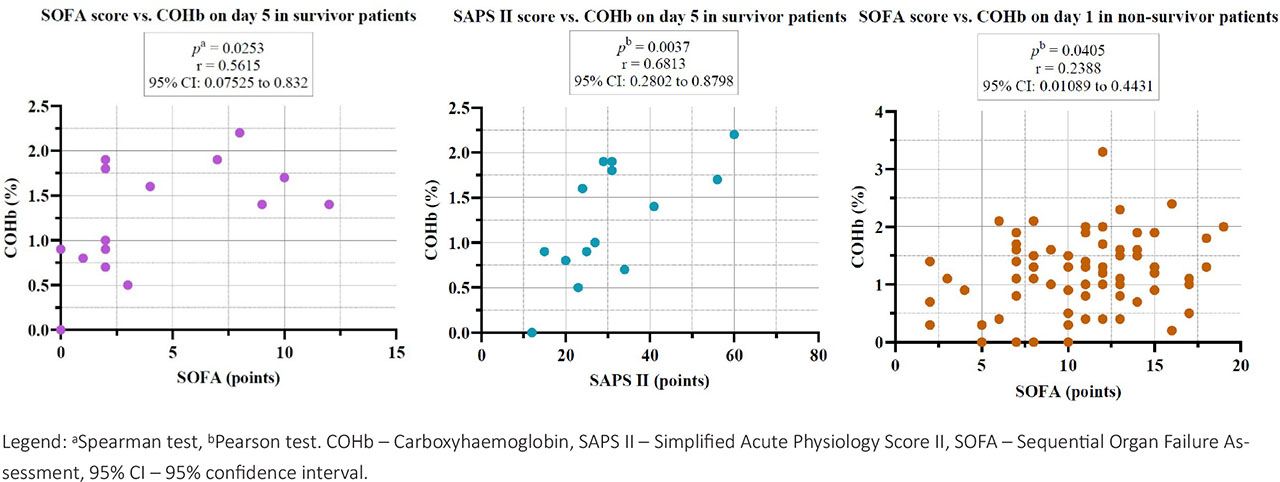
Fig. 5.
Correlations between severity scores and COHb on day 1 and day 5 in the survivor and non-survivor groups.
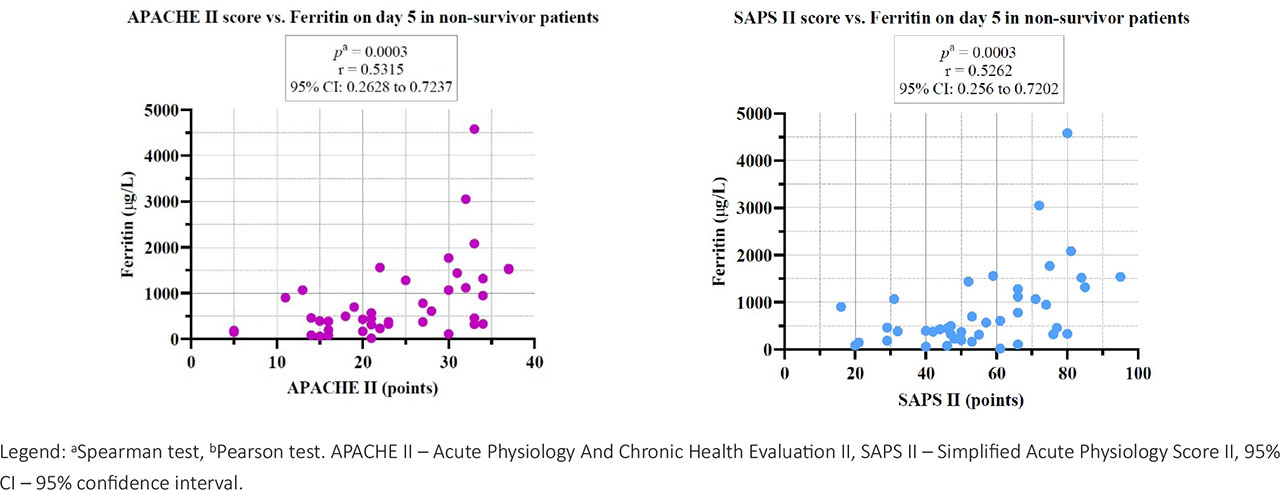
Fig. 6.
Correlations between severity scores and ferritin on day 5 in the non-survivor group.
Table 6.
Correlations of cellular ratios for survivor and non-survivor patients on day 1 and day 5
| Parameters | NLMR | COHb (%) | Ferritin (μg/L) | ||
|---|---|---|---|---|---|
| PLR | Survivors | Day 1 | r = 0.4099 | r = −0.2135 | r = −0.1768 |
| (95% CI: 0.01474 to 0.6943) | (95% CI: −0.5633 to 0.2011) | (95% CI: −0.5366 to 0.2375) | |||
| pa = 0.0375 | pa = 0.2949 | pa = 0.3877 | |||
| Day 5 | r = 0.6351 | r = −0.0295 | r = 0.1517 | ||
| (95% CI: 0.2406 to 0.8495) | (95% CI: −0.4897 to 0.4434) | (95% CI: −0.3524 to 0.5875) | |||
| pa = 0.0035 | pb = 0.9072 | pa = 0.5479 | |||
| Non-survivors | Day 1 | r = 0.4255 | r = −0.3133 | r = −0.07673 | |
| (95% CI: 0.2133 to 0.5994) | (95% CI: −0.5095 to −0.08616) | (95% CI: −0.3047 to 0.1596) | |||
| pa = 0.0001 | pa = 0.0062 | pa = 0.5129 | |||
| Day 5 | r = 0.1619 | r = −0.1762 | r = −0.4354 | ||
| (95% CI: −0.1507 to 0.445) | (95% CI: −0.4664 to 0.1481) | (95% CI: −0.6606 to −0.1383) | |||
| pa = 0.2938 | pa = 0.2704 | pa = 0.0044 | |||
| NLMR | Survivors | Day 1 | r = −0.1283 | r = 0.1275 | |
| (95% CI: −0.3729 to 0.1329) | (95% CI: −0.2845 to 0.4998) | ||||
| pa = 0.3203 | pa = 0.5347 | ||||
| Day 5 | r = −0.0445 | r = 0.3168 | |||
| (95% CI: −0.3635 to 0.2837) | (95% CI: −0.1906 to 0.6906) | ||||
| pa = 0.7877 | pa = 0.2002 | ||||
| Non-survivors | Day 1 | r = −0.1951 | r = 0.2358 | ||
| (95% CI: −0.4099 to 0.04015) | (95% CI: 0.002498 to 0.4447) | ||||
| pa = 0.0935 | pa = 0.0417 | ||||
| Day 5 | r = 0.1046 | r = 0.1733 | |||
| (95% CI: −0.2148 to 0.4037) | (95% CI: −0.147 to 0.4607) | ||||
| pa = 0.5099 | pa = 0.2723 | ||||
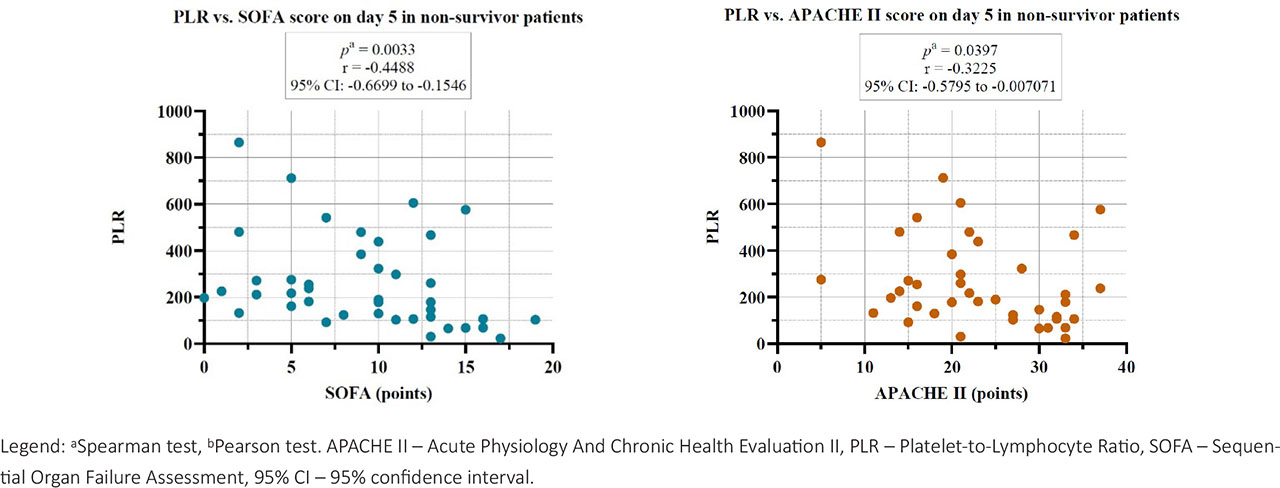
Fig. 7.
Correlations between PLR and severity scores on day 5 in the non-survivor group.
Table 7.
Patient classification according to ferritin value, with lowest and highest value for each subgroup
| Intervals (μg/L) | Sepsis (N = 62; 41) | Septic shock (N = 39; 21) | Survivors (N = 26; 20) | Non-survivors (N = 75; 42) | Reference interval | |
|---|---|---|---|---|---|---|
| Day 1 | 0–20 | 2 (9.53 μg/L) | 0 | 0 | 2 (9.53 μg/L) | 20–290 μg/L |
| 21–100 | 5 | 2 (54.9 μg/L) | 2 (44.3 μg/L) | 5 | ||
| 101–200 | 6 | 4 | 1 | 9 | ||
| 201–290 | 6 | 1 | 3 | 4 | ||
| > 291 | 45 (6220 μg/L) | 32 (7300 μg/L) | 20 (2700 μg/L) | 55 (7300 μg/L) | ||
| Day 5 | 0–20 | 1 (20.6 μg/L) | 0 | 0 | 1 (20.6 μg/L) | |
| 21–100 | 3 | 0 | 0 | 3 | ||
| 101–200 | 5 | 5 (110 μg/L) | 5 (111 μg/L) | 5 | ||
| 201–290 | 2 | 0 | 1 | 1 | ||
| > 291 | 30 (4580 μg/L) | 16 (3050 μg/L) | 14 (2720 μg/L) | 32 (4580 μg/L) | ||
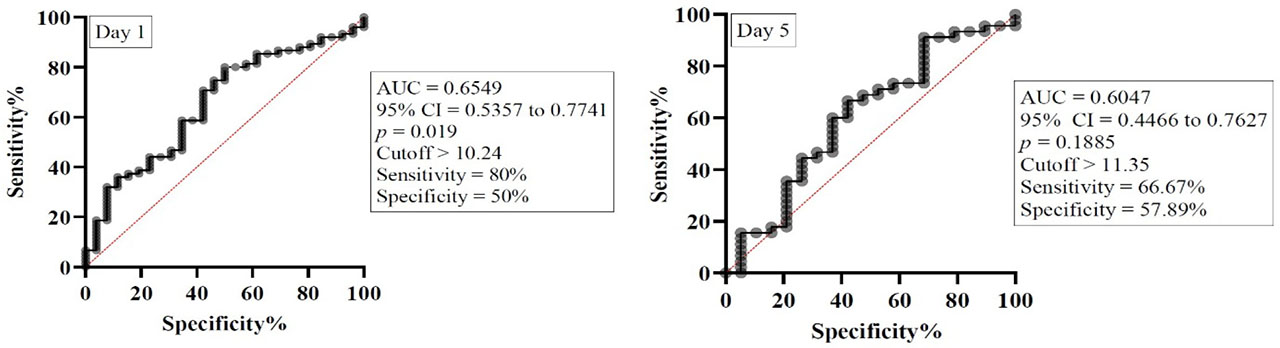
Fig. 8.
ROC curve for NLMR on day 1 and day 5. Legend: AUC – Area under curve, 95% CI – 95% confidence interval.
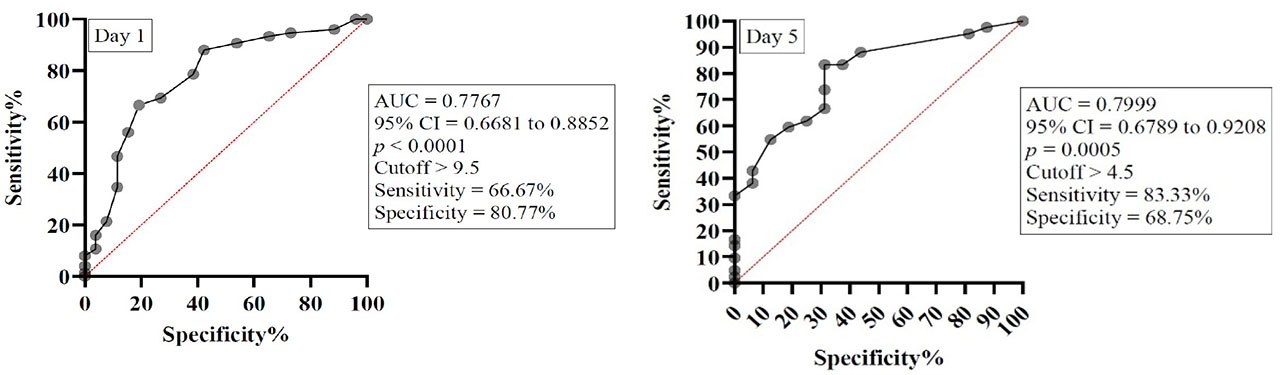
Fig. 9.
ROC curve for SOFA score on day 1 and day 5. Legend: AUC – Area under curve, 95% CI – 95% confidence interval.
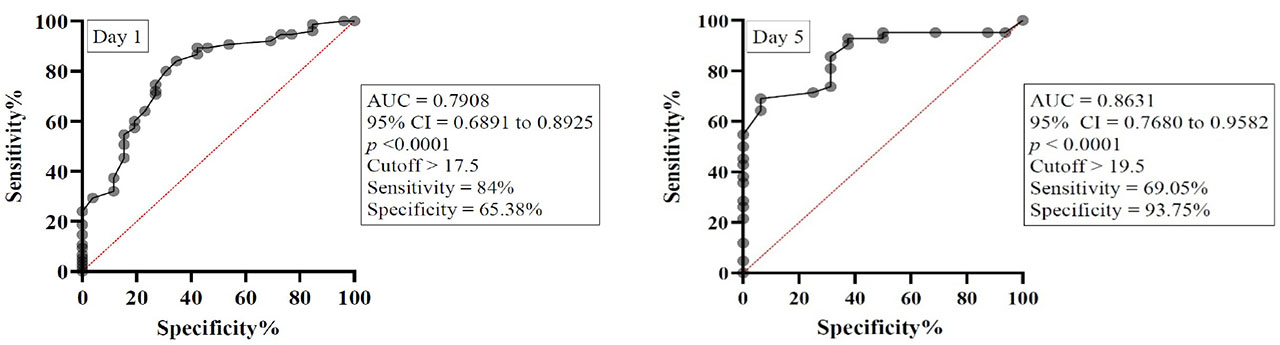
Fig. 10.
ROC curve for APACHE II score on day 1 and day 5. Legend: AUC – Area under curve, 95% CI – 95% confidence interval.
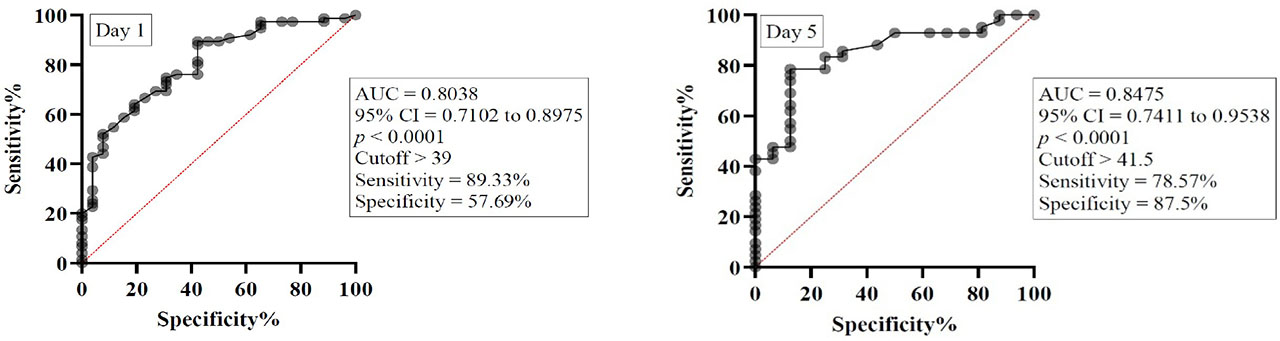
Fig. 11.
ROC curve for SAPS II score on day 1 and day 5. AUC – Area under curve, 95% CI – 95% confidence interval.