
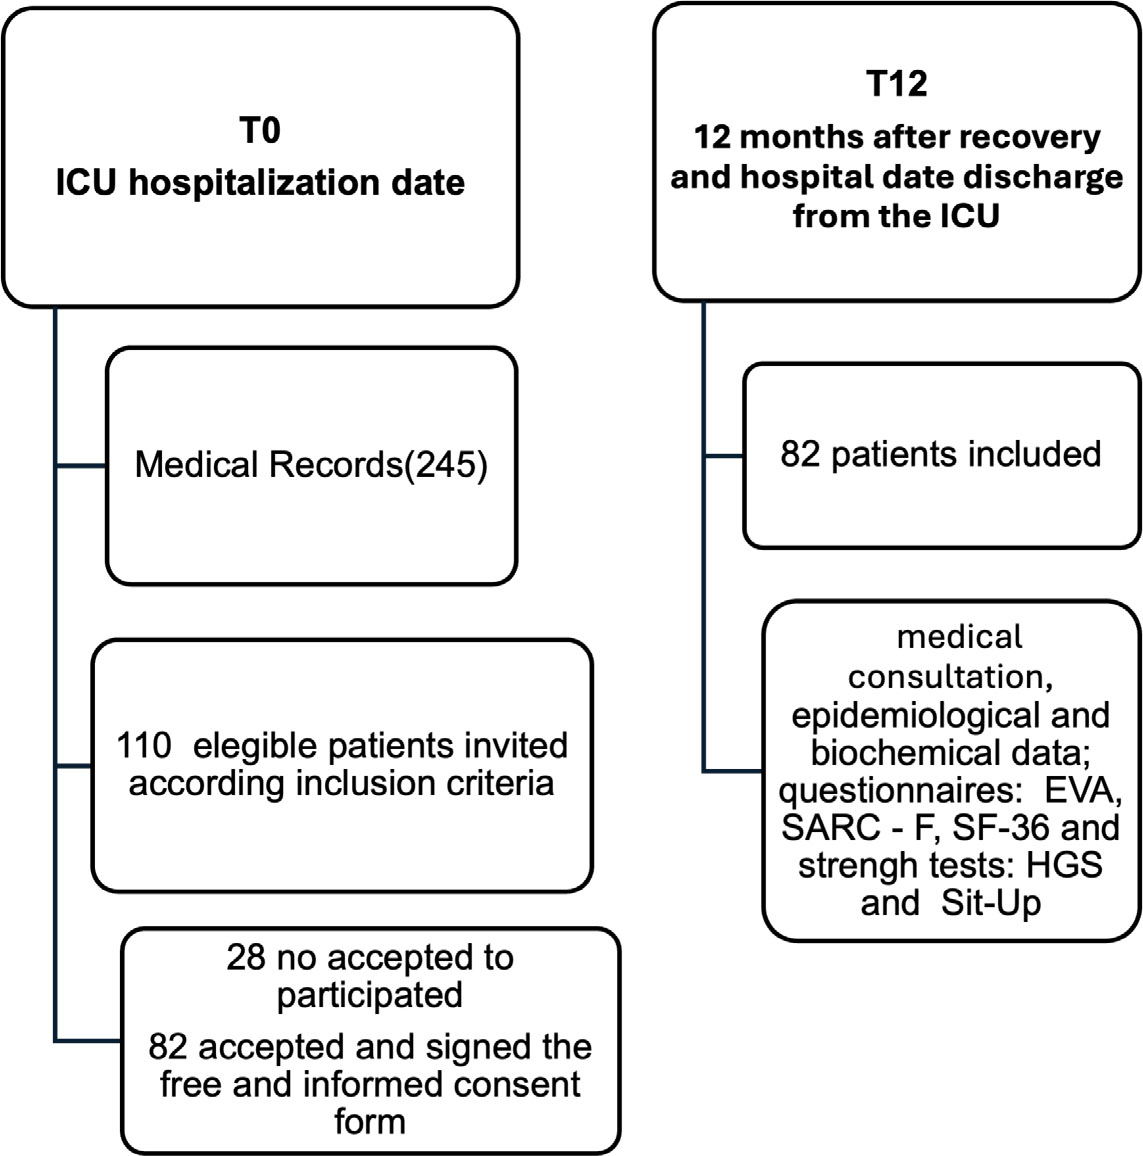
Fig. 1.
Study design At T0 (ICU admission), 245 medical records were screened, resulting in 110 eligible participants, of which 28 no accepted to participate and 82 were included with complete data. At T12 (12 months after ICU discharge)
Table 1.
Epidemiological and clinical data of the severely ill individuals eligible for the study at the time of infection (T0) (n = 82)
| Variables | n = 82 |
|---|---|
| Age (years) | 52 ±12 |
| Gender (male) | 75 (90%) |
| Race (white) | 72 (87%) |
| BMI (Kg/m2) | 31 (22–55) |
| ≥18,5 ate 24,9 Kg/m2 | 9 (11%) |
| ≥25 ate 29,9 kg/m | 27 (33%) |
| ≥30 kg/m2 | 46 (56%) |
| Hospitalization in the ICU (days) | 9 ± 8 |
| Hypertension (%) | 38 (46%) |
| Diabetes Mellitus (%) | 26 (31%) |
| Cardiovascular disease (%) | 5 (6%) |
| Ventilatory support (%) | 15 (18%) |
| Drug Vasoactive use (%) | 20 (24%) |
| Vacination (Doses) (%) | 6 (7%) |
| 0–1 doses | 76 (93%) |
| ≥ 2 doses | |
| Acute kidney disease (%) | 16 (20%) |
| Hemodialysis | 8 (10%) |
Table 2.
Biochemical data of the survivors’ patients with severe COVID-19 at T0 (date of ICU admission) and 12 months (T12) after ICU discharge
| Variables | T0 | T12 | p |
|---|---|---|---|
| Creatinine (mg/dL) | 1.10 ± 0.47 | 1.12 ± 0.24 | 0.67 |
| Urea (mg/dL) | 39 ± 18 | 41 ± 12 | 0.31 |
| Sodium (Na) (mmol/L) | 137 ± 3 | 141 ± 3 | < 0.001 |
| Potassium (K) (mmol/L) | 3.9 ± 0.6 | 4.4 ± 0.4 | < 0.001 |
| Glucose (mg/dL) | 124 ± 36 | 117 ± 42 | < 0.001 |
| Albumin (g/dL) | 2.5 ± 0.6 | 4.5 ± 0.3 | < 0.001 |
| eGFR (mL/min) (n/%) | 83 ± 23 | 78 ± 18 | 0.07 |
| eGFR ≤ 59 (mL/min) (n/%) | 12/14% | 13/16% | 0.98 |
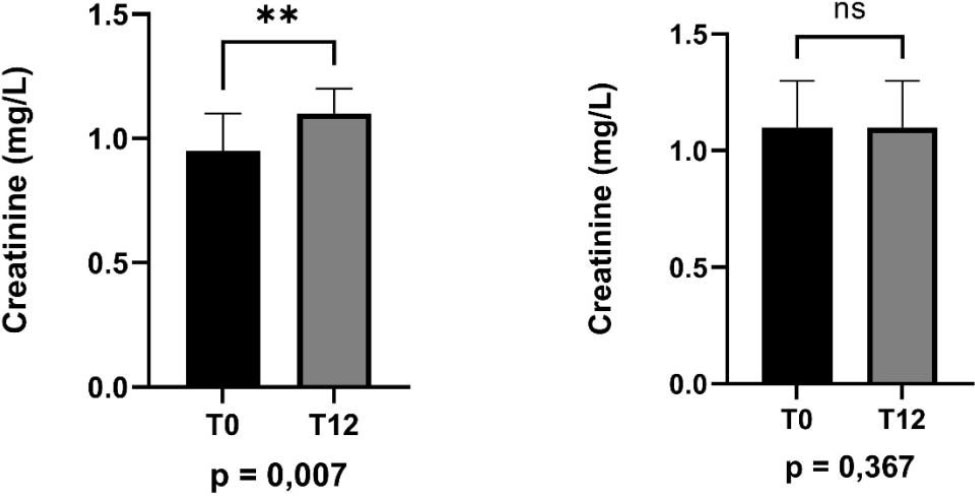
Fig.2.
Variation in serum creatinine (mg/dL) in patients with and without comorbidities (hypertension, diabetes, and AKI) between T0 and T12.
Table 3.
Laboratory parameters at T0 and T12 excluding patients with diabetes, systemic arterial hypertension, chronic kidney disease and acute renal failure (n = 49)
| Variables | T0 | T12 | p |
|---|---|---|---|
| Creatinine (mg/dL) | 0.95 ± 0.2 | 1.10 ± 0.2 | 0.007 |
| Urea (mg/dL) | 37 ± 15 | 40 ± 13 | 0.343 |
| Sodium (Na) (mmol/L) | 137 ± 3 | 141 ± 3 | < 0.001 |
| Potassium (k) (mmol/L) | 4.00 ± 0.6 | 4.36 ± 0.4 | 0.032 |
| Glucose (mg/dL) | 113 ± 20 | 103 ± 14 | 0.007 |
| Albumin (g/dL) | 2.6 ± 0.6 | 4.6 ± 0.4 | < 0.001 |
| eGFR (mL/min) (n/%) | 87 ± 22 | 77 ± 18 | 0.001 |
Table 4.
SF36 quality of life assessment (SF36 - functional capacity and pain), pain scale (EVA), functional capacity (DASI), muscle strength - dominant handgrip strength (FPP D) and 30-second sit-to-stand test and risk of sarcopenia (SARC - F), 12 months after the date of recovery from COVID 19 (n = 82)
| Variables | T12 |
|---|---|
| Quality of live | |
| SF36 – Funcional Capacity | 47 ± 21 |
| SF36 – Pain | 47 ± 18 |
| Pain Scale | |
| Visual Analog Scale - 5 (n/%) | 47 / 57% |
| Muscle Strenght | |
| Handgrip Strenght (kgf) | 18 ± 6 |
| The 30-second sit-to-stand test | 8 ± 5 |
| Functional Capacity | |
| Duke Activity Status Index (score) | 44 ± 11 |
| Risk of Sarcopenia | |
| SARC – F (escore ≥ 4)(n/%) | 37 / 46% |
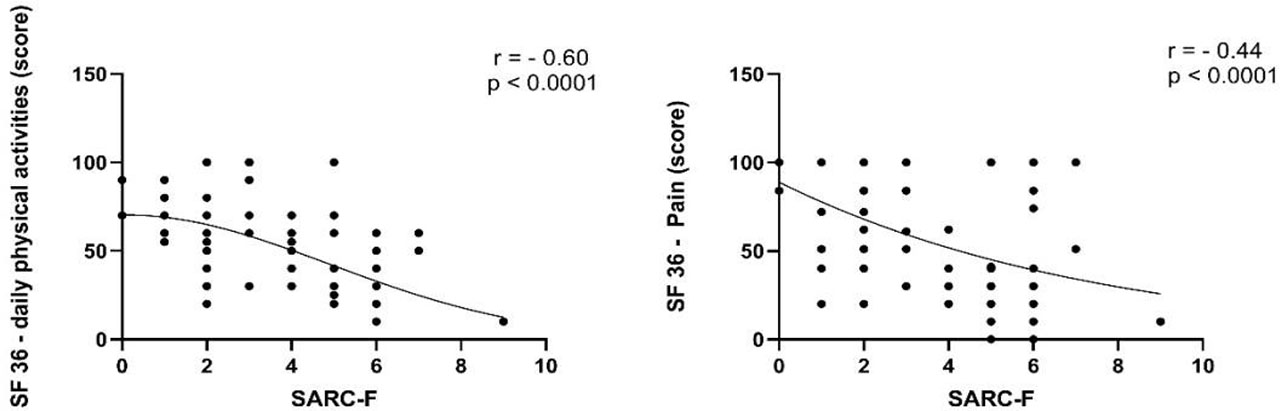
Fig. 3.
Correlation between sarcopenia risk score (SARC-F) and low Daily Functional capacity score (SF36) (T12) and correlation between score sarcopenia risk score (SARC-F) and pain score (SF36) (T12).