
Table 1.
Patient Characteristics (n=269)
| Characteristics | Frequency | Percentage | Mean ± SD | |
|---|---|---|---|---|
| Gender | Male | 112 | 41.6 | |
| Female | 157 | 58.4 | ||
| Age group (years) | 18 to 40 | 39 | 14.5 | 59.5 ± 16.7 |
| 41 to 60 | 98 | 36.4 | ||
| 61 to 80 | 104 | 38.7 | ||
| 80 and above | 28 | 10.4 | ||
| BMI (kg/m2) | 23.9 ± 3.5 | |||
| Comorbidity | Hypertension | 119 | 44.3 | |
| Diabetes mellitus | 55 | 20.5 | ||
| Respiratory disease | 7 | 2.6 | ||
| Cancer | 5 | 1.9 | ||
| Oxygen therapy | Nasal cannula | 143 | 53.2 | |
| Invasive mechanical ventilation | 58 | 21.6 | ||
| HFNC | 49 | 18.2 | ||
| Mask | 19 | 7.1 | ||
| Treatment Outcome | Mortality | 53 | 19.7 | |
| Survival | 216 | 80.3 |
Table 2.
Association of Age and Sex with Mortality in COVID-19 Patients
| Characteristics | Mortality (n=53) | Survival (n=216) | p-value (*) |
|---|---|---|---|
| Sex | |||
| Male | 27 (24.1%) | 85 (75.9%) | 0.125 |
| Female | 26 (16.6%) | 131 (83.4%) | |
| Age group | |||
| Ages 18 to 40 | 2 (5.1%) | 37 (94.9%) | 0.01 |
| Ages 41 to 60 | 16 (16.3%) | 82 (83.7%) | |
| Ages 61 to 80 | 27 (25.9%) | 77 (74.1%) | |
| Over 80 | 8 (28.6%) | 20 (71.4%) | |
Table 3.
Admission Biomarkers in Survivors and Non-survivors with COVID-19
| Admission Biomarkers | Survival (n=216) | Mortality (n=53) | Both (n=269) | p-value (*) |
|---|---|---|---|---|
| Median [25th–75th percentile] | ||||
| Complete Blood Count | ||||
| Platelet Count (109/L) | 248.5 [182.5–334.5] | 196 [147–277] | 236 [171–318] | 0.0076 |
| White Blood Cells (109/L) | 7.87 [5.3–10.61] | 11.68 [6.8–16.2] | 8.19 [5.41–11.7] | <0.0001 |
| Neutrophils (109/L) | 3.5 [2.6–5.8] | 6.8 [3.5–12.1] | 3.8 [3.1–6.5] | <0.0001 |
| Lymphocytes (109/L) | 0.92 [0.63–1.35] | 0.7 [0.41–0.98] | 0.88 [0.59–1.28] | 0.0003 |
| Hemoglobin (g/dL) | 13.8 [10.2–16] | 12 [9–15.2] | 13.8 [10.2–16] | 0.026 |
| Biochemical Parameters | ||||
| Creatinine (mg/dL) | 0.67 [0.6–1] | 0.67 [0.6–1] | 0.67 [0.6–1] | 0.624 |
| AST (U/L) | 29 [28–70] | 28 [26–47] | 29 [28–70] | 0.01 |
| ALT (U/L) | 31 [30–72.5] | 30 [28–50] | 31 [29–72] | 0.01 |
| Coagulation | ||||
| D-dimer (μg/mL) | 0.93 [0.47–1.86] | 4.48 [1.58–9.20] | 1.12 [0.55–3.79] | <0.0001 |
| PT (seconds) | 14.1 [12.9–14.7] | 13.2 [12.9–14.6] | 13.8 [12.9–14.7] | 0.012 |
| aPTT (seconds) | 30.6 [26.7–33] | 30.5 [28.3–33] | 30.5 [26.7–33] | 0.238 |
| Fibrinogen (g/L) | 3.1[2.12–3.8] | 2.5 [1.81–3.8] | 3.06 [2.12–3.8] | 0.03 |
Table 4.
Logistic Regression Analysis of Admission Biomarkers Associated with Mortality in COVID-19 Patients
| Admission Biomarkers | OR | 95% CI | p-value (*) |
|---|---|---|---|
| D-dimer (μg/mL) | 1.05 | 1.02 – 1.09 | 0.001 |
| Creatinine (mg/dL) | 0.95 | 0.22 – 4.05 | 0.946 |
| AST (U/L) | 1.00 | 0.98 – 1.01 | 0.551 |
| WBC (109/L) | 1.04 | 0.90 – 1.18 | 0.598 |
| Neutrophils (109/L) | 1.32 | 1.10 – 1.63 | 0.005 |
| Lymphocytes (109/L) | 0.51 | 0.26 – 0.92 | 0.033 |
| Platelets (109/L) | 1.00 | 0.99 – 1.00 | 0.253 |
| Hemoglobin (g/dL) | 0.85 | 0.75 – 0.97 | 0.015 |
| PT (seconds) | 0.93 | 0.75 – 1.13 | 0.468 |
| aPTT (seconds) | 0.95 | 0.86 – 1.05 | 0.317 |
| Fibrinogen (g/L) | 0.69 | 0.48 – 0.99 | 0.049 |
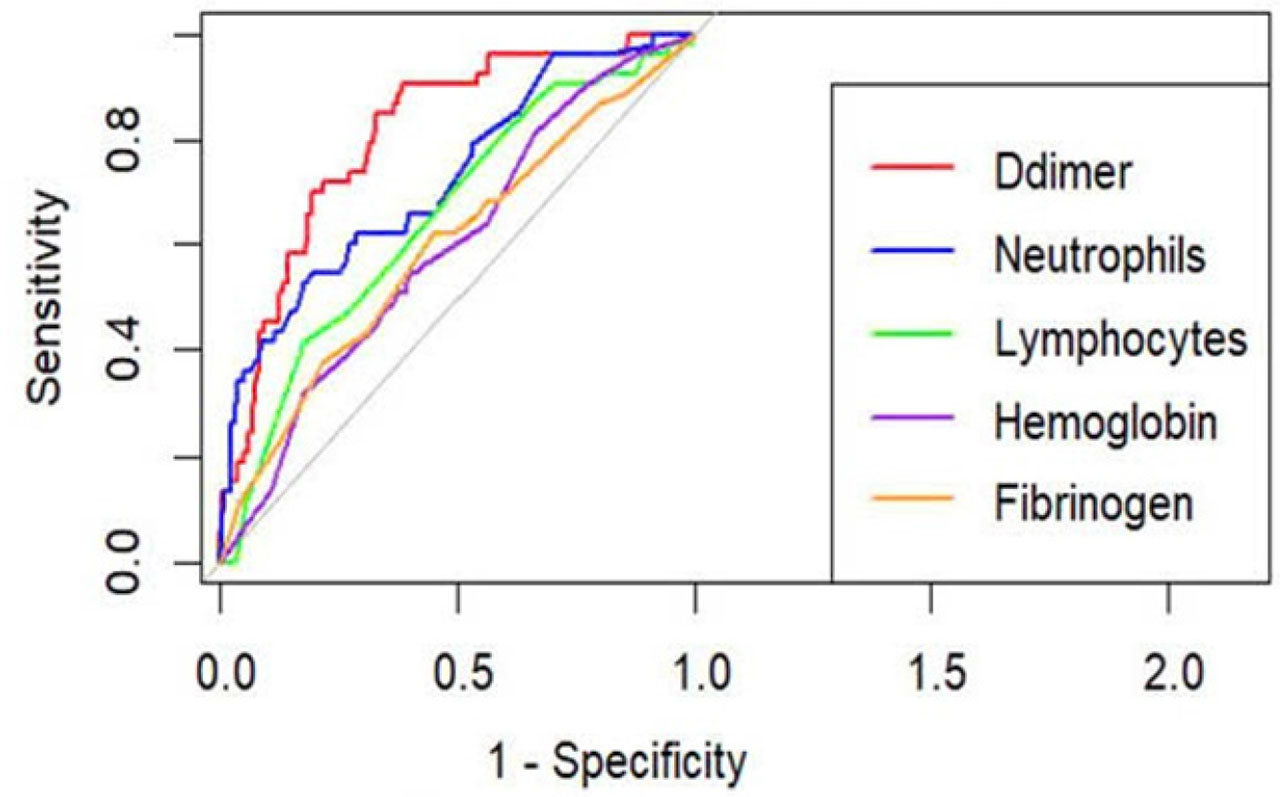
Fig 1.
ROC Curves for D-dimer, Neutrophils, and Other Biomarkers in Predicting Mortality among COVID-19 Patients