
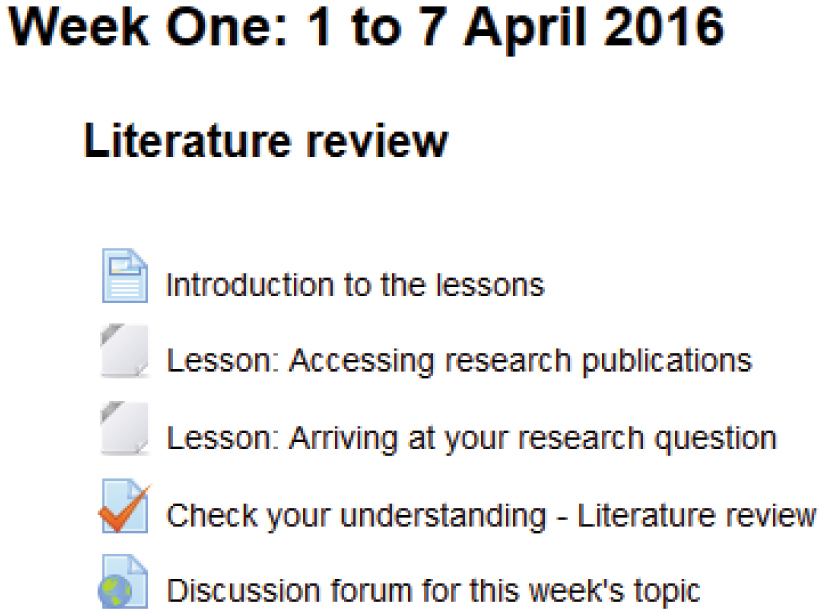
Figure 1
Screenshot of a key topic in the course
Table 1
Actual learners and completion rates
| Course | No. of actual learners (% women) | % of course completers (% women) | No. of developing countries represented by the completers (women) |
|---|---|---|---|
| MOOC #1 | 1275 (45%) | 47% (49%) | 51 (40) |
| MOOC #2 | 1555 (46%) | 58% (61%) | 52 (42) |
Table 2
Contingency table for gender and course completion (both the MOOCs combined)
| Gender | Participants who did not complete the course | Participants who completed the course |
|---|---|---|
| Female | 571 | 712 |
| Male | 761 | 786 |
Table 3
Contingency table for forum posts and course completion (both the MOOCs combined)
| No. of forum posts | Participants who did not complete the course | Participants who completed the course |
|---|---|---|
| Zero | 1157 | 665 |
| One or more | 175 | 833 |
Table 4
Count of forum posts (both the MOOCs combined)
| Course | No. of guest facilitators (% women) | No. of countries represented by guest facilitators (women) | No. of guest facilitators’ posts (% women) | No. of learners’ posts (% women) | Ratio of learners’ to guest facilitators’ posts |
|---|---|---|---|---|---|
| MOOC #1 | 18 (39%) | 13 (7) | 796 (22%) | 4002 (44%) | 5.03 |
| MOOC #2 | 20 (50%) | 16 (8) | 1073 (45%) | 5454 (39%) | 5.08 |