
Table 1
Demographic Characteristics of Online Instructors.
| n | % | |
|---|---|---|
| Gender | ||
| Male | 183 | 46.7 |
| Female | 209 | 53.3 |
| Age | ||
| 25–35 | 47 | 12 |
| 36–50 | 204 | 52 |
| 51 and above | 141 | 36 |
| Teaching Level | ||
| Bachelor’s degree | 67 | 17.1 |
| Undergraduate | 321 | 81.9 |
| Graduate | 4 | 1.0 |
| Discipline of Instructors | ||
| Engineering | 190 | 48.5 |
| Health | 136 | 34.7 |
| Social Science | 66 | 16.8 |
| Used Online Teaching Platforms | ||
| Zoom | 300 | 76.5 |
| Google Meet | 144 | 36.7 |
| BigBlueButton | 20 | 5.1 |
| Microsoft Teams | 18 | 4.6 |
| Canvas | 179 | 45.7 |
| Google Classroom | 52 | 13.3 |
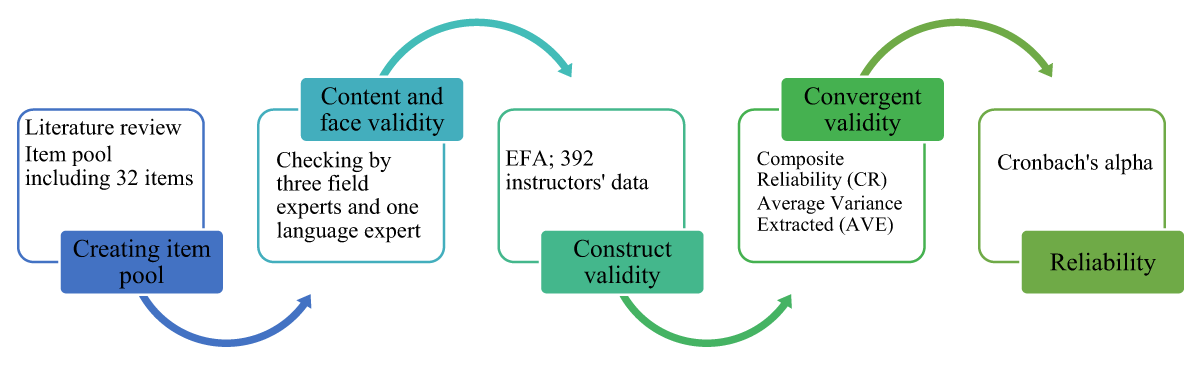
Figure 1
The development and validation process of the scale.
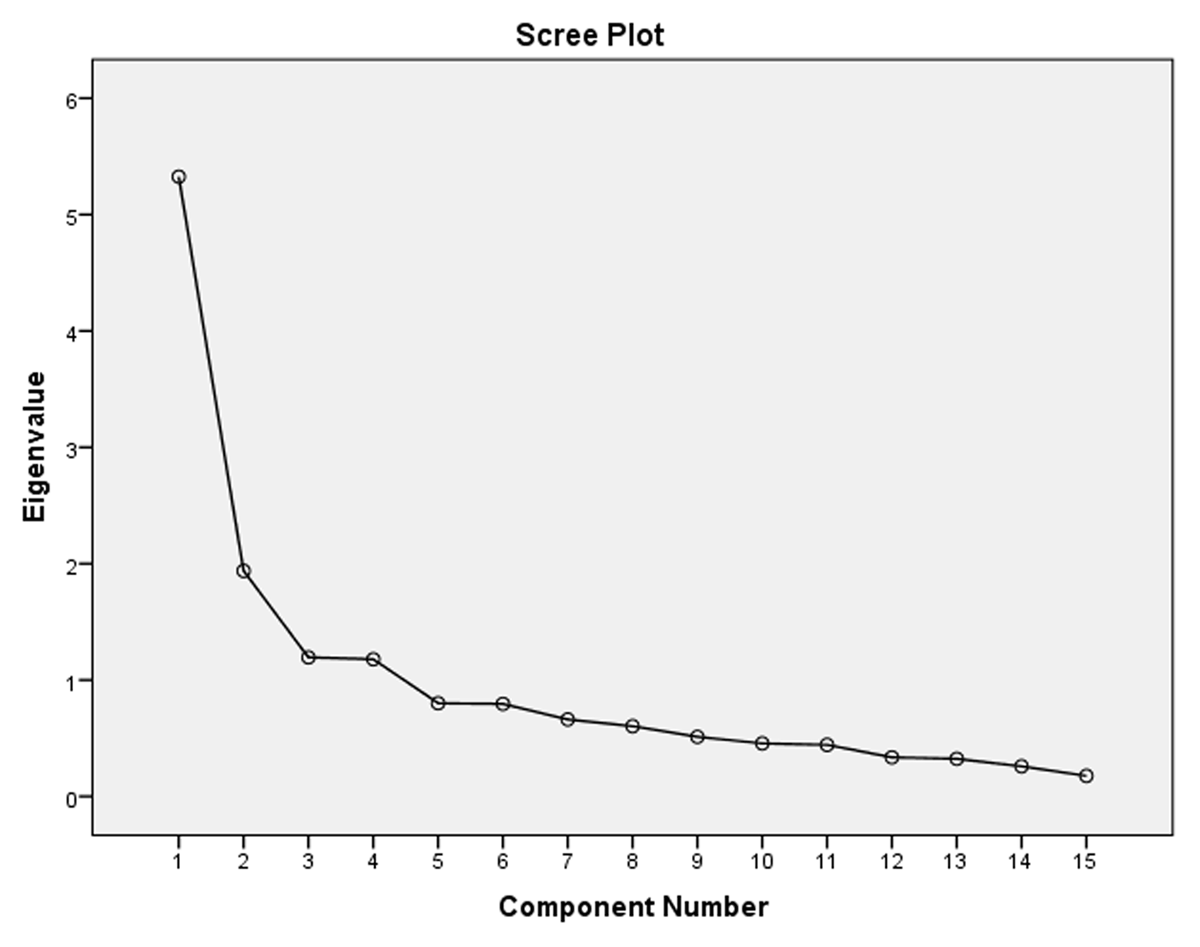
Figure 2
Scree Plot Graph.
Table 2
Standardized Factor Loads, Explained Variance, and Reliabilities of the Scale.
| ITEMS | COMMUNALITIES | f1 | f2 | f3 | f4 | |
|---|---|---|---|---|---|---|
| Pedagogy | ||||||
| 27 | I clearly state the learning objectives of the course. | .779 | .942 | |||
| 26 | I clearly state the topics of the course. | .750 | .931 | |||
| 28 | I make the preparations for the course before the live sessions. | .677 | .787 | |||
| 24 | I attend live sessions enthusiastically. | .564 | .731 | |||
| 29 | I use teaching methods and techniques that will enable students to participate in live sessions. | .530 | .449 | |||
| Facilitation | ||||||
| 32 | I support students to build and maintain a learning community. | .758 | .963 | |||
| 33 | I help students develop a positive attitude towards online learning. | .664 | .803 | |||
| 31 | I enable students to establish online learning community relationships with me and each other. | .661 | .727 | |||
| Technology | ||||||
| 11 | I effectively use the hardware tools (computer, tablet, camera, etc.) required by online education. | .774 | .882 | |||
| 12 | I effectively use software tools required by online education. | .756 | .831 | |||
| 20 | I solve the problems that I encounter while using online education tools myself | .460 | .750 | |||
| Course Administration | ||||||
| 16 | I organize my courses in a modular (weekly, topic, etc.) structure in LMS. | .631 | .840 | |||
| 14 | I effectively use discussion forums in LMS. | .661 | .819 | |||
| 13 | I effectively use the existing components (homework, calendar, etc.) of the LMS. | .517 | .530 | |||
| 10 | I organize activities that will increase communication and interaction in LMS. | .454 | .456 | |||
| Eiegen Values | 5.33 | 1.94 | 1.20 | 1.18 | ||
| Explained total variance (Total = %64.244) | %35.50 | %12.92 | %7.96 | %7.86 | ||
| Cronbach’s alpha α = .834 | α = .832 | α = .772 | α = .702 | α = .680 | ||