
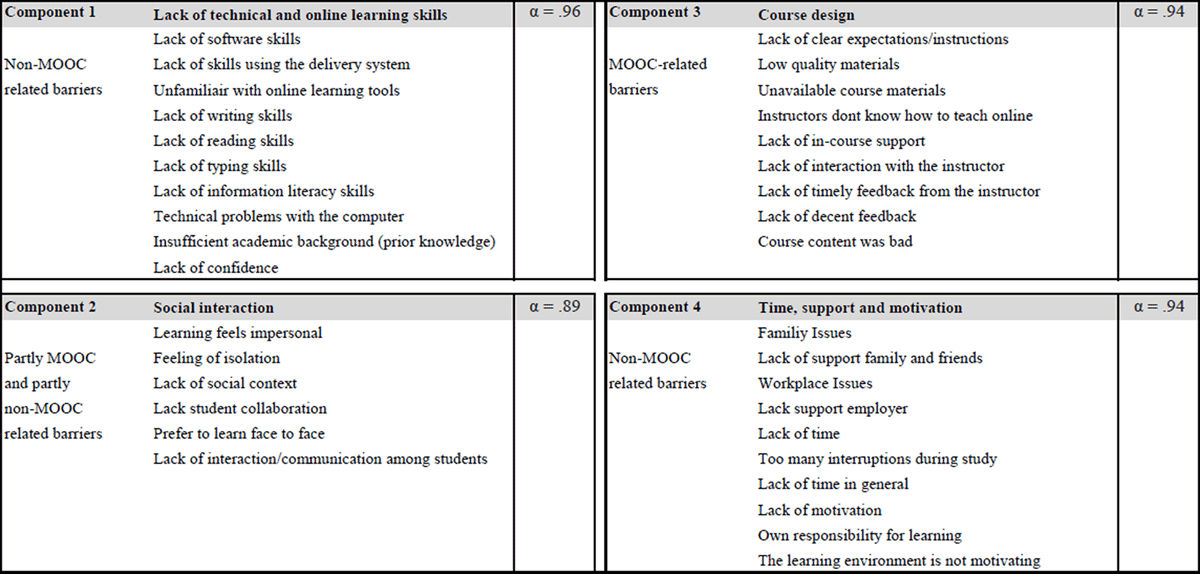
Figure 1
Preliminary categorisation and internal consistency of barriers to learning in MOOCs (Henderikx et al., 2018a).
Table 1
Final EFA goodness of fit values for respectively the 6 and 7-factor solutions (N = 270).
| TEST | FIT INDICES | |
|---|---|---|
| 6-FACTOR SOLUTION | 7-FACTOR SOLUTION | |
| Chi-Square Test of Model Fit | ||
| Value | 736.830 | 505.654 |
| degrees of freedom | 372 | 344 |
| p-value | .000 | .000 |
| RMSEA | ||
| Estimate | 0.046 | 0.045 |
| CFI/TLI | ||
| CFI | 0.956 | 0.963 |
| TLI | 0.934 | 0.940 |
| Standardized/weighted Root Mean Square Residual | ||
| Value | 0.024 | 0.024 |
Table 2
Factor loadings of the barriers (i.e. items) based on EFA on their target categories (i.e. factors) in the 6-factor solution.
| ITEM DESCRIPTION | 1 | 2 | 3 | 4 | 5 | 6 |
|---|---|---|---|---|---|---|
| Lack of Interaction with Instructor | .753* | .188* | –.098 | –.025 | –.041 | –.008 |
| Lack of Instructor Presence | .645* | .240* | .023 | –.056 | –.005 | .009 |
| Lack of Interaction with Students | .723* | .092 | –.080 | .060 | .062 | –.022 |
| Learning feels Impersonal | .715* | .006 | .036 | .011 | .081 | .036 |
| Lack of Student Collaboration | .603* | –.102 | .260* | –.031 | .015 | –.005 |
| Prefer Face To Face Learning | .659* | –.149* | .050 | .064 | .030 | .126* |
| Feeling Of Isolation | .569* | –.127* | .186 | –.066 | .102 | .168* |
| Lack of Language Skills | –.047 | .883* | .098* | .009 | –.018 | .033 |
| Lack of Writing Skills | .035 | .829* | .023 | .011 | .010 | –.029 |
| Lack of Reading Skills | –.009 | .669* | .235* | .134* | –.038 | .019 |
| Lack of Information Literacy Skills | .132 | .584* | .028 | .286* | .063 | –.029 |
| Lack of Typing Skills | .028 | .738* | –.082 | .046 | –.016 | .031 |
| Lack of Confidence | .203* | .423* | –.147* | –.061 | .135* | .153* |
| Low Quality of the Learning Materials | –.031 | .04 | .855* | .048 | .021 | .039 |
| Instructors Don’t Know How To Teach Online | .124* | .029 | .753* | .041 | –.011 | .045 |
| Course content is bad | –.032 | .109* | .757* | .029 | .038 | .042 |
| Course content is too easy | .117 | .070 | .567* | –.093 | .139* | –.159* |
| Unavailable Course Materials | .035 | .025 | .578* | .200* | –.038 | –.019 |
| Lack of Clear Expectations or Instructions | .211* | .027 | .565* | .038 | .028 | .119* |
| Technical Problems PC | –.106* | .050 | .068 | .766* | .058 | .003 |
| Lack of Software Skills | .078 | –.003 | .125 | .571* | –.043 | .117 |
| Lack of Skills Using the Delivery System | .009 | .004 | .063 | .663* | –.003 | .175* |
| Lack of Adequate Internet | –.090 | .058 | .161* | .532* | .141* | .019 |
| Insufficient Training To Use Delivery System | .087 | .150* | .044 | .492* | .093 | .097 |
| Lack of Technical Assistance | .188* | .188* | .011 | .530* | .120* | –.134* |
| Workplace Commitments | .011 | .030 | –.176* | .034 | .801* | .057 |
| Workplace Issues | –.027 | –.019 | .091 | .097 | .712* | –.019 |
| Lack of Support from the Employer | .195* | –.111 | .140 | .088 | .545* | –.249* |
| Lack Time | –.082 | –.132* | .024 | –.210* | .484* | .339* |
| Too Many Interruptions During Study | .002 | .106 | .027 | .057 | .526* | .153* |
| Family Issues | –.078 | .145* | .154 | .042 | .481* | –.006 |
| Lack of Motivation | .053 | .083 | .083 | .179* | –.036 | .665* |
| Own Responsibility Learning | .145* | –.022 | –.053 | .139 | .079 | .610* |
| Procrastinate | .055 | .093 | .051 | –.089 | .143* | .549* |
[i] * Statistically significant at 5% level
Note 1: Italic numbers represent items with factor loadings < .40.
Note 2: Bold numbers represent items with factor loadings > .40 onto their target factor.
| Factor 1 | Social interactions: These are issues to learning in MOOCs that learners perceive as being caused by the online environment such as a lack of interaction with peers and instructors, the lack of collaboration with other learners, feeling isolated or preferring face-to-face learning. |
| Factor 2 | Academic skills: Learners perceive barriers to learning in MOOCs due to a lack of basic academic skills related to writing, reading typing and information literacy. |
| Factor 3 | Content related issues: This factor is concerned with issues that are related to the content of the MOOC that can be experienced as barriers by learners, such as the unavailability of learning materials, a low quality of the learning materials or the lack of clear instructions in the MOOC. |
| Factor 4 | Technical skills and problems: Learners experience barriers to learning in MOOCs due to their lack of technical skills or technical problems such as technical problems with the pc or the internet or their unfamiliarity with online learning tools, lack of skills using the delivery system or lack of software skills. |
| Factor 5 | Situational issues: This factor is concerned with the extent to which learners experience barriers relating to a lack of time in general, family or work issues or interruptions during their study time. |
| Factor 6 | Individual motivation: These are issues relating to learner motivation while learning in the less supported learning environment of a MOOC, such as procratination, lack of motivation or the own responsibility for learning. |
Table 3
Factor labels and internal consistency value per factor.
| # ITEMS | LABEL | α | |
|---|---|---|---|
| Factor 1 | 7 | Social interactions | .867 |
| Factor 2 | 6 | Academic skills | .894 |
| Factor 3 | 6 | Content related issues | .881 |
| Factor 4 | 6 | Technical skills and problems | .845 |
| Factor 5 | 6 | Situational issues | .801 |
| Factor 6 | 3 | Individual motivation | .750 |
Table 4
CFA goodness of fit values for the 6-factor solution with and without covariation (N = 270).
| TEST | FIT INDICES | |
|---|---|---|
| NO COVARIATION | WITH COVARIATION | |
| Chi-Square Test of Model Fit | ||
| Value | 1009.783 | 903.388 |
| degrees of freedom | 512 | 508 |
| p-value | .000 | .000 |
| RMSEA | ||
| Estimate | 0.064 | 0.057 |
| 90% confidence interval | .058–.070 | .051–.063 |
| CFI/TLI | ||
| CFI | 0.887 | 0.910 |
| TLI | 0.876 | 0.901 |
| Standardized/weighted Root Mean Square Residual | ||
| Value | 0.068 | 0.070 |
Table 5
CFA factor loadings for the 6-factor model.
| ITEM DESCRIPTION | 1 | 2 | 3 | 4 | 5 | 6 |
|---|---|---|---|---|---|---|
| Lack of Interaction with Instructor | .677* | |||||
| Lack of Instructor Presence | .691* | |||||
| Lack of Interaction with Students | .604* | |||||
| Learning feels Impersonal | .808* | |||||
| Lack of Student Collaboration | .621* | |||||
| Prefer Face To Face Learning | .691* | |||||
| Feeling Of Isolation | .719* | |||||
| Lack of Language Skills | .909* | |||||
| Lack of Writing Skills | .840* | |||||
| Lack of Reading Skills | .870* | |||||
| Lack of Information Literacy Skills | .855* | |||||
| Lack of Typing Skills | .730* | |||||
| Lack of Confidence | .436* | |||||
| Low Quality of the Learning Materials | .907* | |||||
| Instructors Don’t Know How To Teach Online | .836* | |||||
| Course content is bad | * | .834* | ||||
| Course content is too easy | .572* | |||||
| Unavailable Course Materials | .679* | |||||
| Lack of Clear Expectations or Instructions | .716* | |||||
| Technical Problems PC | .800* | |||||
| Lack of Software Skills | .681* | |||||
| Lack of Skills Using the Delivery System | .759* | |||||
| Lack of Adequate Internet | .700* | |||||
| Insufficient Training To Use Delivery System | .698* | |||||
| Lack of Technical Assistance | .675* | |||||
| Workplace Commitments | .779* | |||||
| Workplace Issues | .700* | |||||
| Lack of Support from the Employer | .507* | – | ||||
| Lack Time | .575* | |||||
| Too Many Interruptions During Study | .676* | |||||
| Family Issues | .488* | |||||
| Lack of Motivation | .775* | |||||
| Own Responsibility Learning | .708* | |||||
| Procrastinate | .630* |
[i] * Statistically significant at 5% level.
Table 6
Classification of barrier factors.
| FACTOR | LABEL | TYPE |
|---|---|---|
| 1 | Social interactions | Partly MOOC and partly non-MOOC related |
| 2 | Academic skills | Non-MOOC related |
| 3 | Content related issues | MOOC related |
| 4 | Technical skills and problems | Partly MOOC and partly non-MOOC related |
| 5 | Situational issues | Non-MOOC related |
| 6 | Individual motivation | Non-MOOC related |
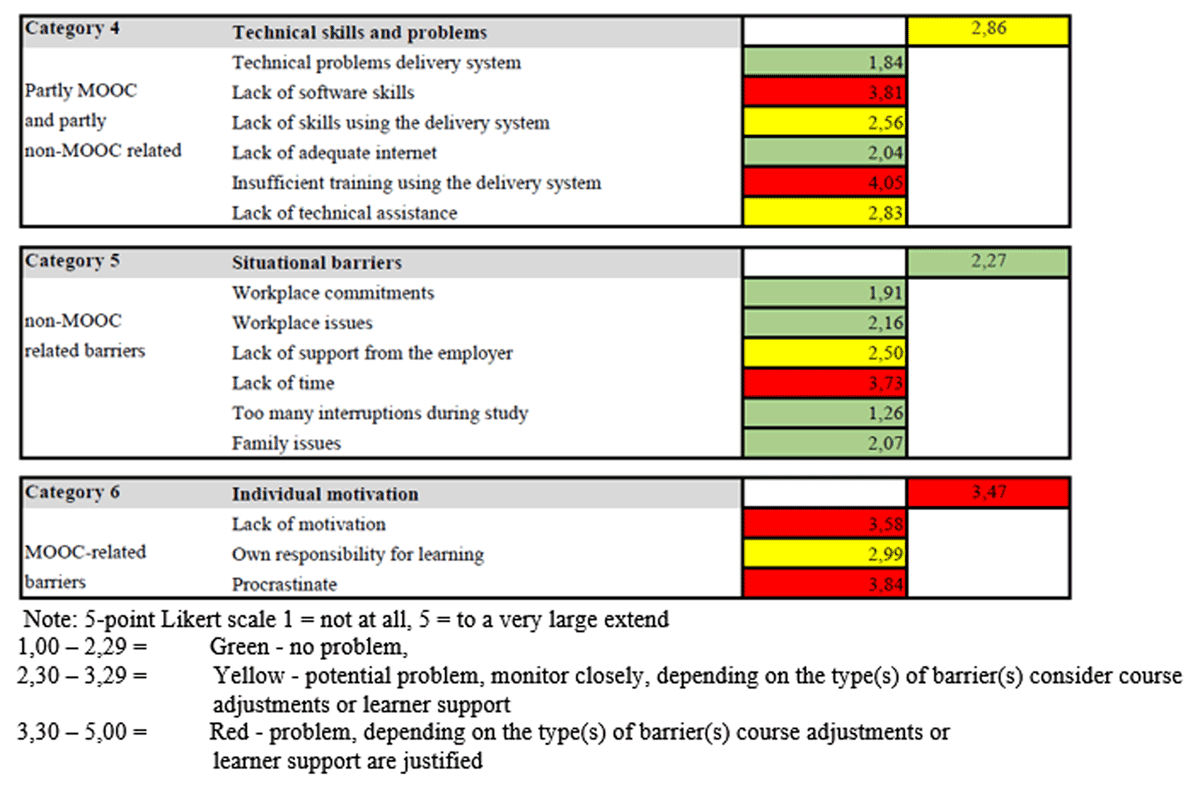
Figure 2
Example of (part of) a barriers to learning in MOOCs dashboard with fictional scores.
| SAMPLE INFORMATION N = 540 | |||
|---|---|---|---|
| ITEM NUMBER | ITEM DESCRIPTION | M | SD |
| Bar_1 | LackInstructorPresence | –.91 | 1.011 |
| Bar_2 | UnavailableCourseMaterials | –.82 | 1.218 |
| Bar_3 | InstructorsDontKnowHowToTeachOnline | –.95 | 1.214 |
| Bar_4 | LackClearExpectationsInstructions | –.83 | 1.107 |
| Bar_5 | LackInCourseSupport | –.92 | .997 |
| Bar_6 | LackTimelyFeedback | –.86 | 1.053 |
| Bar_7 | LackDecentFeedback | –.73 | 1.072 |
| Bar_8 | LackInteractionInstructor | –.58 | 1.105 |
| Bar_9 | LowQualityMaterials | –.84 | 1.270 |
| Bar_10 | InsuffTrainingTooUseDeliverySystem | –1.26 | .946 |
| Bar_11 | LackInteractionStudents | –.82 | 1.048 |
| Bar_12 | LearningImpersonal | –1.10 | 1.021 |
| Bar_13 | FeelingOfIsolation | –1.20 | .988 |
| Bar_14 | LackSocialContext | –1.16 | .961 |
| Bar_15 | LackStudentCollaboration | –.90 | 1.075 |
| Bar_16 | PreferFaceToFaceLearning | –.62 | 1.212 |
| Bar_17 | LackLanguageSkills | –1.31 | 1.076 |
| Bar_18 | LackWritingSkills | –1.28 | .973 |
| Bar_19 | LackReadingSkills | –1.39 | 1.020 |
| Bar_20 | LackTypingSkills | –1.51 | .810 |
| Bar_21 | LackInformationLiteracySkills | –1.33 | .976 |
| Bar_22 | LackOfConfidence | –1.21 | 1.003 |
| Bar_23 | LackSoftwareSkills | –1.37 | .958 |
| Bar_24 | LackSkillsUsingDeliverySystem | –1.36 | .916 |
| Bar_25 | UnfamiliairWithOnlineLearningTools | –1.36 | .980 |
| Bar_26 | Procratinate | –.06 | 1.269 |
| Bar_27 | LackMotivation | –.38 | 1.279 |
| Bar_28 | OwnResponsibilityLearning | –.35 | 1.286 |
| Bar_29 | LearningEnvironmentNotMotivating | –.71 | 1.120 |
| Bar_30 | FamiliyIssues | –.90 | 1.152 |
| Bar_31 | WorkplaceIssues | –.69 | 1.173 |
| Bar_32 | LackTime | .31 | 1.240 |
| Bar_33 | LackSupportFamilyFriends | –1.28 | .924 |
| Bar_34 | LackSupportEnmployer | –.92 | 1.242 |
| Bar_35 | TooMayInterruptionsDuringStudy | –.43 | 1.159 |
| Bar_36 | LackAdequateInternet | –.98 | 1.294 |
| Bar_37 | LackTechnicalAssitance | –1.16 | .950 |
| Bar_38 | CourseContentTooEasy | –.88 | 1.069 |
| Bar_39 | CourseContentTooHard | –.90 | 1.010 |
| Bar_40 | CourseContentBad | –.95 | 1.211 |
| Bar_41 | TechProblemsPC | –1.24 | 1.053 |
| Bar_42 | TechProblemsSite | –1.23 | 1.021 |
| Bar_43 | WorkplaceCommittments | –.21 | 1.311 |
| Bar_44 | InsufficientAcademicKnowledge | –1.03 | 1.033 |
[i] Note: Items were measured on a 5-point Likert scale (–2 = not at all, 2 = to a very large extend).