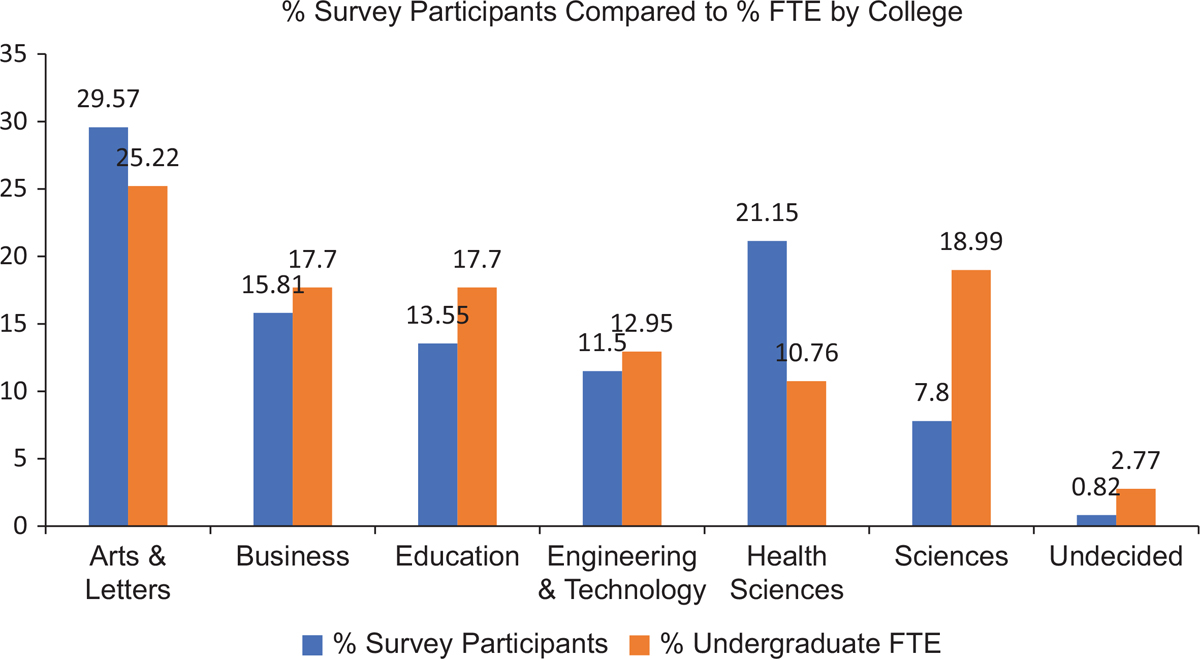
Figure 1
Percentage of Survey Participants Compared to Percentage FTE by College.
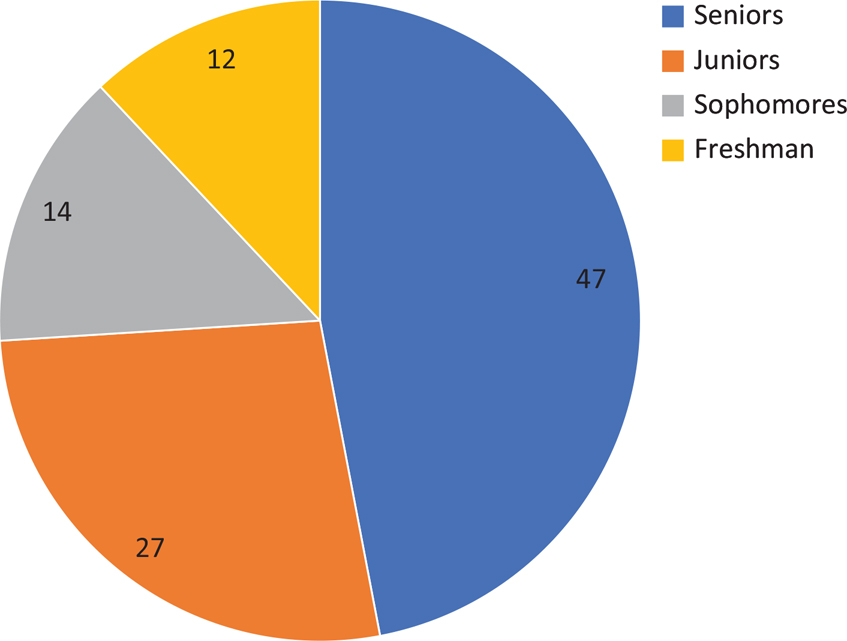
Figure 2
Percentage of Participants by Class Year.
Table 1
First Generation, Financial Aid, and Employment Information
| Which of the following applies to you? (check all that apply) | % of Survey Participants |
|---|---|
| I am a first generation college student | 22.8% |
| I receive financial aid or scholarships | 38.21% |
| I am part of a work-study program | 2.07% |
| I have a job (or jobs) that is not part of a work-study program | 33.03% |
| None of the above | 3.89% |
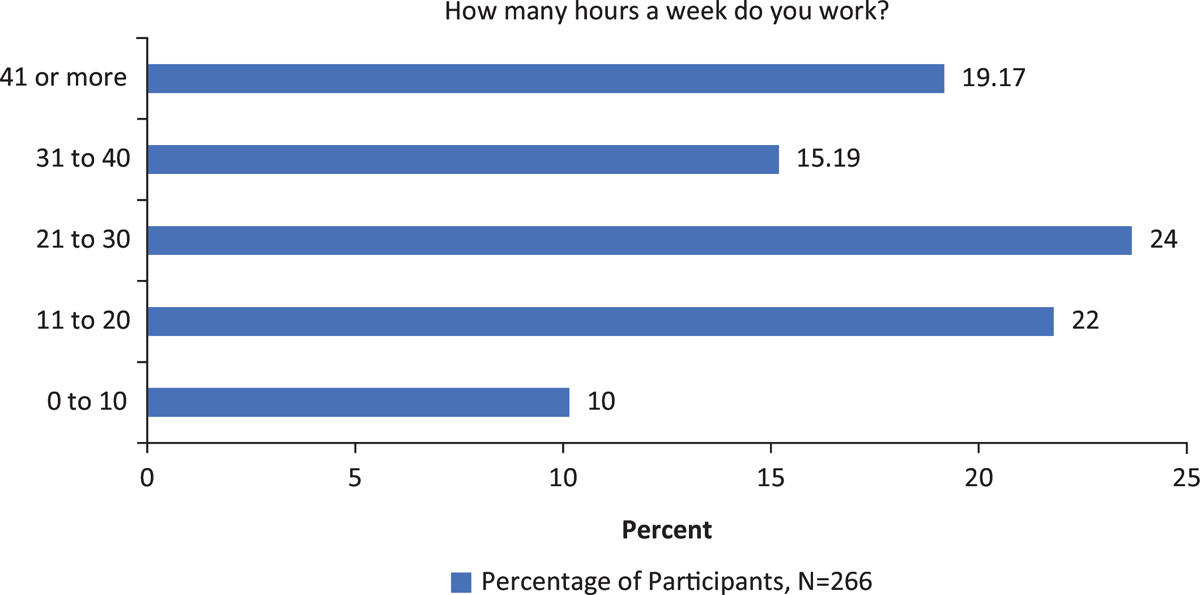
Figure 3
Number of Work Hours per Week as Reported by Employed Participants.
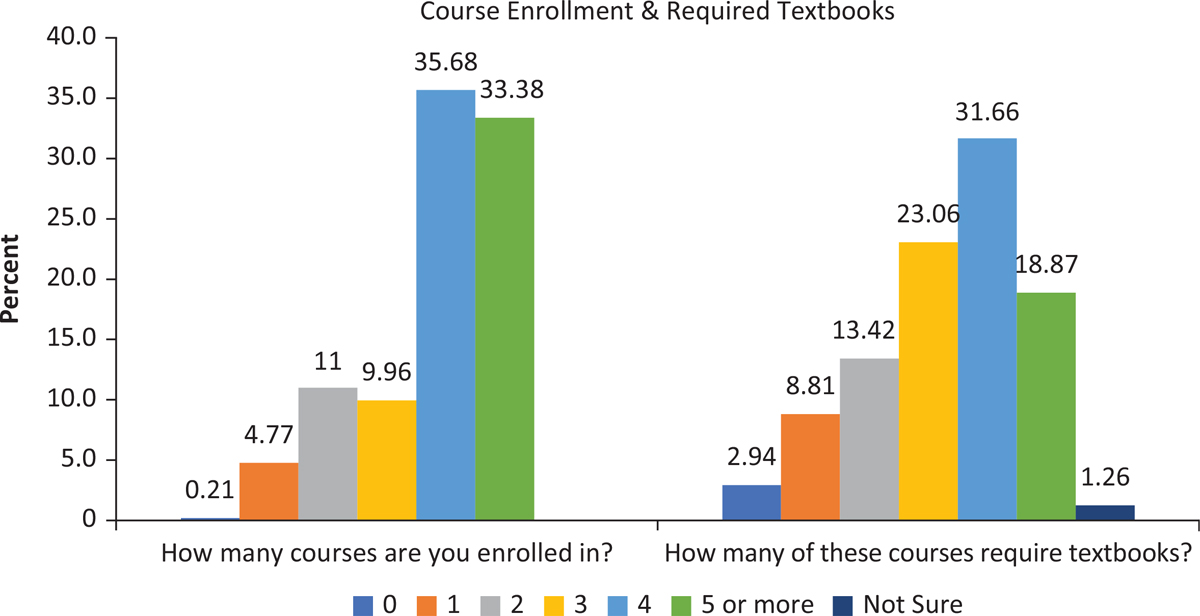
Figure 4
Number of Courses Enrolled in and Number of Required Textbooks Needed.
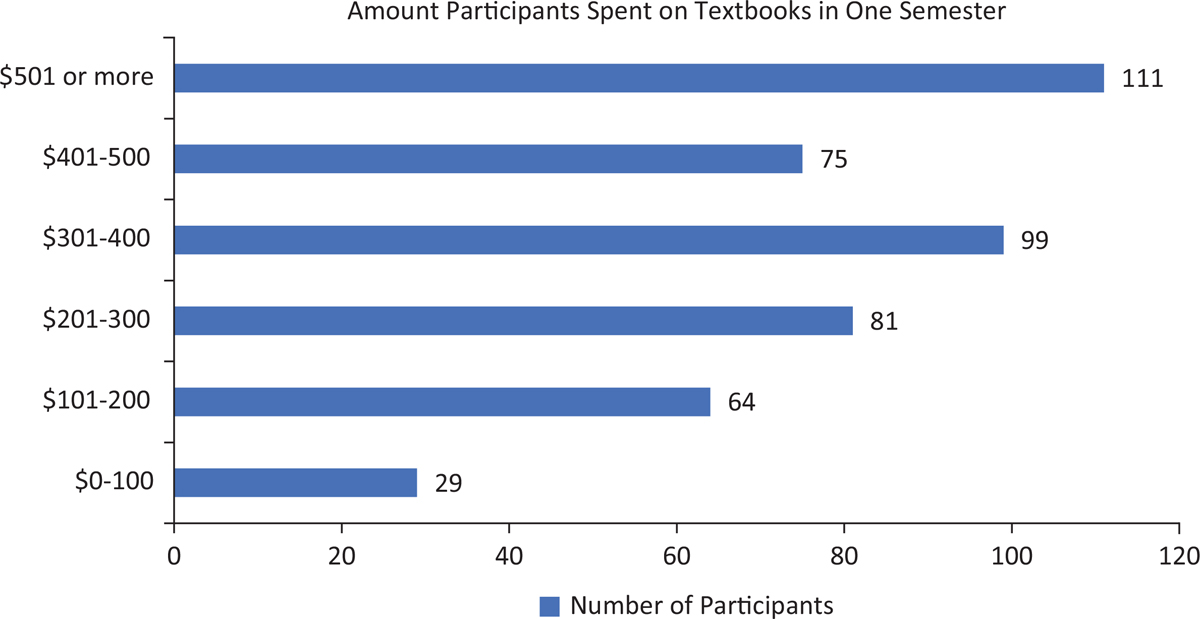
Figure 5
Amount spent on course materials, Spring 2017.
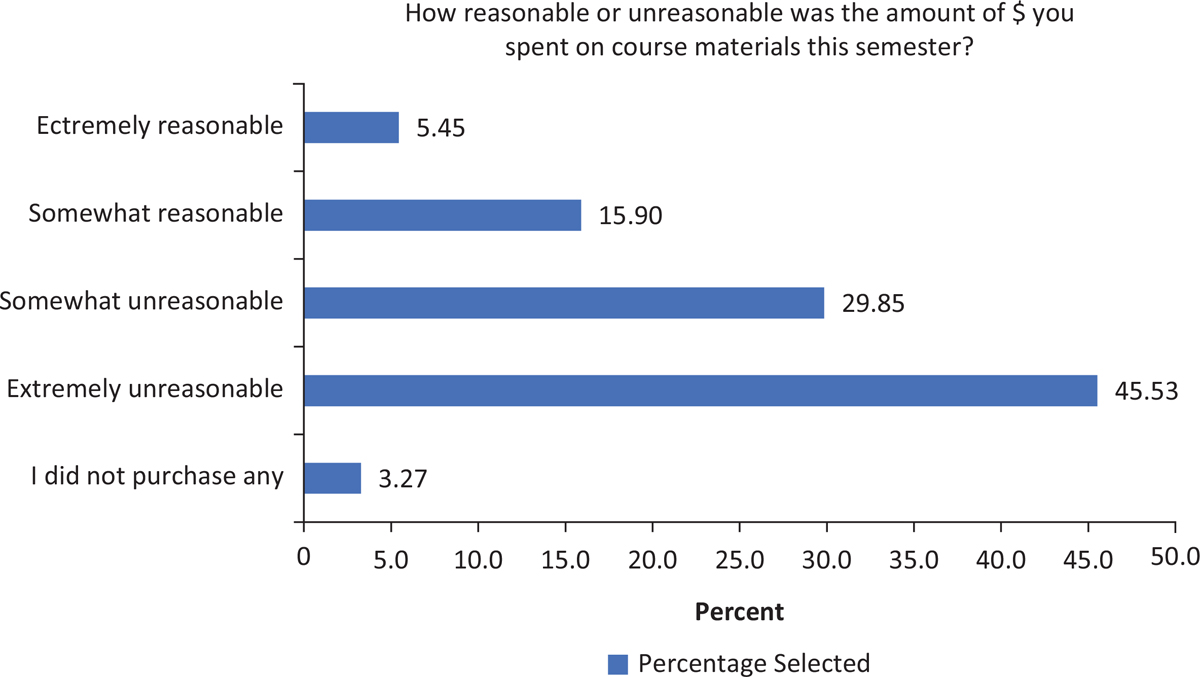
Figure 6
Student Perception of Textbook Costs.
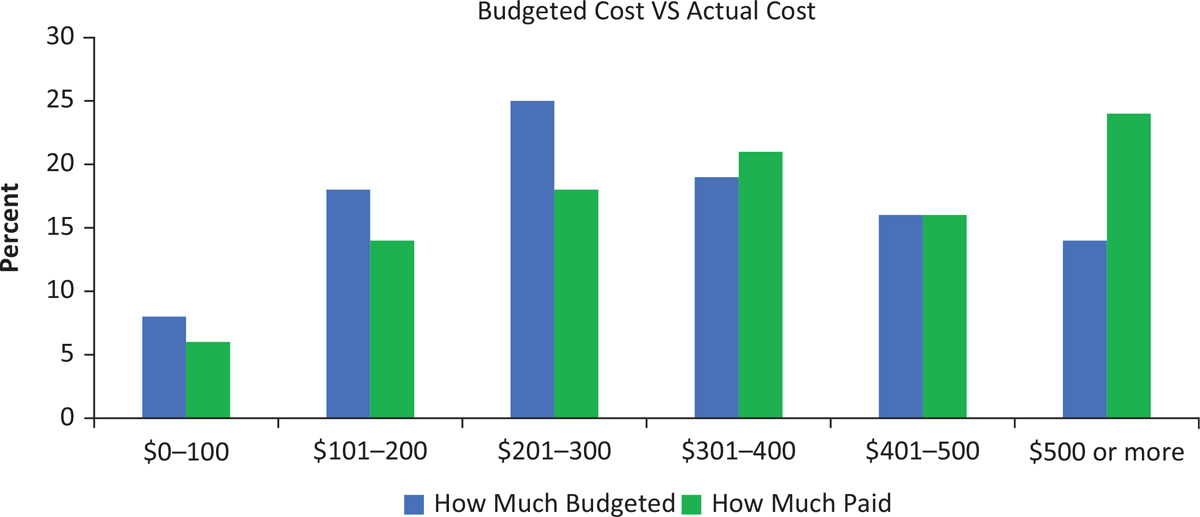
Figure 7
Budgeted cost Versus Actual Spending.
Table 2
What actions do University students take to reduce the cost of course materials?
| What are the top three actions you have taken to reduce required course materials cost? (select up to three) | % of Participants |
|---|---|
| Buy books from somewhere other than the campus bookstore | 29.68% |
| Rent printed textbooks | 20.32% |
| Rent digital textbooks | 13.94% |
| Buy used copies from the campus bookstore | 13.58% |
| Share books with classmates | 9.80% |
| Check to see if the /// Libraries have the required textbook | 4.23% |
| Other | 2.70% |
| Rent only the digital textbook chapters needed for the course | 2.34% |
| I do not attempt to reduce costs | 1.44% |
| Buy lifetime access to a digital version of a textbook | 1.08% |
| Use a reserve copy from the /// Libraries | .90% |
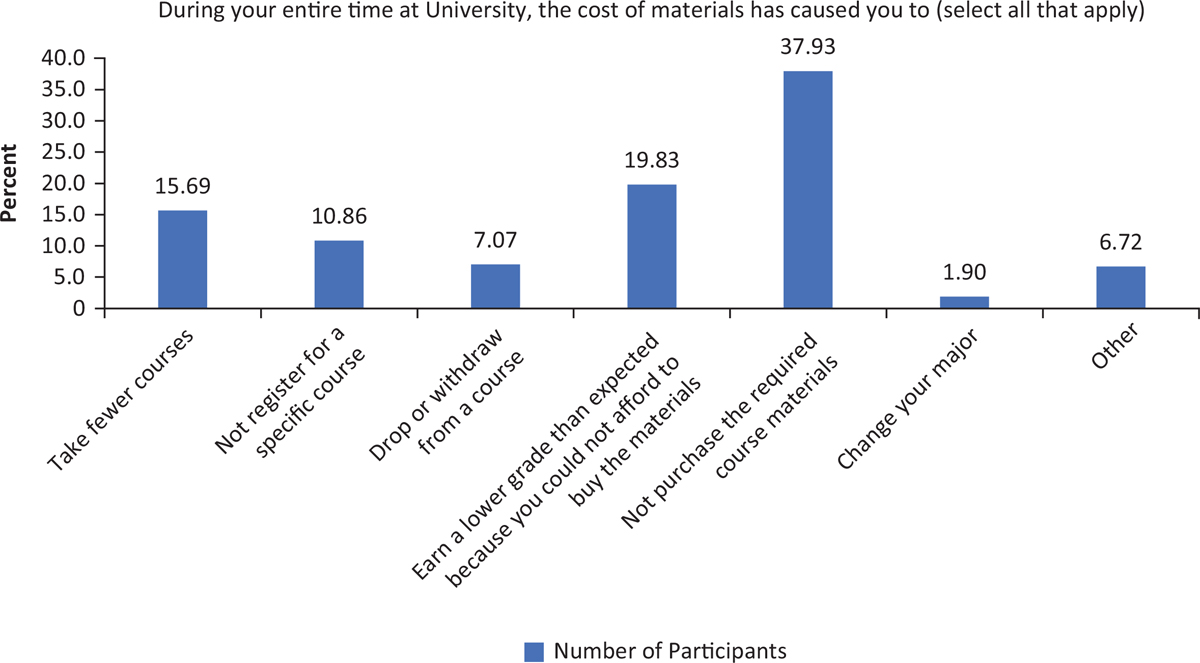
Figure 8
The cost of materials has caused students to…
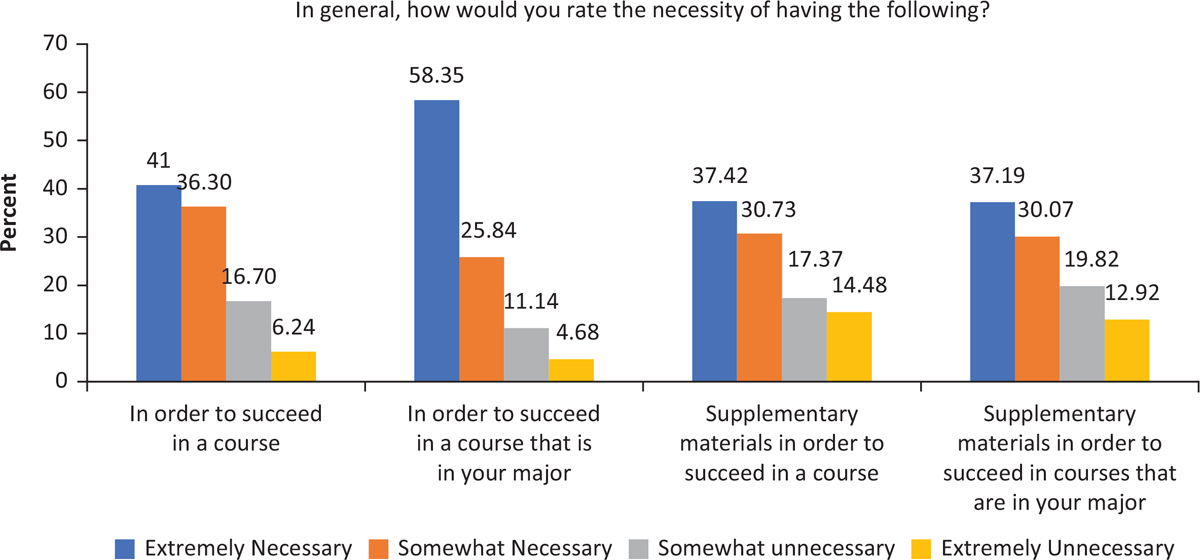
Figure 9
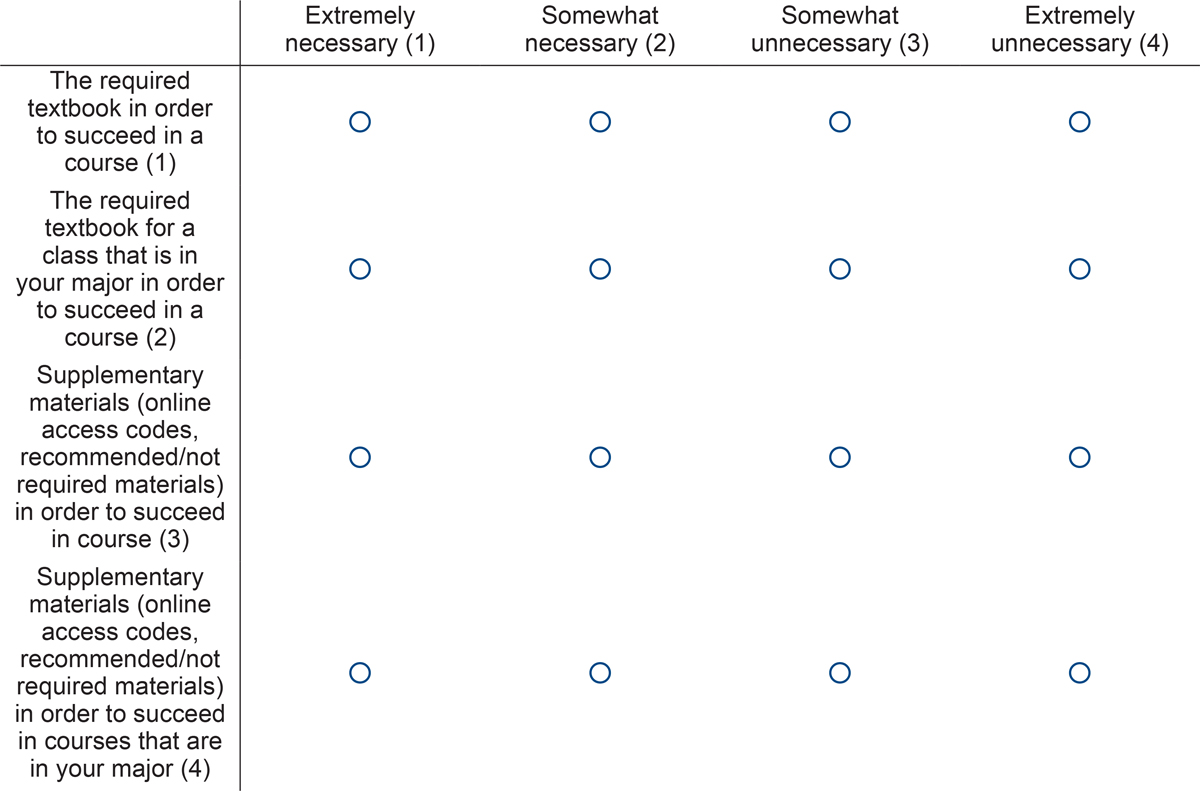
Student perceptions of the necessity of having course materials