
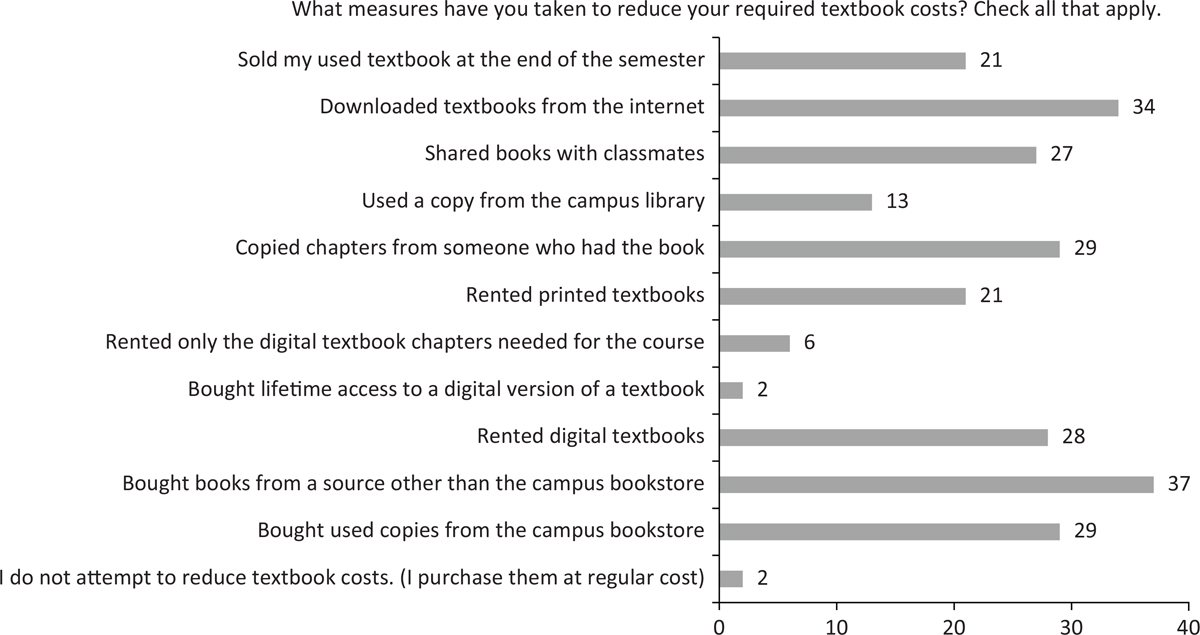
Figure 1
Measures taken by students to reduce the costs of required textbooks.
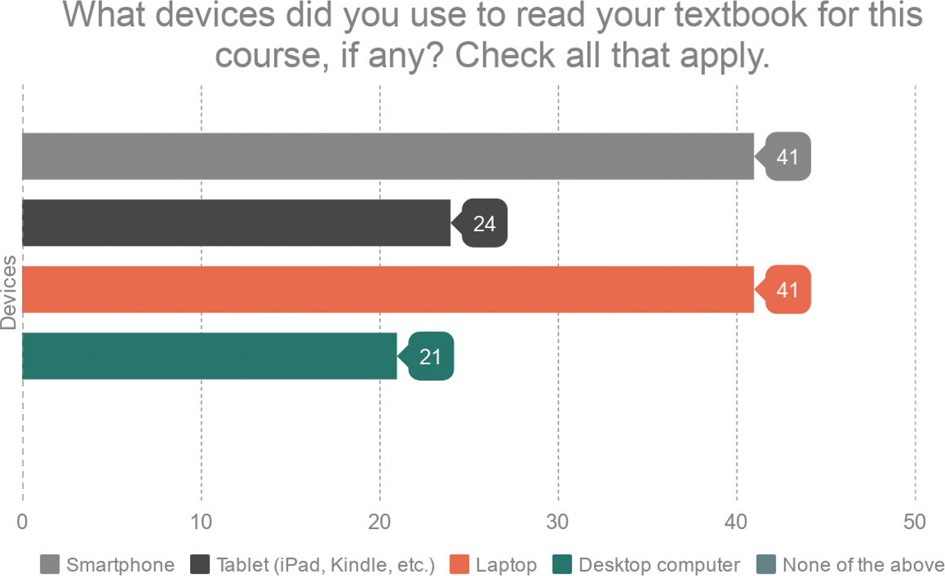
Figure 2
Devices students used to read their textbooks.
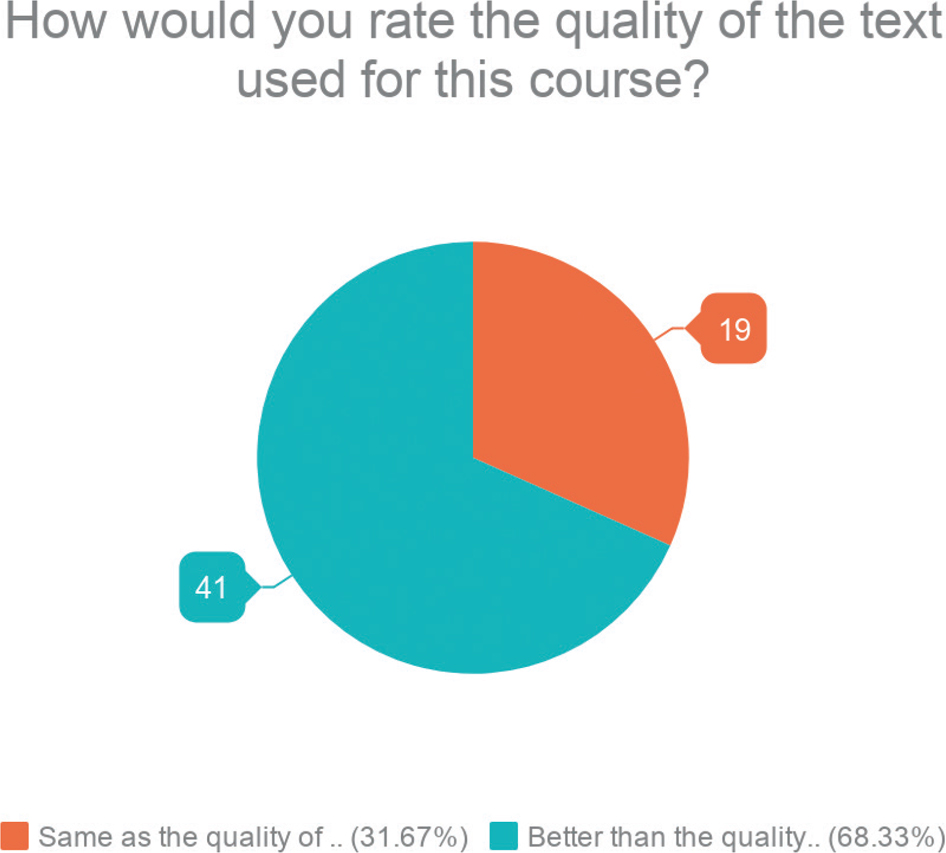
Figure 3
Quality of open textbooks.
Table 1
Student justification of textbook quality
| Themes | Initial codes | # of responses | |
|---|---|---|---|
| A | Convenience | Easy to access (online, phone, tablet, etc.) No need to carry a heavy textbook I can study anywhere | 29 |
| B | Cost | Free I can use the money saved for transportation I can use the money saved to pay for my tuition | 17 |
| C | Quality | Straightforward text Clearly written More detailed Comprehensive Thorough Easy to understand Well organized Brief “Personal feel” | 15 |
| D | Access | Access from day-one Used textbook more often | 2 |
| E | Format | No markings from used textbooks (notes, highlights, ripped pages) Open source | 2 |
| F | Neutral | Same as using a regular textbook | 4 |
| Total | 69 | ||
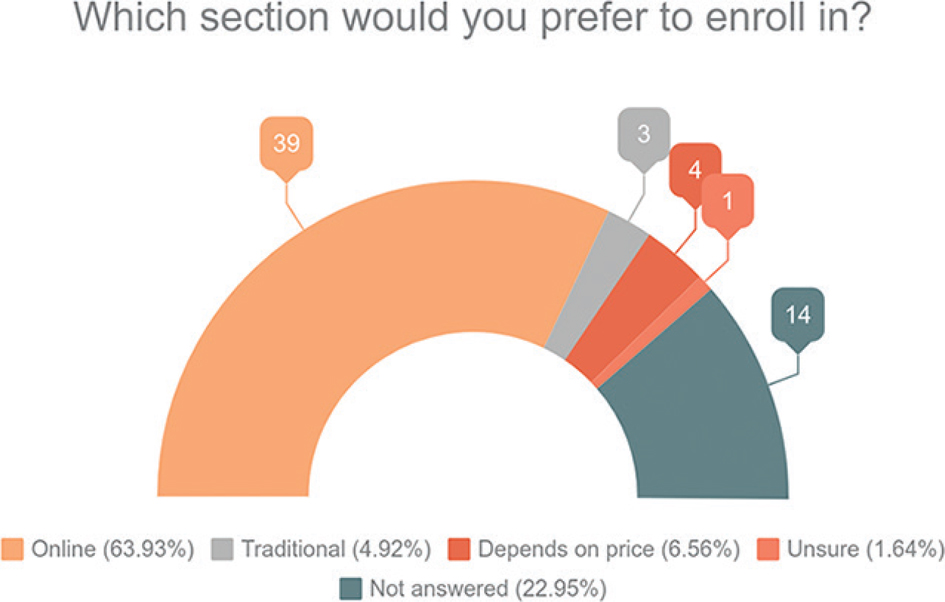
Figure 4
Students’ course preference.
Table 2
Comparative summary of OER and traditional outcomes
| Term | N | Mean | Median | Std Dev | 25th Pctl | 75th Pctl |
|---|---|---|---|---|---|---|
| OER | 99 | 86.64 | 88.00 | 10.05 | 84.50 | 94.50 |
| Traditional | 81 | 84.61 | 84.50 | 9.28 | 78.00 | 91.00 |
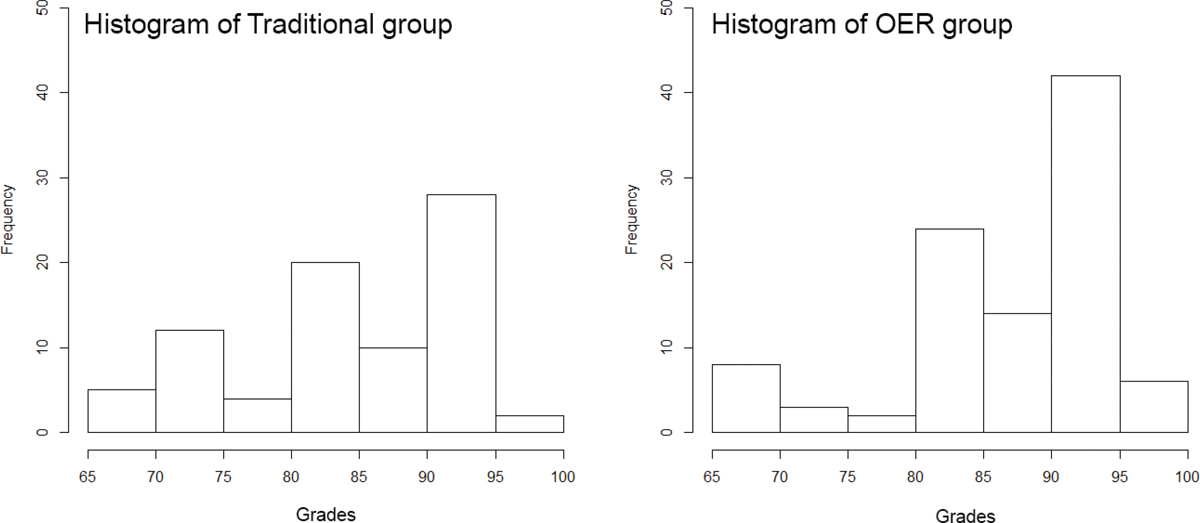
Figure 5
Comparative histogram of OER and traditional outcomes.
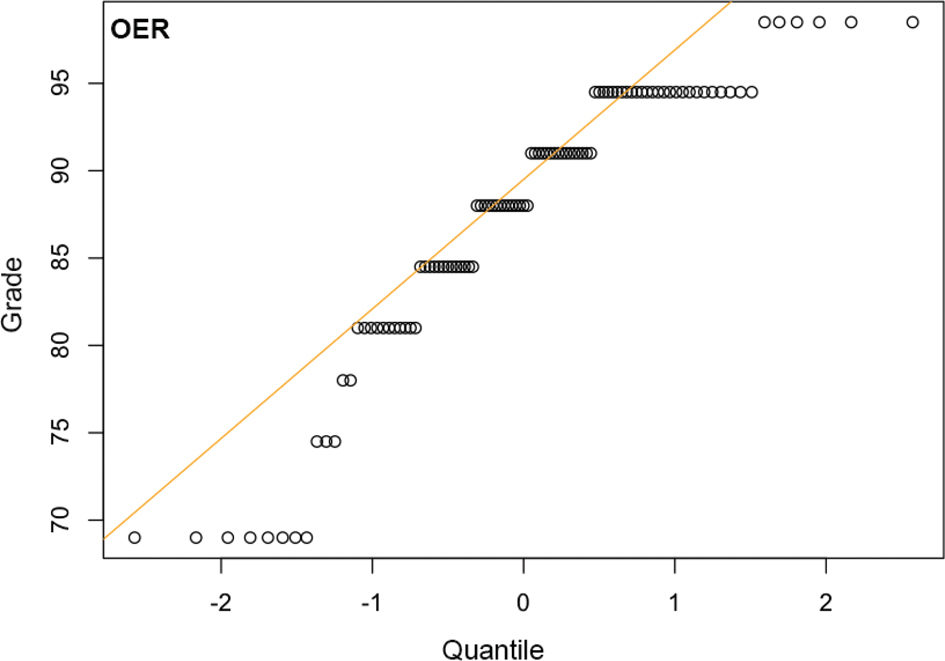
Figure 6
Quantile-Quantile plot of OER group.
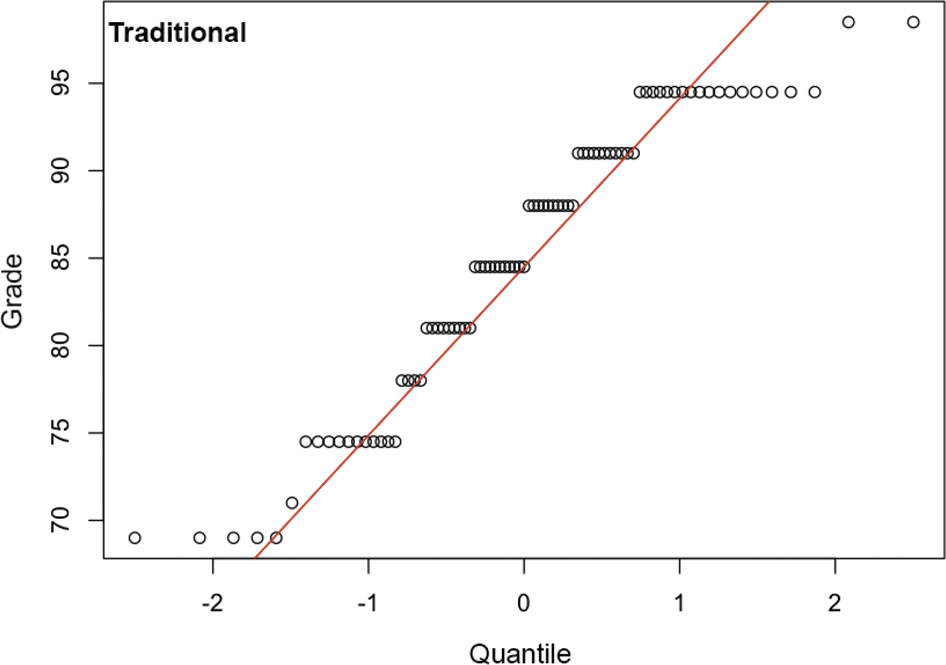
Figure 7
Quantile-Quantile plot of traditional group.