
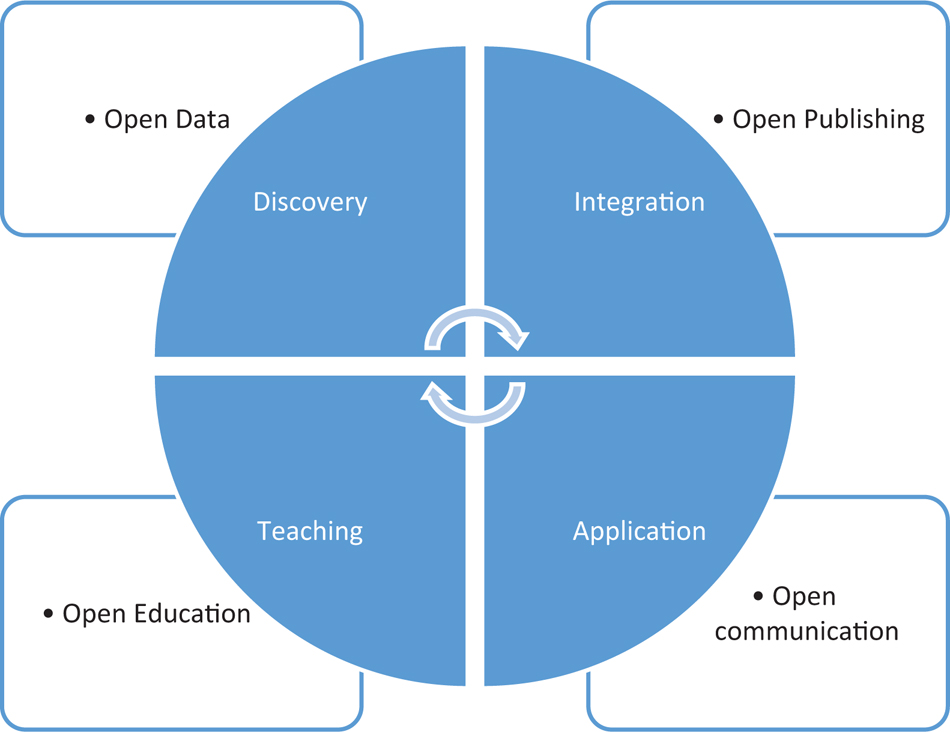
Figure 1
Boyer’s multidimensional model in the context of digital scholarship
Source: adapted from Pearce et al., 2010
Table 1
Knowledge on OER
| Knowledge on OER | Mean | SD | Insufficient | Sufficient | Good | Very Good |
|---|---|---|---|---|---|---|
| OER concept | 2.32 | 0.98 | 89 (25.6%) | 99 (28.4%) | 121 (34.8%) | 39 (11.2%) |
| OER repositories | 2.20 | 0.98 | 102 (29.3%) | 110 (31.6%) | 99 (28.4%) | 37 (10.6%) |
| Open licenses | 1.85 | 0.96 | 162 (46.6%) | 102 (29.3%) | 57 (16.4%) | 27 (7.8%) |
| Institutional policies on OER | 1.61 | 0.84 | 203 (58.3%) | 87 (25.0%) | 47 (13.5%) | 11 (3.2%) |
| International initiatives on OER | 1.53 | 0.82 | 224 (64.4%) | 73 (21.0%) | 40 (11.5%) | 11 (3.2%) |
| Copyright | 2.12 | 0.96 | 109 (31.3%) | 119 (34.2%) | 88 (25.3%) | 32 (9.2%) |
[i] SD – Standard deviation; Mode in bold.
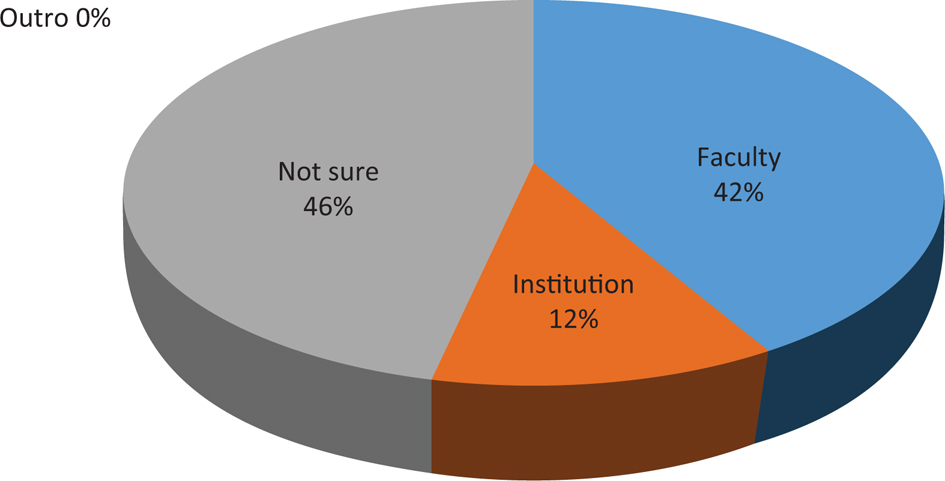
Figure 2
Who owns copyright of teaching materials
Table 2
Frequency of use: OER-related activities
| Frequency of use: OER-related activities | Mean | SD | Never | Rarely | Often | Always |
|---|---|---|---|---|---|---|
| I reuse existing OER in original form | 1.98 | 0.86 | 123 (35.3%) | 118 (33.9%) | 98 (28.2%) | 9 (2.6%) |
| I adapt existing OER to the context of my needs | 2.21 | 0.90 | 97 (27.9%) | 96 (27.6%) | 141 (40.5%) | 14 (4.0%) |
| I share OER adapted by me | 1.86 | 0.86 | 150 (43.1%) | 106 (30.5%) | 84 (24.1%) | 8 (2.3%) |
| I share OER produced by me | 2.01 | 0.92 | 129 (37.1%) | 100 (28.7%) | 104 (29.9%) | 15 (4.3%) |
| I research OER repositories | 2.18 | 0.93 | 106 (30.5%) | 89 (25.6%) | 136 (39.1%) | 17 (4.9%) |
| I publish in OER repositories | 1.75 | 0.79 | 159 (45.7%) | 119 (34.2%) | 67 (19.3%) | 3 (0.9%) |
[i] SD – Standard deviation; Mode in bold.
Table 3
Importance of barriers to the use of OER
| Importance of Barriers to the use of OER | Mean | SD | Not important | Slightly important | No opinion | Important | Very important |
|---|---|---|---|---|---|---|---|
| Insufficient technical support at institution | 3.65 | 1.08 | 11 (3.2%) | 54 (15.5%) | 55 (15.8%) | 154 (44.3%) | 74 (21.3%) |
| Insufficient legal support at institution | 3.55 | 1.12 | 17 (4.9%) | 57 (16.4%) | 60 (17.2%) | 147 (42.2%) | 67 (19.3%) |
| Lack of reward system to créate OER | 3.54 | 1.22 | 23 (6.6%) | 62 (17.8%) | 54 (15.5%) | 123 (35.3%) | 86 (24.7%) |
| Lack of time to créate or adapt OER | 3.96 | 1.05 | 9 (2.6%) | 34 (9.8%) | 42 (12.1%) | 141 (40.5%) | 122 (35.1%) |
| Lack of quality in existing OER | 3.34 | 1.07 | 23 (6.6%) | 52 (14.9%) | 96 (27.6%) | 137 (39.4%) | 40 (11.5%) |
| Lack of hardware/software to créate or adapt OER | 3.15 | 1.18 | 29 (8.3%) | 92 (26.4%) | 67 (19.3%) | 118 (33.9%) | 42 (12.1%) |
| Lack of skills to créate or adapt OER | 3.61 | 1.27 | 29 (8.3%) | 48 (13.8%) | 53 (15.2%) | 116 (33.3%) | 102 (29.3%) |
| Lack of culturally relevant OER | 3.17 | 1.05 | 17 (4.9%) | 83 (23.9%) | 104 (29.9%) | 111 (31.9%) | 33 (9.5%) |
| Lack of OER in user’s native language | 3.00 | 1.23 | 43 (12.4%) | 92 (26.4%) | 77 (22.1%) | 95 (27.3%) | 41 (11.8%) |
| Lack of interest in pedagogical innovation | 3.34 | 1.33 | 51 (14.7%) | 48 (13.8%) | 47 (13.5%) | 134 (38.5%) | 68 (19.5%) |
| Lack of national/regional support policies | 3.56 | 1.14 | 23 (6.6%) | 43 (12.4%) | 68 (19.5%) | 143 (41.1%) | 71 (20.4%) |
| Lack of institutional support strategies/policies | 3.82 | 1.16 | 17 (4.9%) | 38 (10.9%) | 55 (15.8%) | 120 (34.5%) | 118 (33.9%) |
| Lack of interest in creating and adapting OER | 3.41 | 1.31 | 44 (12.6%) | 47 (13.5%) | 54 (15.5%) | 127 (36.5%) | 76 (21.8%) |
[i] SD – Standard deviation; Mode in bold.
Table 4
Importance of incentives to the use of OER
| Importance of incentives to the use of OER | Mean | SD | Not important | Slightly important | No opinion | Important | Very important |
|---|---|---|---|---|---|---|---|
| Technical support to the use of OER | 4.05 | 0.98 | 7 (2.0%) | 29 (8.3%) | 30 (8.6%) | 157 (45.1%) | 125 (35.9%) |
| Legal support to the use of OER (copyright issues) | 3.98 | 0.99 | 6 (1.7%) | 35 (10.1%) | 33 (9.5%) | 161 (46.3%) | 113 (32.5%) |
| Use of OER as specific criterion in faculty evaluation | 3.68 | 1.21 | 24 (6.9%) | 49 (14.1%) | 37 (10.6%) | 143 (41.1%) | 95 (27.3%) |
| Allocation of hours to créate and adapt OER | 3.78 | 1.14 | 13 (3.7%) | 54 (15.5%) | 32 (9.2%) | 148 (42.5%) | 101 (29.0%) |
| System of OER quality assurance | 3.99 | 0.89 | 7 (2.0%) | 19 (5.5%) | 40 (11.5%) | 186 (53.4%) | 96 (27.6%) |
| Training/workshops for faculty | 4.24 | 0.99 | 7 (2.0%) | 23 (6.6%) | 27 (7.8%) | 112 (32.2%) | 179 (51.4%) |
| Existence of OER sharing community | 4.05 | 0.99 | 4 (1.1%) | 34 (9.8%) | 35 (10.1%) | 142 (40.8%) | 133 (38.2%) |
| Existence of institutional platform for OER sharing | 4.15 | 0.92 | 3 (0.9%) | 25 (7.2%) | 32 (9.2%) | 145 (41.7%) | 143 (41.1%) |
| Existence of regional/national platform for OER sharing | 3.77 | 1.00 | 7 (2.0%) | 48 (13.8%) | 35 (10.1%) | 186 (53.4%) | 72 (20.7%) |
| Existence of funded projects to créate OER | 3.91 | 1.08 | 7 (2.0%) | 47 (13.5%) | 38 (10.9%) | 134 (38.5%) | 122 (35.1%) |
| Mandatory to share teaching materials | 3.08 | 1.31 | 50 (14.4%) | 85 (24.4%) | 50 (14.4%) | 112 (32.2%) | 51 (14.7%) |
[i] SD – Standard deviation; Mode in bold.
Table 5
Knowledge on Open Access
| Knowledge on Open Access | Mean | SD | Insufficient | Sufficient | Good | Very Good |
|---|---|---|---|---|---|---|
| Open Access concept | 2.60 | 0.92 | 47 (13.5%) | 102 (29.3%) | 141 (40.5%) | 58 (16.7%) |
| Open Access repositories | 2.55 | 0.92 | 51 (14.7%) | 106 (30.5%) | 138 (39.7%) | 53 (15.2%) |
| Open Access journals | 2.68 | 0.94 | 38 (10.9%) | 111 (31.9%) | 123 (35.3%) | 76 (21.8%) |
| Open Access policies/mandates | 1.85 | 0.92 | 153 (44.0%) | 119 (34.2%) | 52 (14.9%) | 24 (6.9%) |
| Copyright on scientific production | 2.07 | 0.93 | 110 (31.6%) | 131 (37.6%) | 78 (22.4%) | 29 (8.3%) |
| International initiatives on OA | 1.66 | 0.88 | 198 (56.9%) | 86 (24.7%) | 49 (14.1%) | 15 (4.3%) |
[i] SD – Standard deviation; Mode in bold.
Table 6
Frequency of publication – scientific production
| Frequency of publication | Mean | SD | Never | Rarely | Often | Always |
|---|---|---|---|---|---|---|
| “Paid” journals | 2.20 | 0.90 | 81 (23.3%) | 147 (42.2%) | 89 (25.6%) | 31 (8.9%) |
| Open Access journals | 2.29 | 0.77 | 54 (15.5%) | 151 (43.4%) | 130 (37.4%) | 13 (3.7%) |
| LMS (Moodle, Blackboard, etc.) | 2.34 | 1.01 | 93 (26.7%) | 90 (25.9%) | 119 (34.2%) | 46 (13.2%) |
| Personal website | 1.57 | 0.81 | 207 (59.5%) | 95 (27.3%) | 33 (9.5%) | 13 (3.7%) |
| Open Access institutional repository | 2.31 | 0.93 | 79 (22.7%) | 116 (33.3%) | 118 (33.9%) | 35 (10.1%) |
| Social networks (Facebook, Twitter, Google+, etc.) | 1.58 | 0.77 | 197 (56.6%) | 109 (31.3%) | 33 (9.5%) | 9 (2.6%) |
| Academic social networks (ResearchGate, Academia.edu, Mendeley, etc.) | 2.18 | 0.96 | 104 (29.9%) | 106 (30.5%) | 109 (31.3%) | 29 (8.3%) |
[i] SD – Standard deviation; Mode in bold.
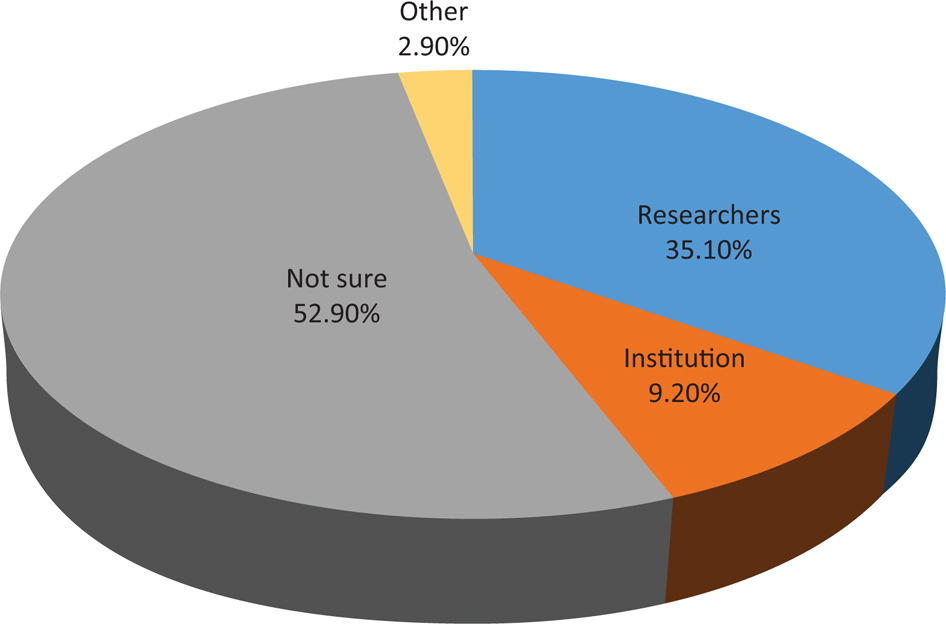
Figure 3
Who owns copyright of scientific production
Table 7
Importance of barriers to Open Access
| Importance of barriers to Open Access | Mean | SD | Not important | Slightly important | No opinion | Important | Very important |
|---|---|---|---|---|---|---|---|
| Insufficient technical support at institution | 3.67 | 1.06 | 12 (3.4%) | 53 (15.2%) | 38 (10.9%) | 179 (51.4%) | 66 (19.0%) |
| Insufficient legal support at institution | 3.64 | 1.08 | 11 (3.2%) | 60 (17.2%) | 42 (12.1%) | 167 (48.0%) | 68 (19.5%) |
| Lack of reward system to publish in OA | 3.64 | 1.26 | 23 (6.6%) | 62 (17.8%) | 39 (11.2%) | 119 (34.2%) | 105 (30.2%) |
| Lack of time to publish in OA | 3.70 | 1.25 | 24 (6.9%) | 55 (15.8%) | 29 (8.3%) | 132 (37.9%) | 108 (31.0%) |
| Lack of quality of OA publications | 3.39 | 1.09 | 21 (6.0%) | 67 (19.3%) | 51 (14.7%) | 174 (50.0%) | 35 (10.1%) |
| Lack of hardware/software to use repositories | 2.97 | 1.20 | 44 (12.6%) | 97 (27.9%) | 57 (16.4%) | 125 (35.9%) | 25 (7.2%) |
| Lack of skills to publish in OA | 3.30 | 1.28 | 33 (9.5%) | 85 (24.4%) | 41 (11.8%) | 123 (35.3%) | 66 (19.0%) |
| Lack of interest in scientific innovation | 3.12 | 1.36 | 57 (16.4%) | 76 (21.8%) | 40 (11.5%) | 118 (33.9%) | 57 (16.4%) |
| Lack of national/regional support policies | 3.50 | 1.12 | 22 (6.3%) | 56 (16.1%) | 49 (14.1%) | 168 (48.3%) | 53 (15.2%) |
| Lack of institutional support strategies/policies | 3.79 | 1.19 | 20 (5.7%) | 41 (11.8%) | 47 (13.5%) | 123 (35.3%) | 117 (33.6%) |
| Lack of knowledge on the mandatory carácter of institutional policies | 3.57 | 1.11 | 18 (5.2%) | 47 (13.5%) | 70 (20.1%) | 143 (41.1%) | 70 (20.1%) |
| Lack of knowledge on publishers’ deposit policies | 3.58 | 1.10 | 15 (4.3%) | 52 (14.9%) | 68 (19.5%) | 143 (41.1%) | 70 (20.1%) |
| Lack of interest in publishing in OA | 3.44 | 1.29 | 40 (11.5%) | 51 (14.7%) | 48 (13.8%) | 134 (38.5%) | 75 (21.6%) |
[i] SD – Standard deviation; Mode in bold.
Table 8
Importance of incentives to Open Access
| Importance of incentives to Open Access | Mean | SD | Not important | Slightly important | No opinion | Important | Very important |
|---|---|---|---|---|---|---|---|
| Technical support to open Access publication/deposit | 4.00 | 1.05 | 23 (6.6%) | 10 (2.9%) | 25 (7.2%) | 177 (50.9%) | 113 (32.5%) |
| Legal support to open Access publication/deposit (copyright issues) | 4.00 | 1.06 | 23 (6.6%) | 8 (2.3%) | 33 (9.5%) | 165 (47.4%) | 119 (34.2%) |
| System of quality assurance of Open Access publications | 4.02 | 1.12 | 30 (8.6%) | 4 (1.1%) | 21 (6.0%) | 168 (48.3%) | 125 (35.9%) |
| Existence of institutional OA repository | 3.85 | 1.12 | 31 (8.9%) | 4 (1.1%) | 50 (14.4%) | 164 (47.1%) | 99 (28.4%) |
| Existence of national OA repository | 3.80 | 1.13 | 31 (8.9%) | 5 (1.4%) | 62 (17.8%) | 155 (44.5%) | 95 (27.3%) |
| Existence of OA sharing community | 3.74 | 1.11 | 30 (8.6%) | 6 (1.7%) | 71 (20.4%) | 158 (45.4%) | 83 (23.9%) |
| Training/workshops for researchers | 4.07 | 1.17 | 26 (7.5%) | 14 (4.0%) | 28 (8.0%) | 120 (34.5%) | 160 (46.0%) |
| OA as mandatory requirement of research institutions | 3.67 | 1.22 | 35 (10.1%) | 19 (5.5%) | 66 (19.0%) | 134 (38.5%) | 94 (27.0%) |
| Existence of funded projects to publish in OA | 4.00 | 1.20 | 30 (8.6%) | 12 (3.4%) | 32 (9.2%) | 128 (36.8%) | 146 (42.0%) |
| Allocation of hours to publish in OA | 3.73 | 1.16 | 27 (7.8%) | 22 (6.3%) | 66 (19.0%) | 135 (38.8%) | 98 (28.2%) |
| OA publishing as specific criterion in researchers’ evaluation | 3.76 | 1.24 | 29 (8.3%) | 35 (10.1%) | 41 (11.8%) | 128 (36.8%) | 115 (33.0%) |
| Permission by publishers to deposit in institutional repositories | 3.64 | 1.45 | 66 (19.0%) | 9 (2.6%) | 26 (7.5%) | 132 (37.9%) | 115 (33.0%) |
| Mandatory requirement by funders of research projects | 3.55 | 1.41 | 65 (18.7%) | 10 (2.9%) | 37 (10.6%) | 141 (40.5%) | 95 (27.3%) |
[i] SD – Standard deviation; Mode in bold.