
1 Introduction
The improvement of living standards and the rapid development of technology are based on the consumption of energy resources. People relied on wood before the first industrial revolution. Later, the age of fossil fuel began, and humans started to utilize coal and petroleum (Züttel et al., 2010). Nowadays, the demand for energy is still increasing significantly, but utilization of conventional energy cannot afford human ambitions. Meanwhile, global warming and air pollution force people to decrease excessive fossil energy consumption, eventually to phase it out.
Therefore, national governments and research institutions try to discover alternative resources and to obtain sufficient supplies of energy in the future, such as nuclear power, solar energy, wind power, hydrogen energy, etc. Among the renewable energies, hydrogen serves as a zero-emission fuel (Dunn, 2002), which is friendly to the environment. Hydrogen can be utilized in different domains of daily life, like household heating, transport, and energy storage, which belong to essential sectors of the low-carbon energy system (Staffell et al., 2019).
Moreover, the preference for transportation needs to be changed to a more sustainable way (EHA, 2011). To date, the internal combustion engine has been the preferred drivetrain in the automobile industry. Recently, electric vehicles, including hydrogen fuel cell vehicles (HFCVs), are gaining more attention from society and serving as an alternative on sale.
The application of HFCVs brings new challenges to the provision of life safety and surrounding protection at an acceptable risk level (Pursell et al., 2019). The fuel for HFCV is usually compressed gaseous hydrogen (CGH2). Compared to gasoline and diesel, the different properties of hydrogen result in some new hazards. Hydrogen fire may also present different features from the conventional hydrocarbon fires.
Confined spaces, such as traffic tunnels, underground car parks, garages, and repair workshops, represent especially critical environments for hydrogen (Xu et al., 2019). Increasingly, tunnels are built as an essential infrastructure, especially to go through the rugged mountains as a city tunnel or beneath waterways. With the introduction of HFCVs, safety measures for preventing and managing incidents, accidents, fires, and explosions must be verified and updated (LaFleur et al., 2017).
A study on hydrogen jet fire suppressed by fine water mist on a fuel cell ship was conducted in Yuan et al. (2021), in which the computational domain of concern is a free space on the deck of the ship. Suppression effects of water mist on premixed hydrogen explosion and autoignition were studied in Xia et al. (2022) and Wang et al. (2024), respectively. A brief review was done in Xu et al. (2024) about hydrogen detonation mitigated by water sprays. This study focuses on the interaction between the water spray as a traditional mitigation measure and hydrogen fires in the semi-confined space in traffic tunnels.
The Fire Dynamics Simulator (FDS) is a computational fluid dynamics (CFD) code developed by the National Institute of Standards and Technology (NIST). The code models thermally driven flows by numerically solving a large-eddy simulation form of the low-speed Navier–Stokes equations, with an emphasis on the transport of smoke and heat from fires and the evolution of the fires themselves. Therefore, the FDS is chosen to mimic numerically the tunnel fire of hydrogen suppressed by water sprays.
2 Geometrical Model of Tunnel with HFCVs
2.1 Tunnel model
The accident scenario is assumed to take place in a two-way, two-lane single-tube tunnel with a rectangular cross section. The shape is often seen for traffic tunnels, underpasses, or underground car parks. The straight tunnel section is defined as 20 m long, 9 m wide, and 5.8 m high, containing three vehicles in the tunnel.
Ventilation is an important measure to control the atmospheric contamination in tunnels and to facilitate evacuations and firefighting operations in an emergency. A forced longitudinal ventilation is assumed for the tunnel model as a boundary condition, with a ventilation flow velocity of 3 m/s from one end to the other of the tunnel.
The spray nozzle is fixed on the ceiling of the tunnel. In an ideal case, the location of the nozzle is defined exactly above the hydrogen leakage location of the failed HFCV.
2.2 HFCV model and hydrogen source definition
According to the investigation of commercially available HFCVs, a general dimension of vehicle model is defined as 4.5 m long, 1.8 m wide, and 1.6 m high, with a ground clearance of 0.4 m. The hydrogen inventory of each HFCV is 5 kg at a pressure of 70 MPa.
The starting mass flow rates of hydrogen blowdown from storage pressure tanks of HFCV are defined as 0.05 kg/s, 0.1 kg/s, and 0.2 kg/s, respectively, which are the maximal flow rates at the beginning moment of blowdown. The three configurations correspond to different nozzle diameters of the thermally activated pressure relief device (TPRD) of the storage tank, 1.37 mm, 1.94 mm, and 2.74 mm, respectively. The H2 source is defined according to the EU HyTunnel-CS project descriptions in Pursell et al. (2019) and Xu et al. (2019). The mass flow rate decays with time as the tank depressurizes. The hydrogen is released horizontally.
The adiabatic hydrogen blowdown mass flow rates are shown in Figure 1.
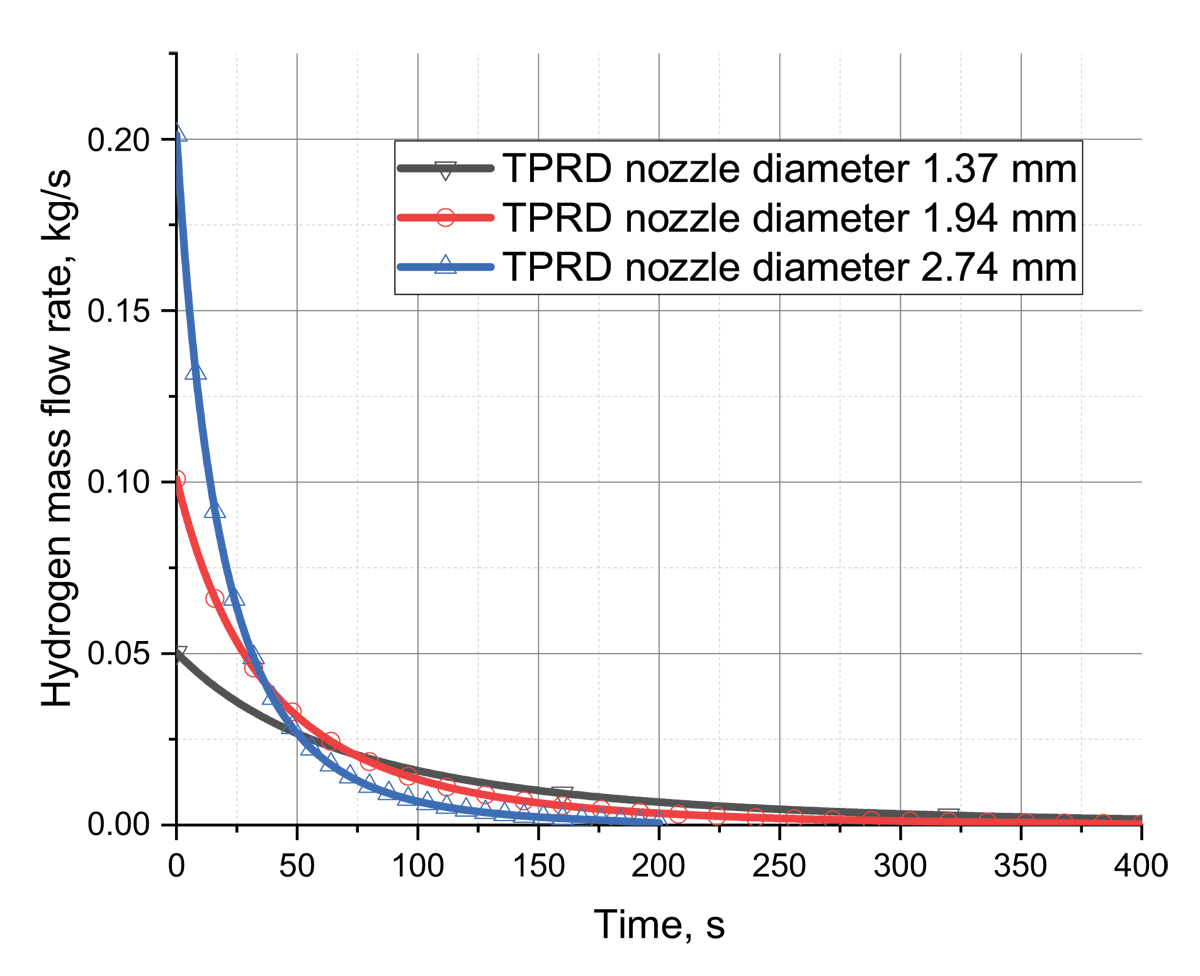
Figure 1
Hydrogen source definitions: blowdown hydrogen mass flow rates decaying along time, corresponding to thermally activated pressure relief device (TPRD) diameters of 1.37 mm, 1.94 mm, and 2.74 mm, respectively.
2.3 Numerical mesh
An adaptive mesh scheme is applied to the whole computational domain in the tunnel model. Refined mesh size is defined in the region of hydrogen fire close to the TPRD nozzle; coarse mesh is in the farther region. The total cell number is 11,160 for the 20 × 9 × 5.8 m3 domain with an average cell size of 0.454 m. The minimal cell size in the hydrogen fire region is 0.125 m, which is estimated based on the characteristic dimension of the hydrogen fire in the lower limit case of 0.05 kg/s of initial hydrogen blowdown mass flow rate. The mesh resolution satisfies the convergence criteria according to the numerical model definition in the FDS code. A grid sensitivity study also proved the claimed convergence of numerical solutions (Jiang, 2020).
The geometrical model with mesh is shown in Figure 2, which presents the traffic tunnel with three vehicle models. The blue point on the ceiling stands for the spray nozzle, while the red point beneath the vehicle model represents the hydrogen release nozzle (TPRD).
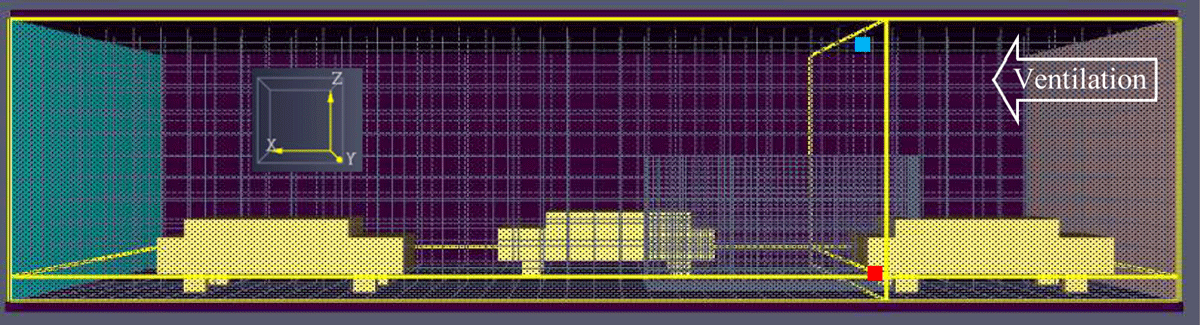
Figure 2
Tunnel geometrical model with adaptive mesh scheme with locations of hydrogen release and water injection.
It should be emphasized that the detailed structure of hydrogen jet flow is not simulated due to the coarse mesh scheme for computing efficiency consideration. However, this simplification does not influence the focus of the study on the thermal effect of hydrogen fire and the cooling effect of water spray because the local complicated jet structure hardly influences the overall thermal effect of the hydrogen fire averaged in the whole domain.
3 Theoretical Models
3.1 Lagrangian particle model
Liquid droplets of water spray are modeled as Lagrangian particles in the FDS code. The Lagrangian particle model focuses on the bi-directional coupling between gas and liquid phases, specifically the transfer of momentum, heat, and mass between the particles and the surrounding gases. The three main governing equations are formulated as follows:
Momentum equation:
where
md: droplet or particle mass, kg,
: droplet velocity, m/s,
rd: droplet radius, m,
ρg: surrounding gas density, kg/m3,
CD: drag coefficient, which is a function of Reynolds number of droplet,
: droplet velocity relative to gas, m/s,
Mass equation:
where
Ap,s: surface area of droplet, m2,
hm: mass transfer coefficient, m/s, which is relevant to Sherwood number and diffusion coefficient,
Yα,l: equilibrium vapor mass fraction,
Yα,g: vapor mass fraction.
Energy equation:
where
cd: specific heat of droplet liquid, J/(kg⋅K),
Td: droplet temperature, K,
Tg: gas temperature, K,
h: heat transfer coefficient, W/(m2⋅K), which is relevant to Nusselt number and gas thermal conductivity,
q̇r: thermal radiation rate of droplet, J/s,
hv; vaporization latent heat of liquid, J/kg.
3.2 Combustion model
In the hydrogen release scenario, hydrogen and air are initially unmixed, and the chemical kinetics are fast compared with mixing. Therefore, the turbulent combustion model of eddy dissipation concept (EDC) in the FDS code is applied in the simulations, which is based on a simple ‘burn on contact’ approximation. The details of the combustion model can be found in McGrattan et al. (2006).
4 Simulation Results
Common boundary conditions for simulations are ambient temperature: 20°C; ambient pressure: 101,325 Pa; relative humidity in air: 40%; gravity: 9.81 m/s2; and ventilation velocity (horizontal): 3 m/s (Xu et al., 2019).
General configurations for the spray model are operation pressure: 0.5 bar; droplet velocity: 5 m/s; spray angle: 60° to 75°; jet stream type: conical; and injected particles per second: 10,000.
A simulation case matrix is summarized in Table 1. The water mass flow rate for spray can be configured as 1.34 kg/s (‘s’) or 2.74 kg/s (‘l’). The droplet size can be configured as 100 μm (‘s’), 200 μm (‘m’), or 300 μm (‘l’).
Table 1
Simulation cases with variant hydrogen release rates, mass flow rates of spray water, and spray droplet sizes.
| WATER SPRAY | NO SPRAY | ||||||
|---|---|---|---|---|---|---|---|
| SMALL MASS FLOW RATE OF WATER (1.34 kg/s) | LARGE MASS FLOW RATE OF WATER (2.74 kg/s) | ||||||
| SMALL DROPLET (100 µm) | MEDIUM DROPLET (200 µm) | LARGE DROPLET (300 µm) | SMALL DROPLET (100 µm) | MEDIUM DROPLET (200 µm) | LARGE DROPLET (300 µm) | ||
| Small mass flow rate of H2 (max. 0.05 kg/s) | sss | ssm | ssl | sls | slm | sll | alpha |
| Large mass flow rate of H2 (max. 0.1 kg/s) | lss | lsm | lsl | lls | llm | lll | beta |
| Very large mass flow rate of H2 (max. 0.2 kg/s) | xlss | xlsm | xlsl | xlls | xllm | xlll | epsilon |
As described in Section 2.2, the hydrogen release rate can be 0.05 kg/s (‘s’), 0.1 kg/s (‘l’), or 0.2 kg/s (‘xl’).
The 21 simulation scenarios listed in Table 1 are simulated by using the FDS code. Representative output parameters like gas temperature, absolute humidity, and gas volume fraction in certain regions are computed as results to analyze the suppression effect of water spray in different configurations.
4.1 Flow field
The flow field in the tunnel model is simulated by solving the compressible fluid dynamic governing equations of mass, momentum, and energy. The spray droplet distribution is also simulated by solving the coupled Lagrangian particle dynamic equations. Figure 3 shows an example of flow field and spray droplet distributions in the case of initial max. 0.2 kg/s H2 release rate and 1.34 kg/s water spray with 100 μm droplet (Case ‘xlss’) during 2–3 s. Six time moments are selected to show the typical distribution patterns of the spray droplets (in blue). To show the velocity vectors in the major volume of the model, the upper limit of the color index for velocity is reduced.
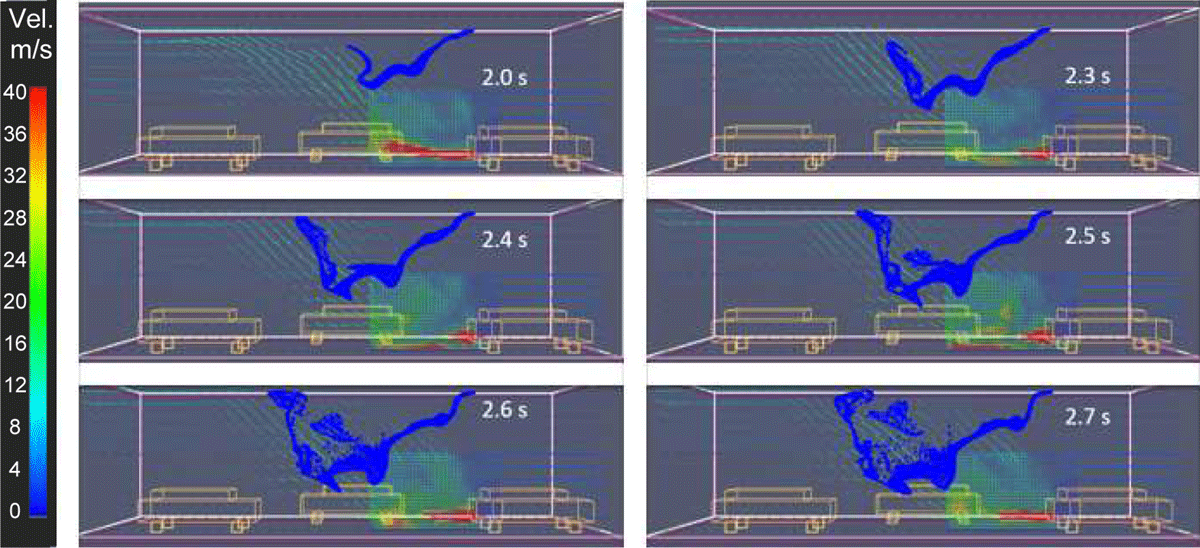
Figure 3
Velocity vector and spray droplet distribution in the computational domain of tunnel in case of initial max. 0.2 kg/s H2 release rate and 1.34 kg/s water spray with 100 μm droplet (Case ‘xlss’) during 2–3 s.
The maximal velocity (in red) is in the vicinity of TPRD, where hydrogen leaks from the vehicle. Right above the location of TPRD, the origin of the spray droplets is on the ceiling. As shown apparently in Figure 3, the horizontal ventilation flow from the right-hand side to the left entrains and disperses the spray droplet also from right to left. The ‘tail’ of the mist cloud (in blue) is even entrained upwards by gas dynamics due to the buoyancy-driven flow of the released hydrogen jet. The cloud of finer droplets is more easily carried downstream than the larger droplets, leading to longer transport trajectories that extend to the right.
4.2 Gas temperature
The main goal of the study is to investigate the cooling effect of spray. So concentrations are focused on the gas temperature in the tunnel, specifically in the downstream region from the leaking place to the tunnel portal, and the temperature at the tunnel exit. As an example, the temporal evolution of gas temperature distribution in a longitudinal vertical cut of the tunnel is shown in Figure 4 for the simulation case ‘lls’. The peak temperature is presented in the contour plots because the view plane cuts through the core region of hydrogen fire around the activated TPRD. The decrease in the fire dimension over time is primarily attributed to the decaying hydrogen release rate.
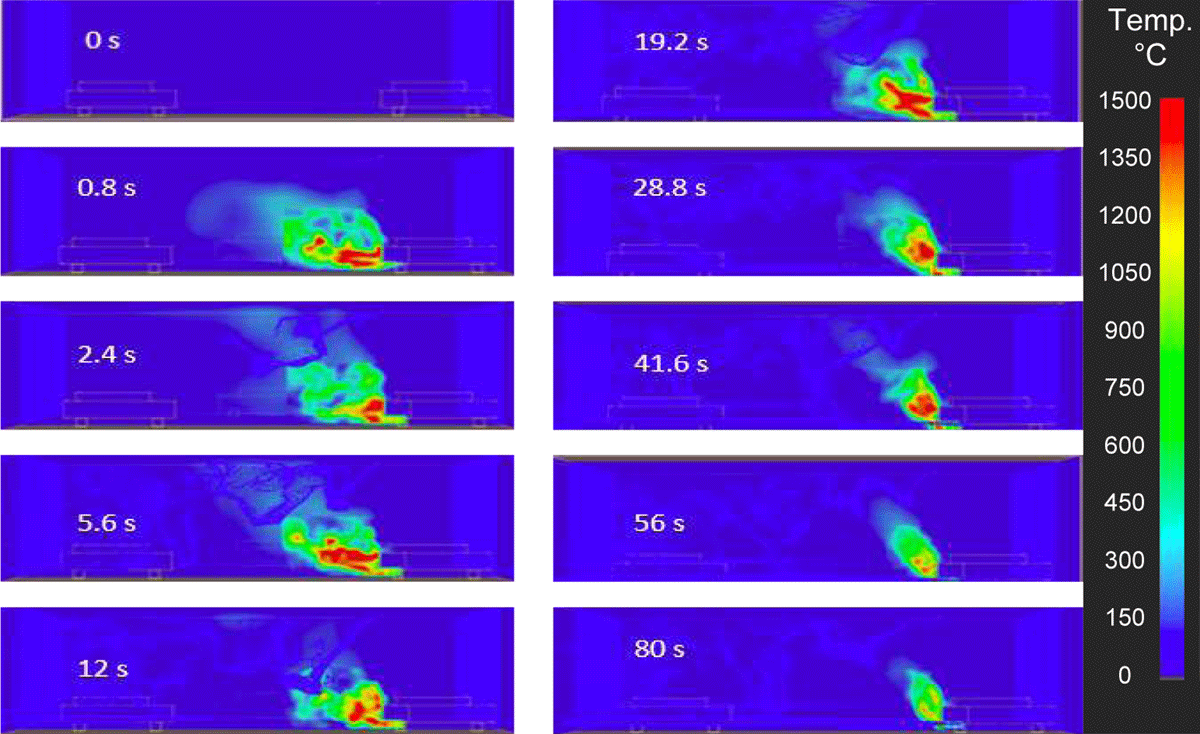
Figure 4
Temperature contour plots in a longitudinal vertical cut of tunnel through TPRD nozzle at different times in the case of initial max. 0.1 kg/s H2 release rate and 2.74 kg/s water spray with 100 μm droplet (Case ‘lls’).
The average gas temperatures of the whole gas volume in the downstream region, counted from the leaking location to the tunnel exit, are shown in Figure 5(a) for the simulation cases, as an example, of a 0.05 kg/s H2 release rate and a spray water mass flow rate of 1.34 kg/s, with different droplet size configurations. Due to hydrogen combustion, the atmospheric temperature in the tunnel climbs to a peak value, then decays over time, mainly because the hydrogen release rate decays. It is clear that the gas temperature (curve in black) is higher without a water spray than with water injection (curves in color). It proves the cooling effect of water spray. Furthermore, the smaller the droplet is, the lower the gas temperature becomes. It is rational that the fine droplets show a better cooling effect due to the larger surface area to volume ratio of the liquid phase.
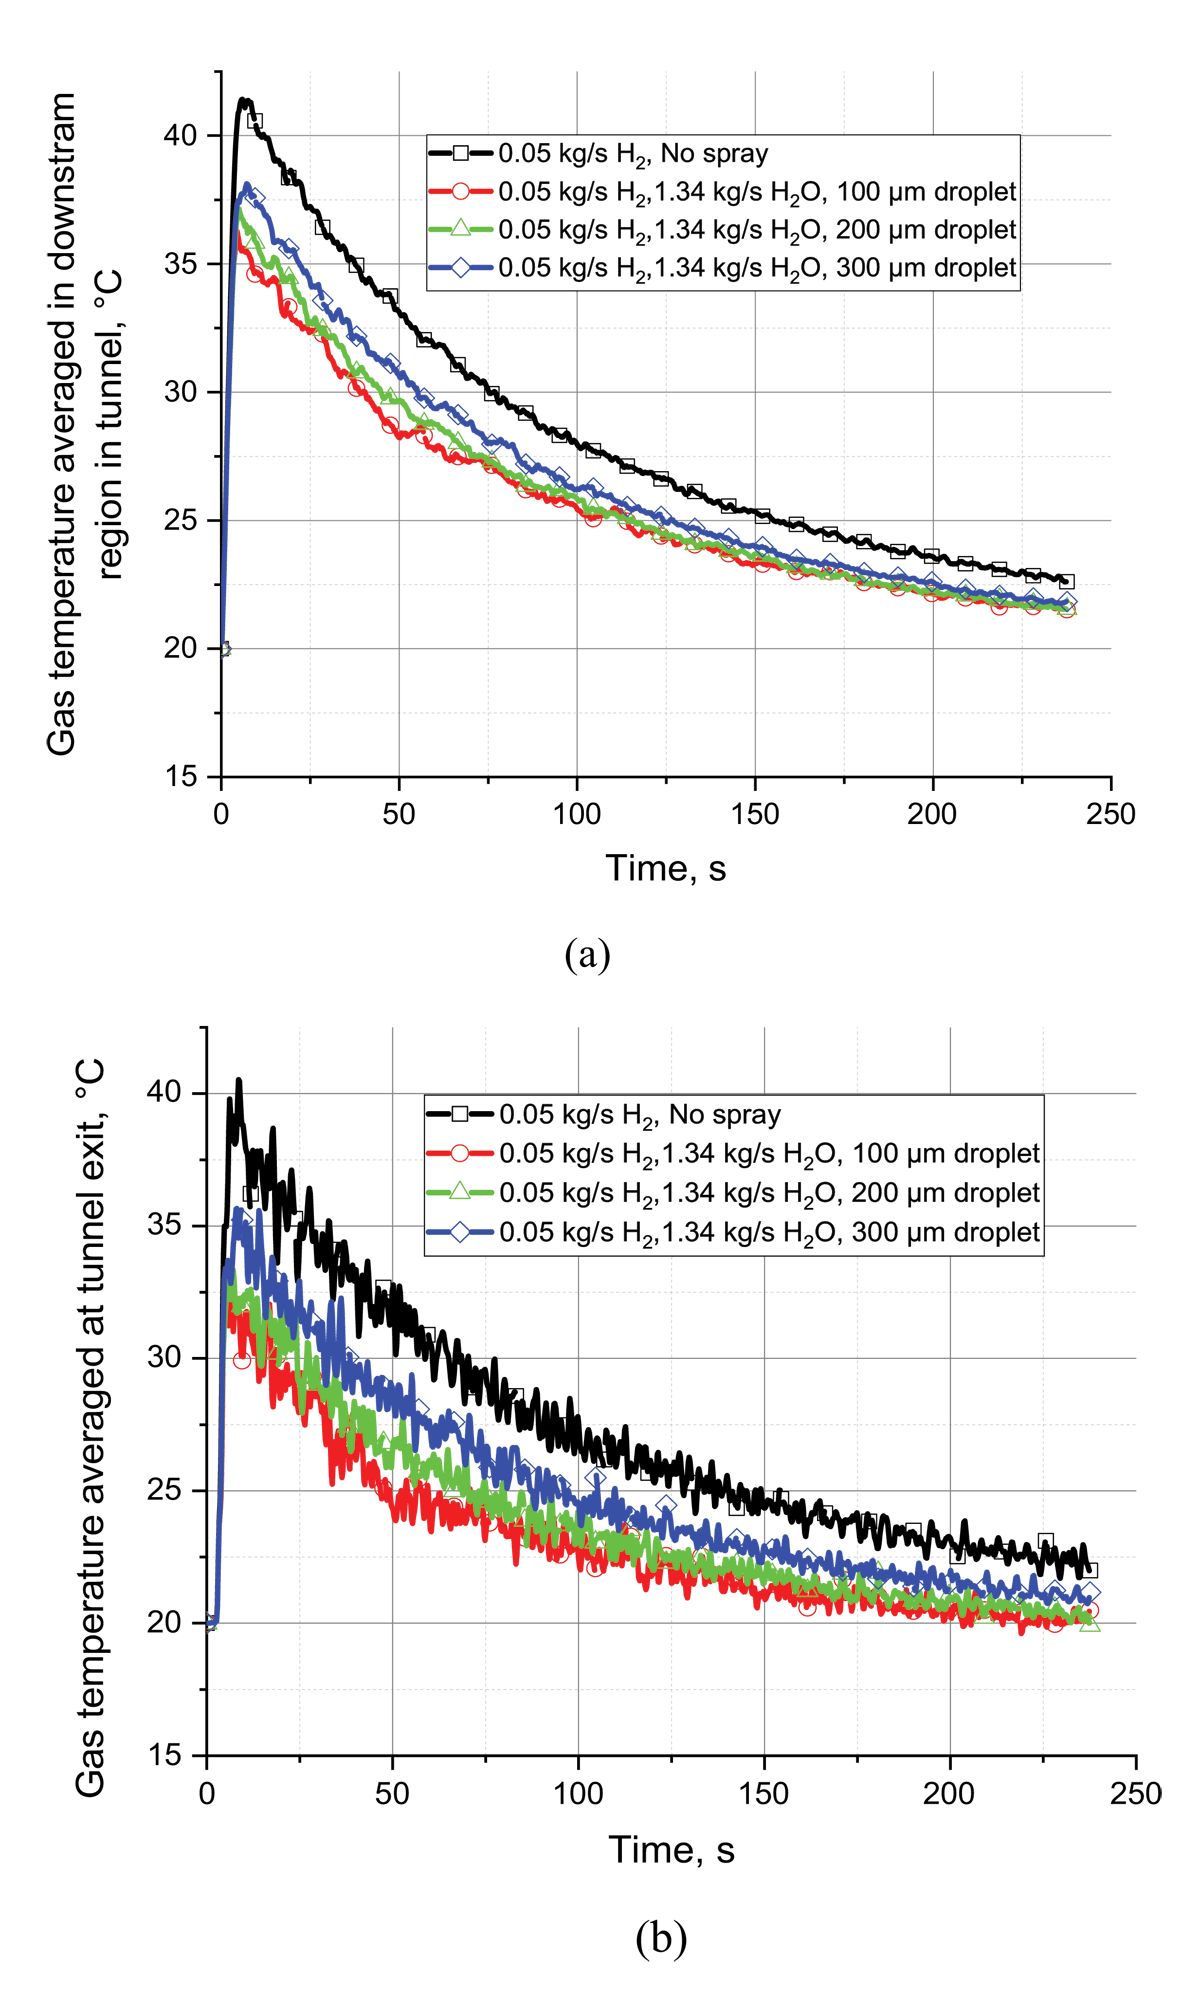
Figure 5
Average gas temperatures in the downstream region (a), and at tunnel exit (b), in case of 0.05 kg/s H2 release rate without and with spray of different droplet sizes.
Accordingly, the average gas temperatures at the tunnel portal (exit) are recorded in Figure 5(b). The curves show a similar evolution feature as those in (a), except for the stochastic oscillations. By comparing (a) and (b), the temperature at the tunnel exit is lower than the corresponding temperature in the downstream region by 3–5°C, because the portal is the farthest location from the hydrogen fire center.
In the case of a ‘very large’ H2 release rate of 0.2 kg/s, as shown in Figure 6(a), the suppression effects of different spray water mass flow rates are compared. The plot manifests that the larger water injection flow rate (2.74 kg/s) presents a better cooling effect than the smaller one (1.34 kg/s) most of the time. It is certain that more droplets produce more chances to evaporate when they encounter hot gases generated from the hydrogen fire, where explicit heat is converted into latent heat of vaporization. Thus, it performs better to cool down the hot atmosphere. However, as shown in the zoomed view of Figure 6(b), it is not so at the starting stage. During 1.5–3.5 s, the gas temperature for the larger water mass flux (in blue) is even higher than that of the smaller flux (in red). One logical explanation could be that the turbulence caused by spray intensified the hydrogen combustion in the case of the 2.74 kg/s water flow rate. The phenomenon of spray-enhanced hydrogen combustion is also formulated in literature, such as Thomas (2000).
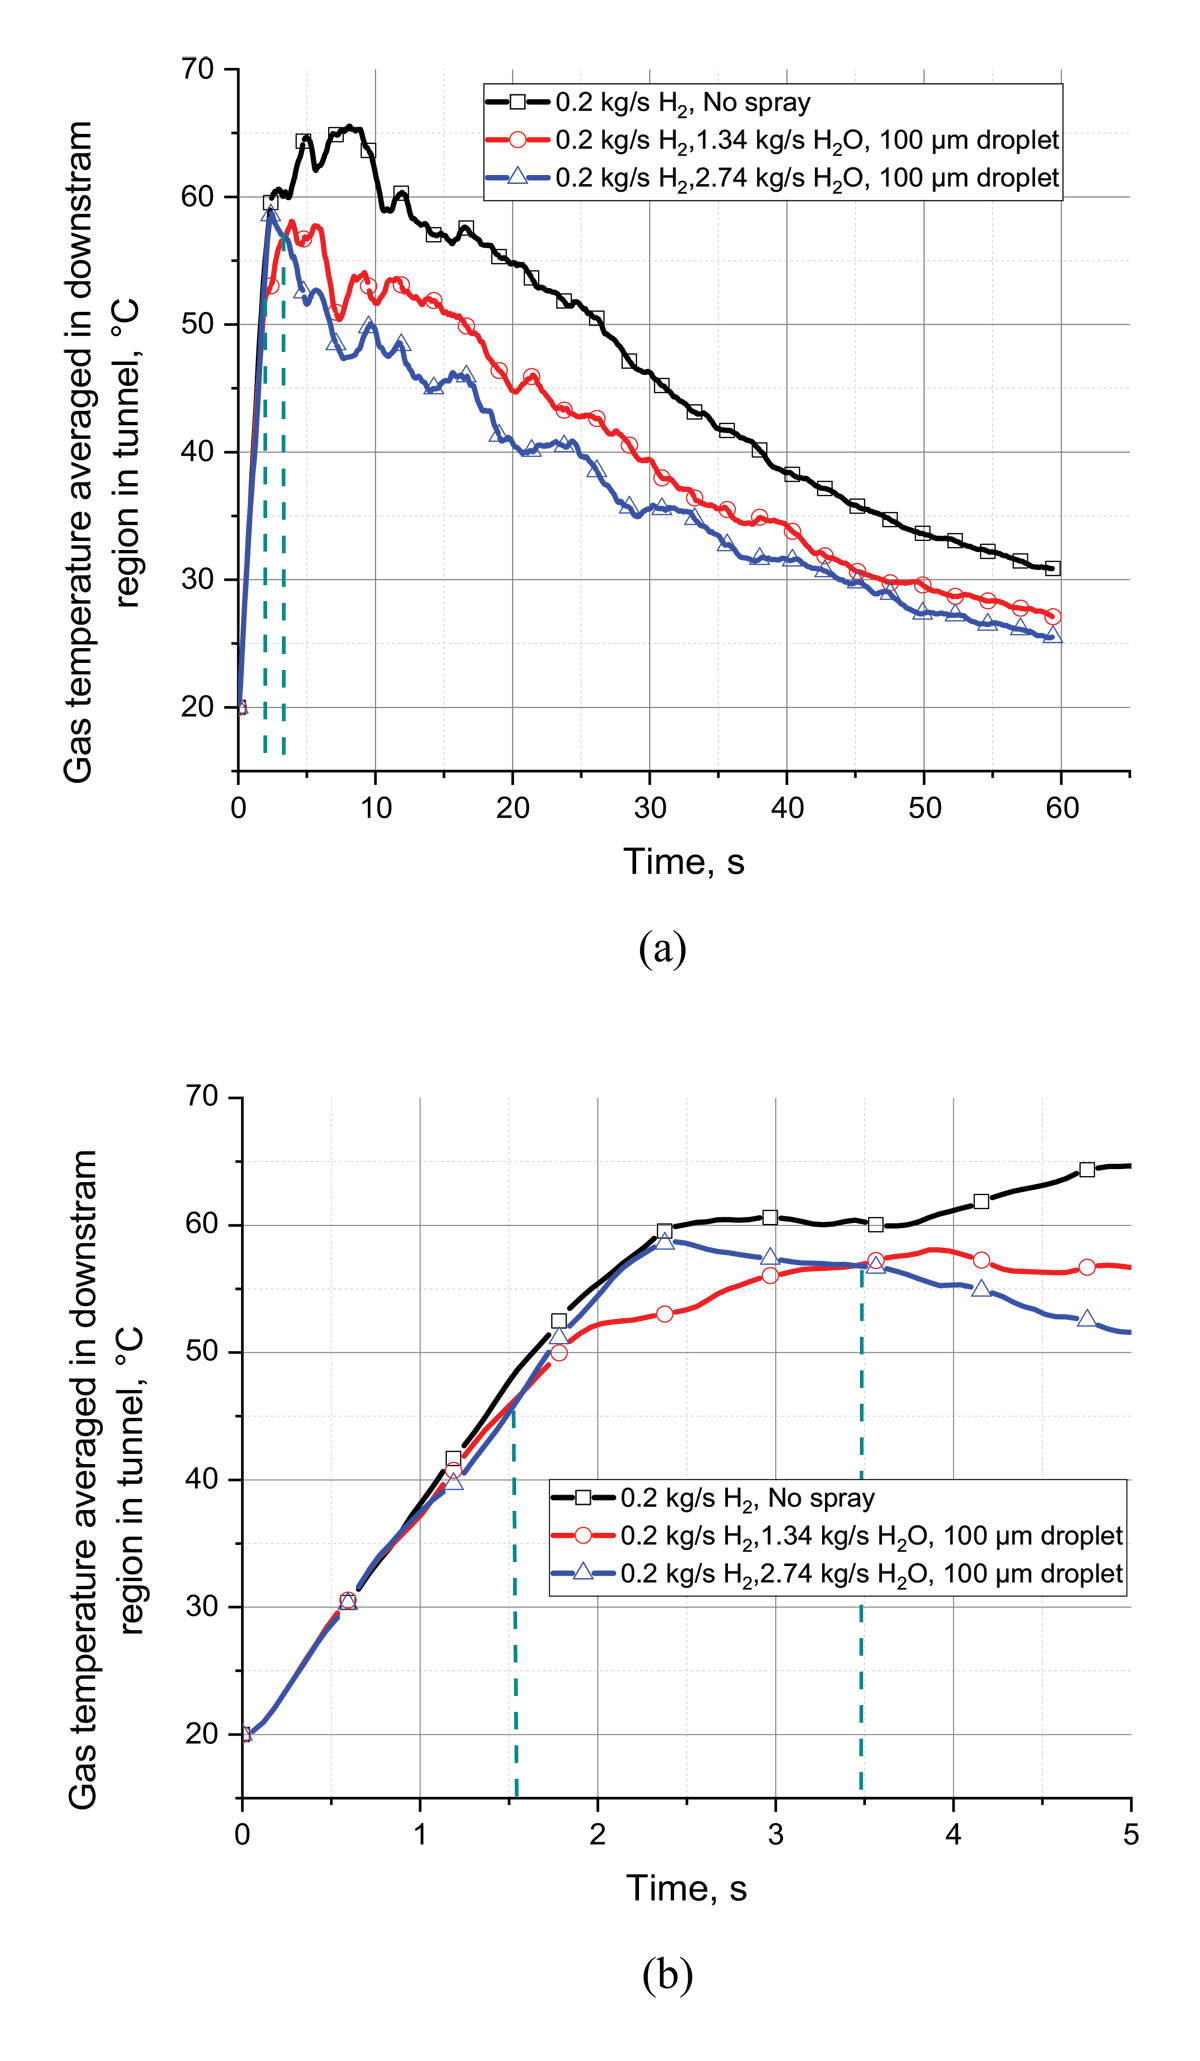
Figure 6
Average gas temperatures in the downstream region in case of 0.2 kg/s H2 release rate without and with spray of different water mass flow rate: (a) whole view; (b) zoomed view during 0–5 s, showing the intensified turbulence effect caused by spray.
4.3 Humidity
The average absolute humidity in the tunnel atmosphere is computed in the interaction between hydrogen fire and water spray. The absolute humidity is defined as the measure of the actual mass of water vapor present in a given volume of air. Figure 7(a) shows the humidity evolution in the case of a small H2 release rate of 0.05 kg/s. Both hydrogen combustion and evaporation of spray droplets contribute vapor. Due to these two reasons, the vapor content in the air increases to a peak value then decreases gradually, as the available amount of hydrogen for combustion decays with time. As indicated in the plot, the humidity is higher with water sprays than in the dry case. It manifests that vaporization dominates the interacting process between fire and liquid water in most of the time.
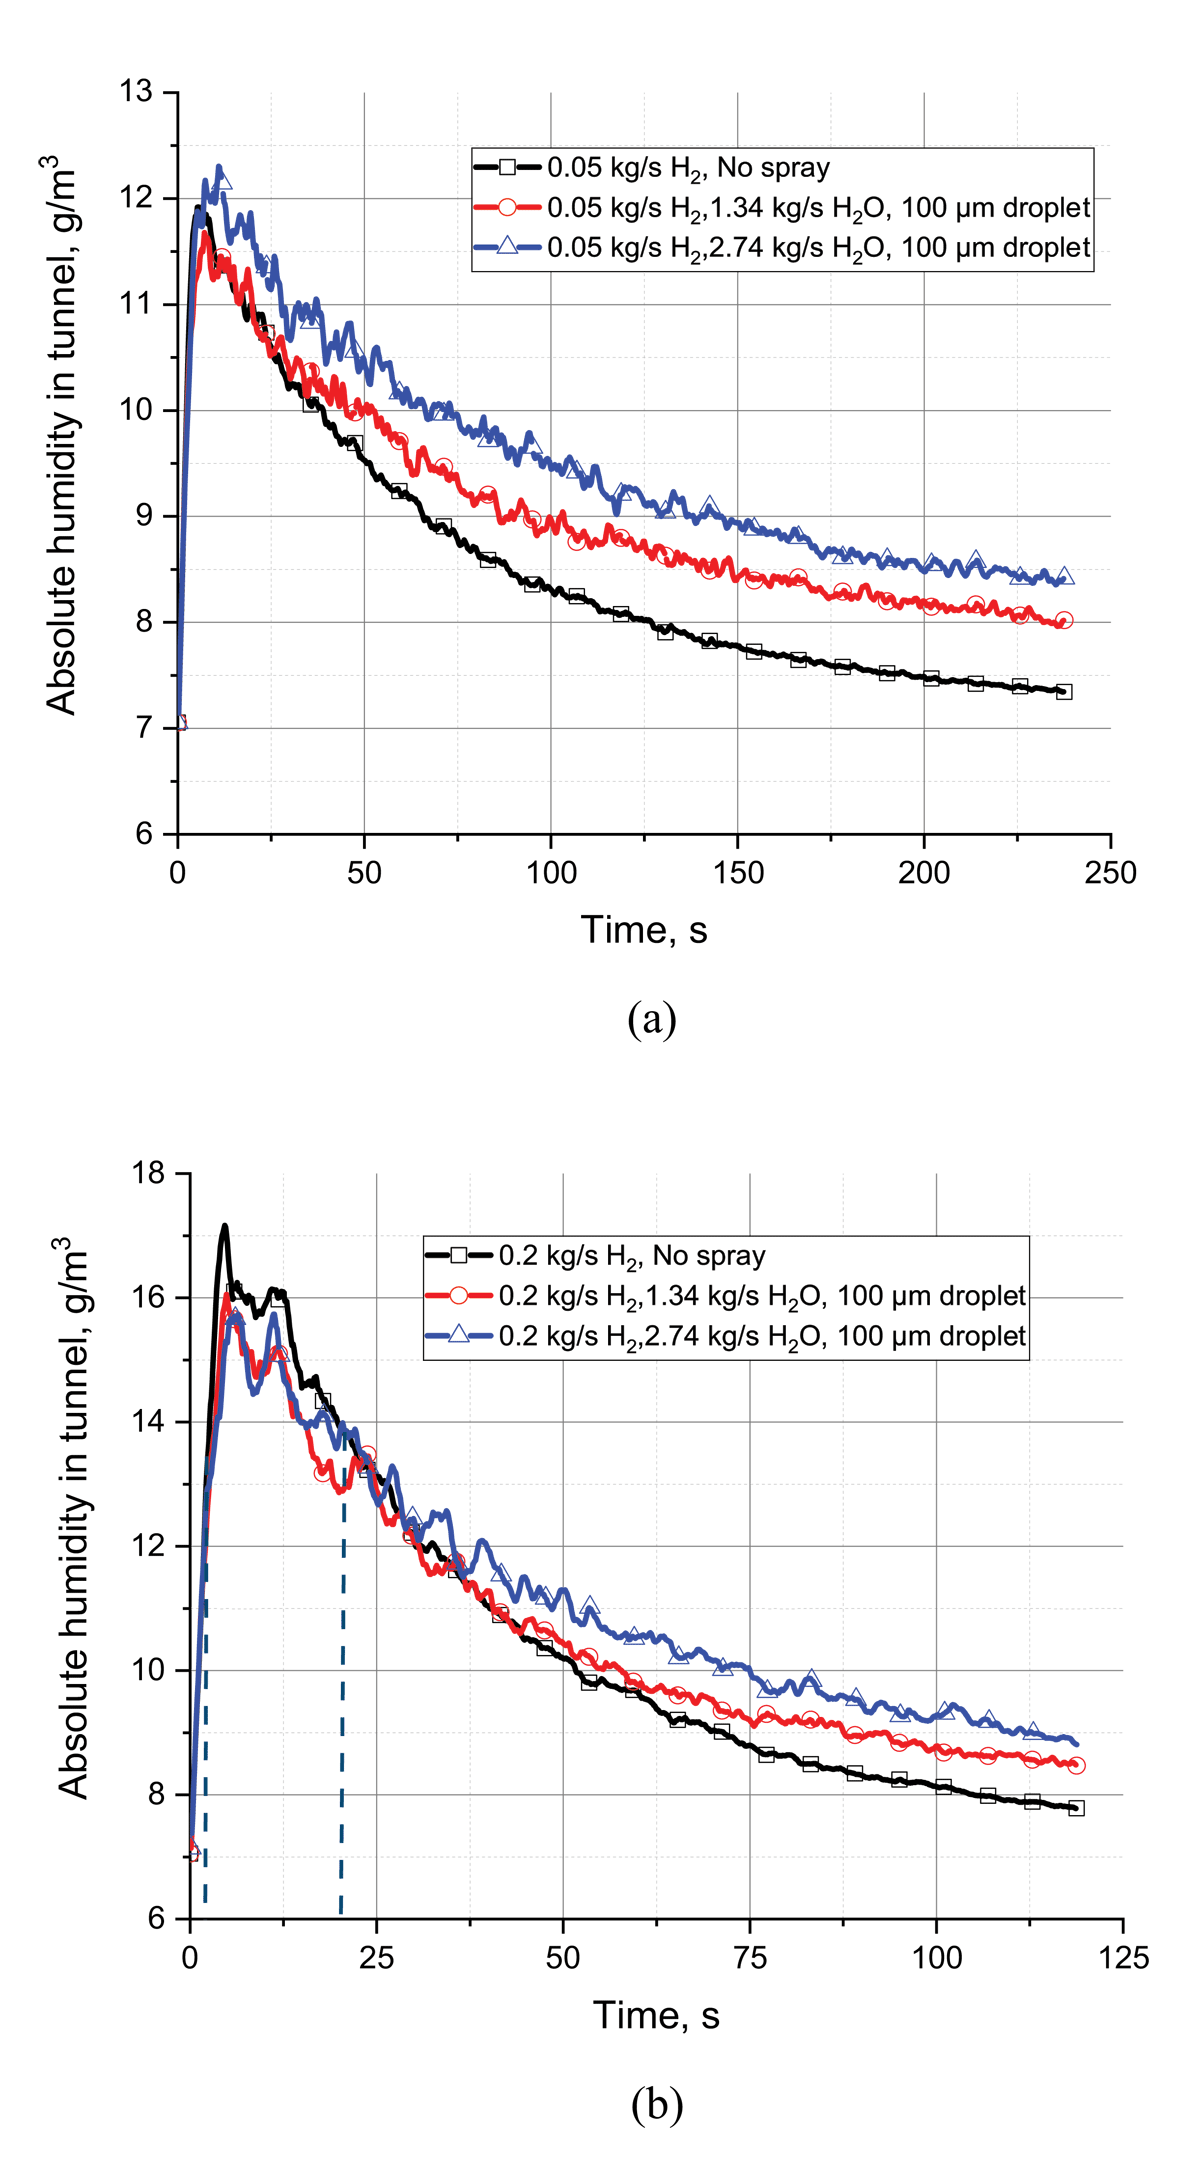
Figure 7
Average absolute humidity in tunnel atmosphere: (a) small H2 release rate (0.05 kg/s); (b) very large H2 release rate (0.2 kg/s), without and with spray of different water mass fluxes.
In the case of a large H2 mass flow rate of 0.2 kg/s, the peak value of absolute humidity, 15.7–17.2 g/m3 in Figure 7(b), is greater than the peak value of 11.7–12.3 g/m3 in Figure 7(a) for the case of the small H2 release rate. More vapor in the air is certainly contributed by the combustion product (steam) because more hydrogen is burned in the larger release rate case. It is interesting that, as shown in Figure 7(b), the humidity in the wet cases is even lower than that in the dry case at the earlier stage of about 20 s. It implies that the hot vapor generated by combustion is cooled down by the spray water and partially condensates into liquid, which brings a decreased humidity in the air during that time. In other words, the cooling effect of the spray causes condensation that is stronger than the evaporation of the water. In the interaction between combustion and spray, the humidity is increased by the water evaporation; meanwhile, the vapor content in the air can be reduced due to condensation caused by the cooling spray. Therefore, the humidity in the air is a compromise between the two competing effects. In the case of a small H2 release rate, evaporation dominates the process at all times; however, condensation prevails at the earlier 20 s in the case of a large H2 release rate. In this case, inversion occurs at about 25 s, as shown in Figure 7(b), after which evaporation takes over.
5 Conclusions
Water spray can effectively decrease the temperature of hot products of hydrogen fire in tunnels. Spraying with fine droplets has a better cooling effect than that with larger droplets, due to the larger surface-to-volume ratio of liquid phase. In some circumstances, spray-induced turbulence may intensify hydrogen combustion, which is a potential disadvantage of water spray. The steam fraction in air increases due to the evaporation of the injected droplets and the production of hydrogen combustion. The increased humidity in the tunnel proves that the hydrogen combustion heat is transferred partially to liquid droplets or converted partially to the latent heat of vapor. In other words, water spray can suppress hydrogen fire in a tunnel in the sense of cooling; however, it is not recommended as an effective extinguisher for hydrogen fires.
Competing Interests
Thomas Jordan is the Editor in Chief of Hydrogen Safety. He was removed from all editorial processes in handling this paper. The authors have no other competing interests to declare.