
Fig.1
![Relative permittivity (top curves) and conductivity (S/m) (bottom curves) of the bone marrow. In the figure above, maximum and minimum permittivity and conductivity limits of bone marrow are shown [9].](https://sciendo-parsed.s3.eu-central-1.amazonaws.com/64721f2a215d2f6c89dbca2c/j_jeb.3944_fig_001.jpg?X-Amz-Algorithm=AWS4-HMAC-SHA256&X-Amz-Content-Sha256=UNSIGNED-PAYLOAD&X-Amz-Credential=AKIA6AP2G7AKOUXAVR44%2F20251208%2Feu-central-1%2Fs3%2Faws4_request&X-Amz-Date=20251208T104839Z&X-Amz-Expires=3600&X-Amz-Signature=06f9cb3dc718ee5ce0fc43bbefaa72f5770120a21a9ff65f52c70457f77261c7&X-Amz-SignedHeaders=host&x-amz-checksum-mode=ENABLED&x-id=GetObject)
Fig.2
![Permittivity (top curves) and conductivity (S/m) (bottom curves) for the cortical bone [10].](https://sciendo-parsed.s3.eu-central-1.amazonaws.com/64721f2a215d2f6c89dbca2c/j_jeb.3944_fig_002.jpg?X-Amz-Algorithm=AWS4-HMAC-SHA256&X-Amz-Content-Sha256=UNSIGNED-PAYLOAD&X-Amz-Credential=AKIA6AP2G7AKOUXAVR44%2F20251208%2Feu-central-1%2Fs3%2Faws4_request&X-Amz-Date=20251208T104839Z&X-Amz-Expires=3600&X-Amz-Signature=9ba95728dea347e0bc5c30fa8bb24743d9a14f69857a2fcc0de6522d6ed09288&X-Amz-SignedHeaders=host&x-amz-checksum-mode=ENABLED&x-id=GetObject)
Fig.3
![The obtained model of the bone tissue in CST software. Density in the figure (a) is 7% and in the figure (b) is 0.3% [11].](https://sciendo-parsed.s3.eu-central-1.amazonaws.com/64721f2a215d2f6c89dbca2c/j_jeb.3944_fig_003.jpg?X-Amz-Algorithm=AWS4-HMAC-SHA256&X-Amz-Content-Sha256=UNSIGNED-PAYLOAD&X-Amz-Credential=AKIA6AP2G7AKOUXAVR44%2F20251208%2Feu-central-1%2Fs3%2Faws4_request&X-Amz-Date=20251208T104839Z&X-Amz-Expires=3600&X-Amz-Signature=f64f7e416c95d9f561e28e84f79fbd1fcbc2bcbd7972206c477a5e255734f462&X-Amz-SignedHeaders=host&x-amz-checksum-mode=ENABLED&x-id=GetObject)
Fig.4
![Comparison of the permittivity and conductivity (S/m) obtained from the results of our model and properties of cancellous bone extracted from [10]. Dotted and dashed curves are model results corresponding to maximum and minimum properties of the bone marrow tissue, compared with experimental results of [10] which is shown with solid line.](https://sciendo-parsed.s3.eu-central-1.amazonaws.com/64721f2a215d2f6c89dbca2c/j_jeb.3944_fig_004.jpg?X-Amz-Algorithm=AWS4-HMAC-SHA256&X-Amz-Content-Sha256=UNSIGNED-PAYLOAD&X-Amz-Credential=AKIA6AP2G7AKOUXAVR44%2F20251208%2Feu-central-1%2Fs3%2Faws4_request&X-Amz-Date=20251208T104839Z&X-Amz-Expires=3600&X-Amz-Signature=fa577c81349b342b50178cfbdb2679e83db84407d54cd982c50043c3592d4c2d&X-Amz-SignedHeaders=host&x-amz-checksum-mode=ENABLED&x-id=GetObject)
Fig.5
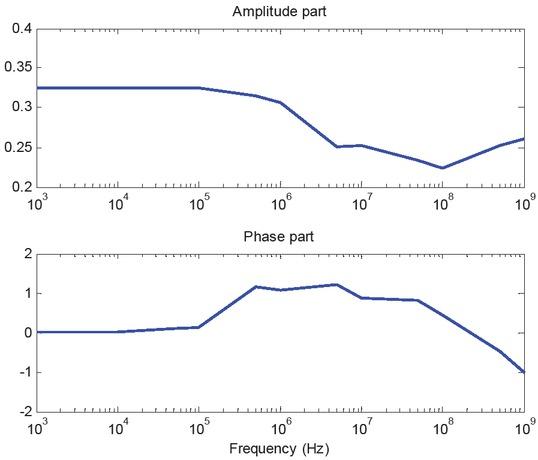
Admittance (Y=1/Z) for 10 percent bone density
| Frequency | Admittance (mS) | |
|---|---|---|
| (Hz) | Real Part | Imaginary Part |
| 1K | 0.9340 | 0.0017487 |
| 5K | 0.9340 | 0.005356 |
| 10K | 0.9340 | 0.007956 |
| 50K | 0.9340 | 0.0138023 |
| 100K | 0.9340 | 0.0219348 |
| 500K | 0.9369 | 0.0450018 |
| 1M | 0.9399 | 0.0615236 |
| 5M | 0.9604 | 0.1330 |
| 10M | 1.2003 | 0.2274 |
| 50M | 1.3490 | 1.0398 |
| 100M | 1.4517 | 1.9395 |
| 500M | 1.6251 | 8.8706 |
| 1G | 2.0659 | 16.3413 |
Admittance (Y=1/Z) for 30 percent bone density
| Frequency | Admittance (mS) | |
|---|---|---|
| (Hz) | Real Part | Imaginary Part |
| 1K | 0.7049 | 0.0016069 |
| 5K | 0.7049 | 0.004280 |
| 10K | 0.7049 | 0.0062451 |
| 50K | 0.7049 | 0.0116188 |
| 100K | 0.7049 | 0.0182412 |
| 500K | 0.7115 | 0.048474 |
| 1M | 0.7181 | 0.0604440 |
| 5M | 0.7652 | 0.1226 |
| 10M | 0.9561 | 0.1963 |
| 50M | 1.0818 | 0.8582 |
| 100M | 1.1740 | 1.5945 |
| 500M | 1.3562 | 7.0695 |
| 1G | 1.8717 | 12.9255 |