
Fig.1
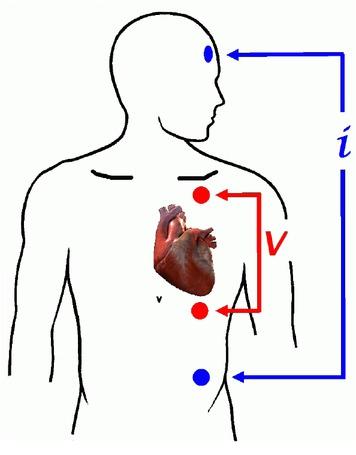
Fig.2
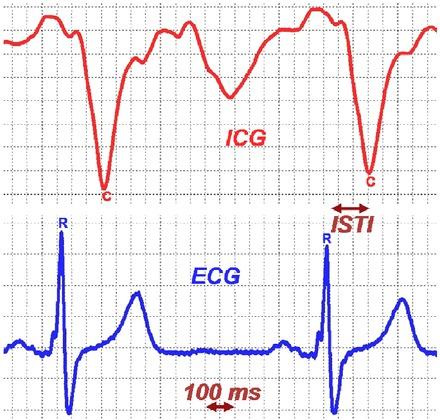
Fig.3
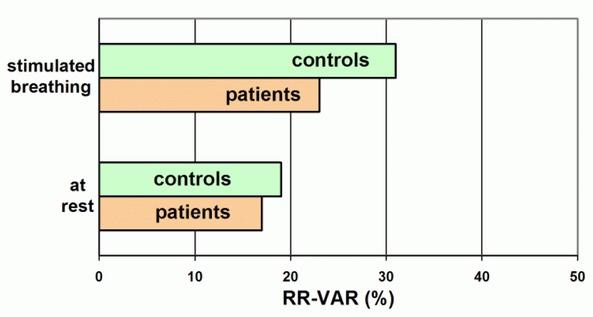
Fig.4
ISTI-interval ± S_D_ [ms] in the group of patients with Parkinson’s disease and in the group of control subjects while breathing at rest and during stimulated, deep breathing at 0_1 Hz_
| subjects | ISTI [ms] at rest | ISTI [ms] stimulated |
|---|---|---|
| controls (24) | 145 ± 14 | 147 ± 10 |
| patients (18) | 143 ± 17 | 147 ± 19 |
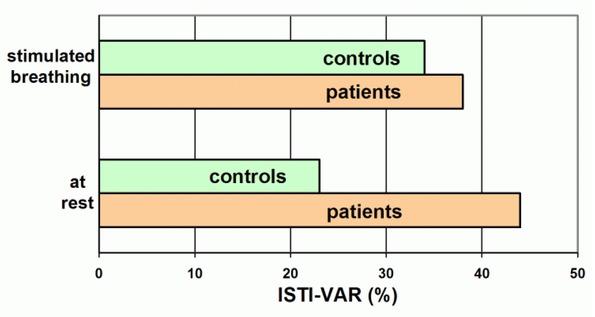
Variability in ISTI (ISTI-VAR) ± S_D_ [%] in the group of patients with Parkinson’s disease and in the group of control subjects while breathing at rest and during stimulated, deep breathing at 0_1 Hz_
| subjects | ISTI-VAR [%] at rest | ISTI-VAR [%] stimulated |
|---|---|---|
| controls (24) | 23 ± 15 | 34 ± 17 |
| patients (18) | 44 ± 40 | 38 ± 20 |
Variability in RR-interval (RR-VAR) ± S_D_ [%] in the group of patients with Parkinson’s disease and in the group of control subjects while breathing at rest and during stimulated, deep breathing at 0_1 Hz_
| subjects | RR-VAR [%] at rest | RR-VAR [%] stimulated |
|---|---|---|
| controls (24) | 19 ± 10 | 31 ± 12 |
| patients (19) | 17 ± 7 | 23 ± 10 |
RR-interval ± S_D_ [ms] in the group of patients with Parkinson’s disease and in the group of control subjects while breathing at rest and during stimulated, deep breathing at 0_1 Hz_
| subjects | RR [ms] at rest | RR [ms] stimulated |
|---|---|---|
| controls (24) | 990 ± 180 | 990 ± 170 |
| patients (19) | 940 ± 170 | 940 ± 170 |