
Figure 1
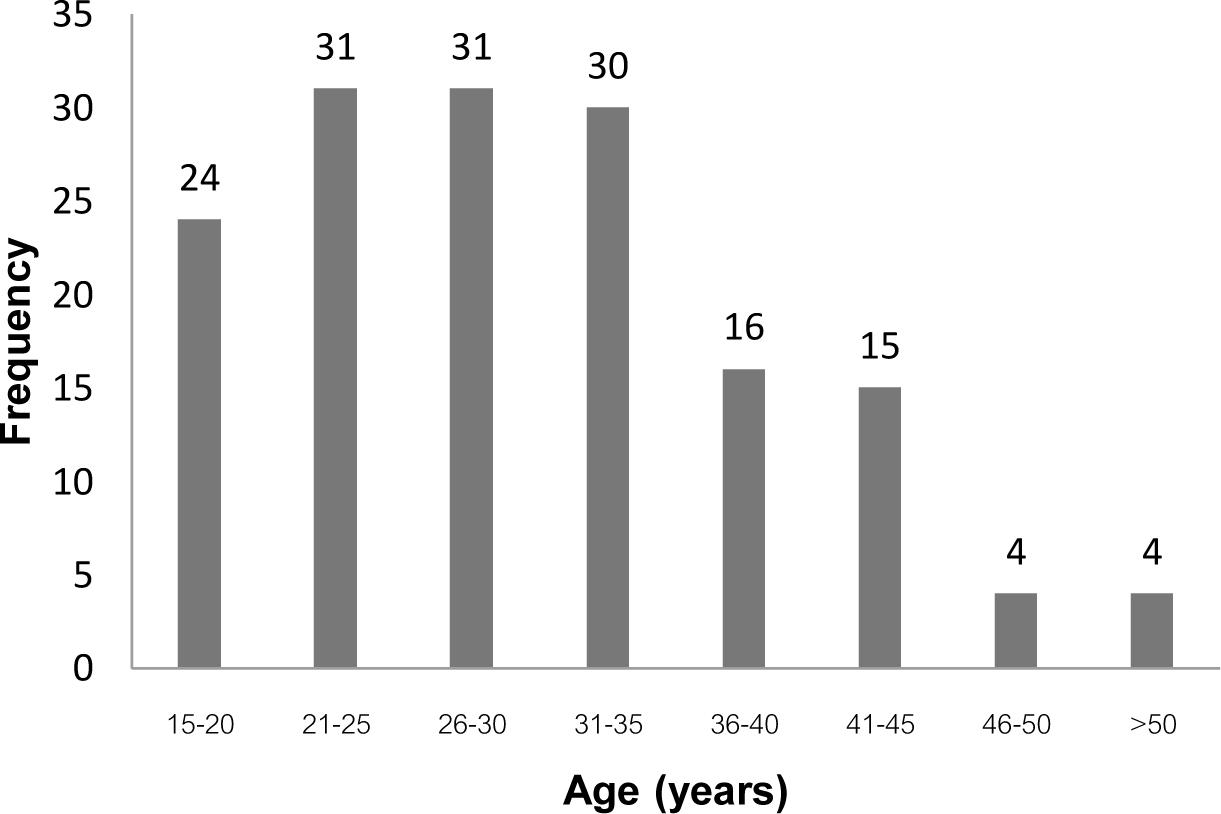
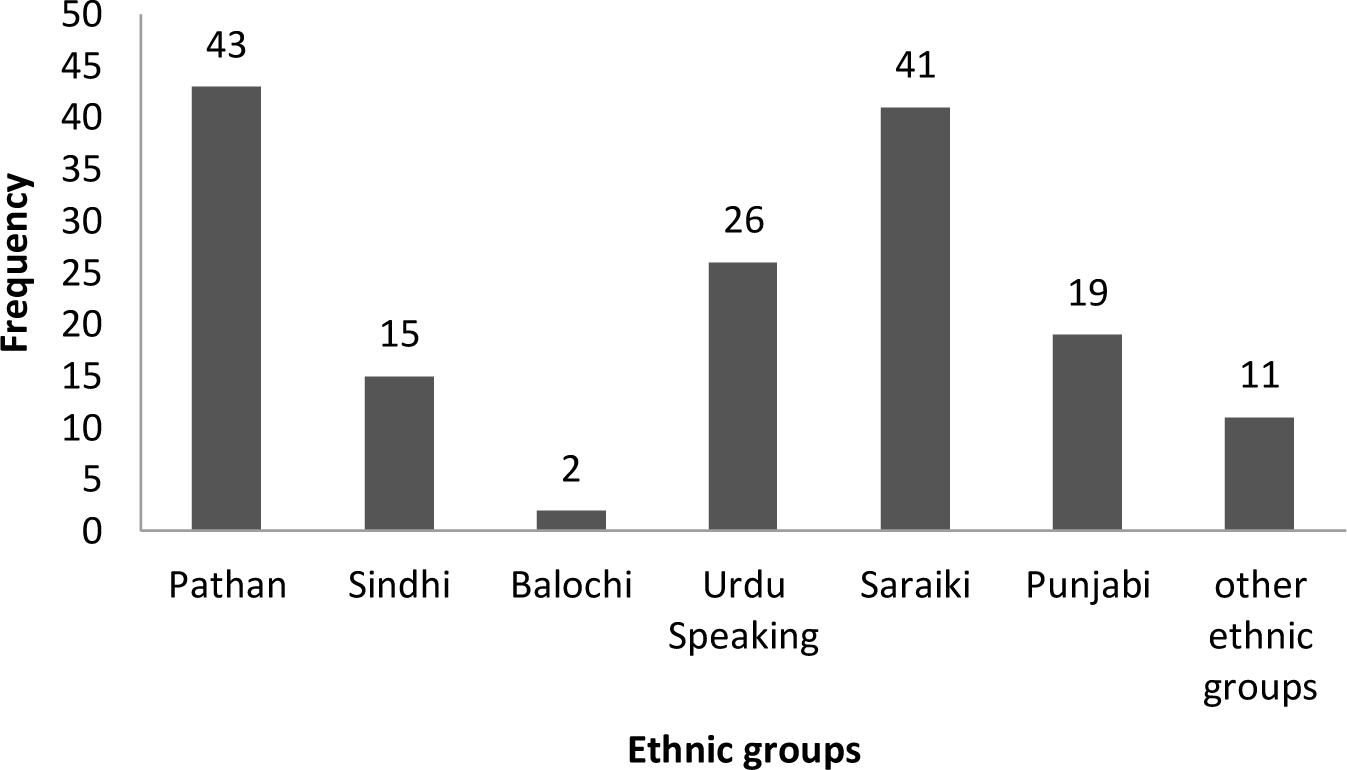
Figure 2
Epidemiological characteristics of patients (n = 495)
| Variables | Peshawar n = 164 | Multan n = 165 | Karachi n = 166 | Total n = 495 |
|---|---|---|---|---|
| Age (years) (mean ± SD) | 27.6 ± 11.0 | 31.7 ± 10.7 | 31.0 ± 10.3 | 30.1 ± 11.0 P > 0.05 |
| Ethnic distribution of patients | ||||
| Pathan | 142 (86.6) | 7 (4.2) | 19 (11.4) | 168 (33.9) |
| Saraiki | – | 113 (68.5) | 17 (10.2) | 130 (26.3) |
| Urdu speaking | – | 24 (14.5) | 40 (24.1) | 64 (12.9) |
| Punjabi | – | 19 (11.5) | 21 (12.6) | 40 (8.1) |
| Sindhi | – | – | 38 (22.9) | 38 (7.7) |
| Balochi | – | 2 (1.2) | 17 (10.2) | 19 (3.8) |
| Other ethnic groups Afghani Pathans, Bengalis, Hindkowans, Persians, Chitralis, and Baltis. | 22 (13.4) | 14 (8.4) | 36 (7.3) | |
| Sex | ||||
| Male | 112 (68.3) | 119 (72.1) | 109 (65.7) | 340 (68.7) |
| Female | 52 (31.7) | 46 (27.9) | 57 (34.3) | 155 (31.3) |
| Marital status | ||||
| Married | 91 (55.5) | 125 (75.8) | 127 (76.5) | 343 (69.3) |
| Single | 73 (44.5) | 40 (24.2) | 39 (23.5) | 152 (30.7) |
| Family history of HBV infection | ||||
| Yes | 72 (56.7) | 76 (46.1) | 65 (39.2) | 213 (43.0) |
| No | 92 (43.3) | 89 (53.9) | 101(60.8) | 282 (57.0) |
Age, serum alanine transaminase level, and viral load of the patients with different serological conditions (N = 495)
| Variable | HBeAg negative without detectable DNA | HBeAg-positive patients | HBeAg negative with detectable DNA | P |
|---|---|---|---|---|
| n | 259 | 81 | 155 | |
| Age (years) | ||||
| Mean ± SD | 31.2 ± 11.4 | 25.3 ± 10.6 | 30.6 ± 9.9 | <0.01 |
| Alanine transaminase (IU/L) | ||||
| Mean ± SD | 32.9 ± 24.4 | 61.5 ± 49.6 | 35.4 ± 17.3 | <0.01 |
| Hepatitis B virus DNA (log10 copies/mL) | ||||
| Mean | – | 6.9 ± 1.7 | 4.4 ± 1.4 | >0.05 |
Biochemical, serological, and virological characteristics of patients (n = 495)
| Variable | Peshawar | Multan | Karachi | Total | P |
|---|---|---|---|---|---|
| n | 164 | 165 | 166 | 495 | |
| Alanine transaminase (IU/L) | |||||
| Mean ± SD | 38.0 ± 26.1 | 37.0 ± 60.4 | 43.67 ± 36.1 | 39.6 ± 43.3 | >0.05 |
| HBV DNA detected by PCR | 80 (48.8%) | 65 (39.4%) | 91 (54.8%) | 236 (47.7%) | – |
| HBV DNA (log10 copies/ml) | |||||
| Mean ± SD | 5.5 ± 2.2 | 5.1 ± 2.1 | 5.2 ± 1.7 | 5.3 ± 1.7 | >0.05 |
| HBeAg positive | 37 (22.6%) | 19 (11.5%) | 25 (15.1%) | 81(16.4%) | – |
| HBeAg negative | 127 (77.4%) | 146 (88.5%) | 141 (84.9%) | 414 (83.6%) | – |
| HBeAg negative without detectable DNA | 84 (51.2%) | 100 (60.2%) | 75 (45.2%) | 259 (52.3%) | – |
| HBeAg negative with detectable DNA | 43 (27.5%) | 46 (29.7%) | 66 (42.6%) | 155 (31.3%) | – |