
Figure 1
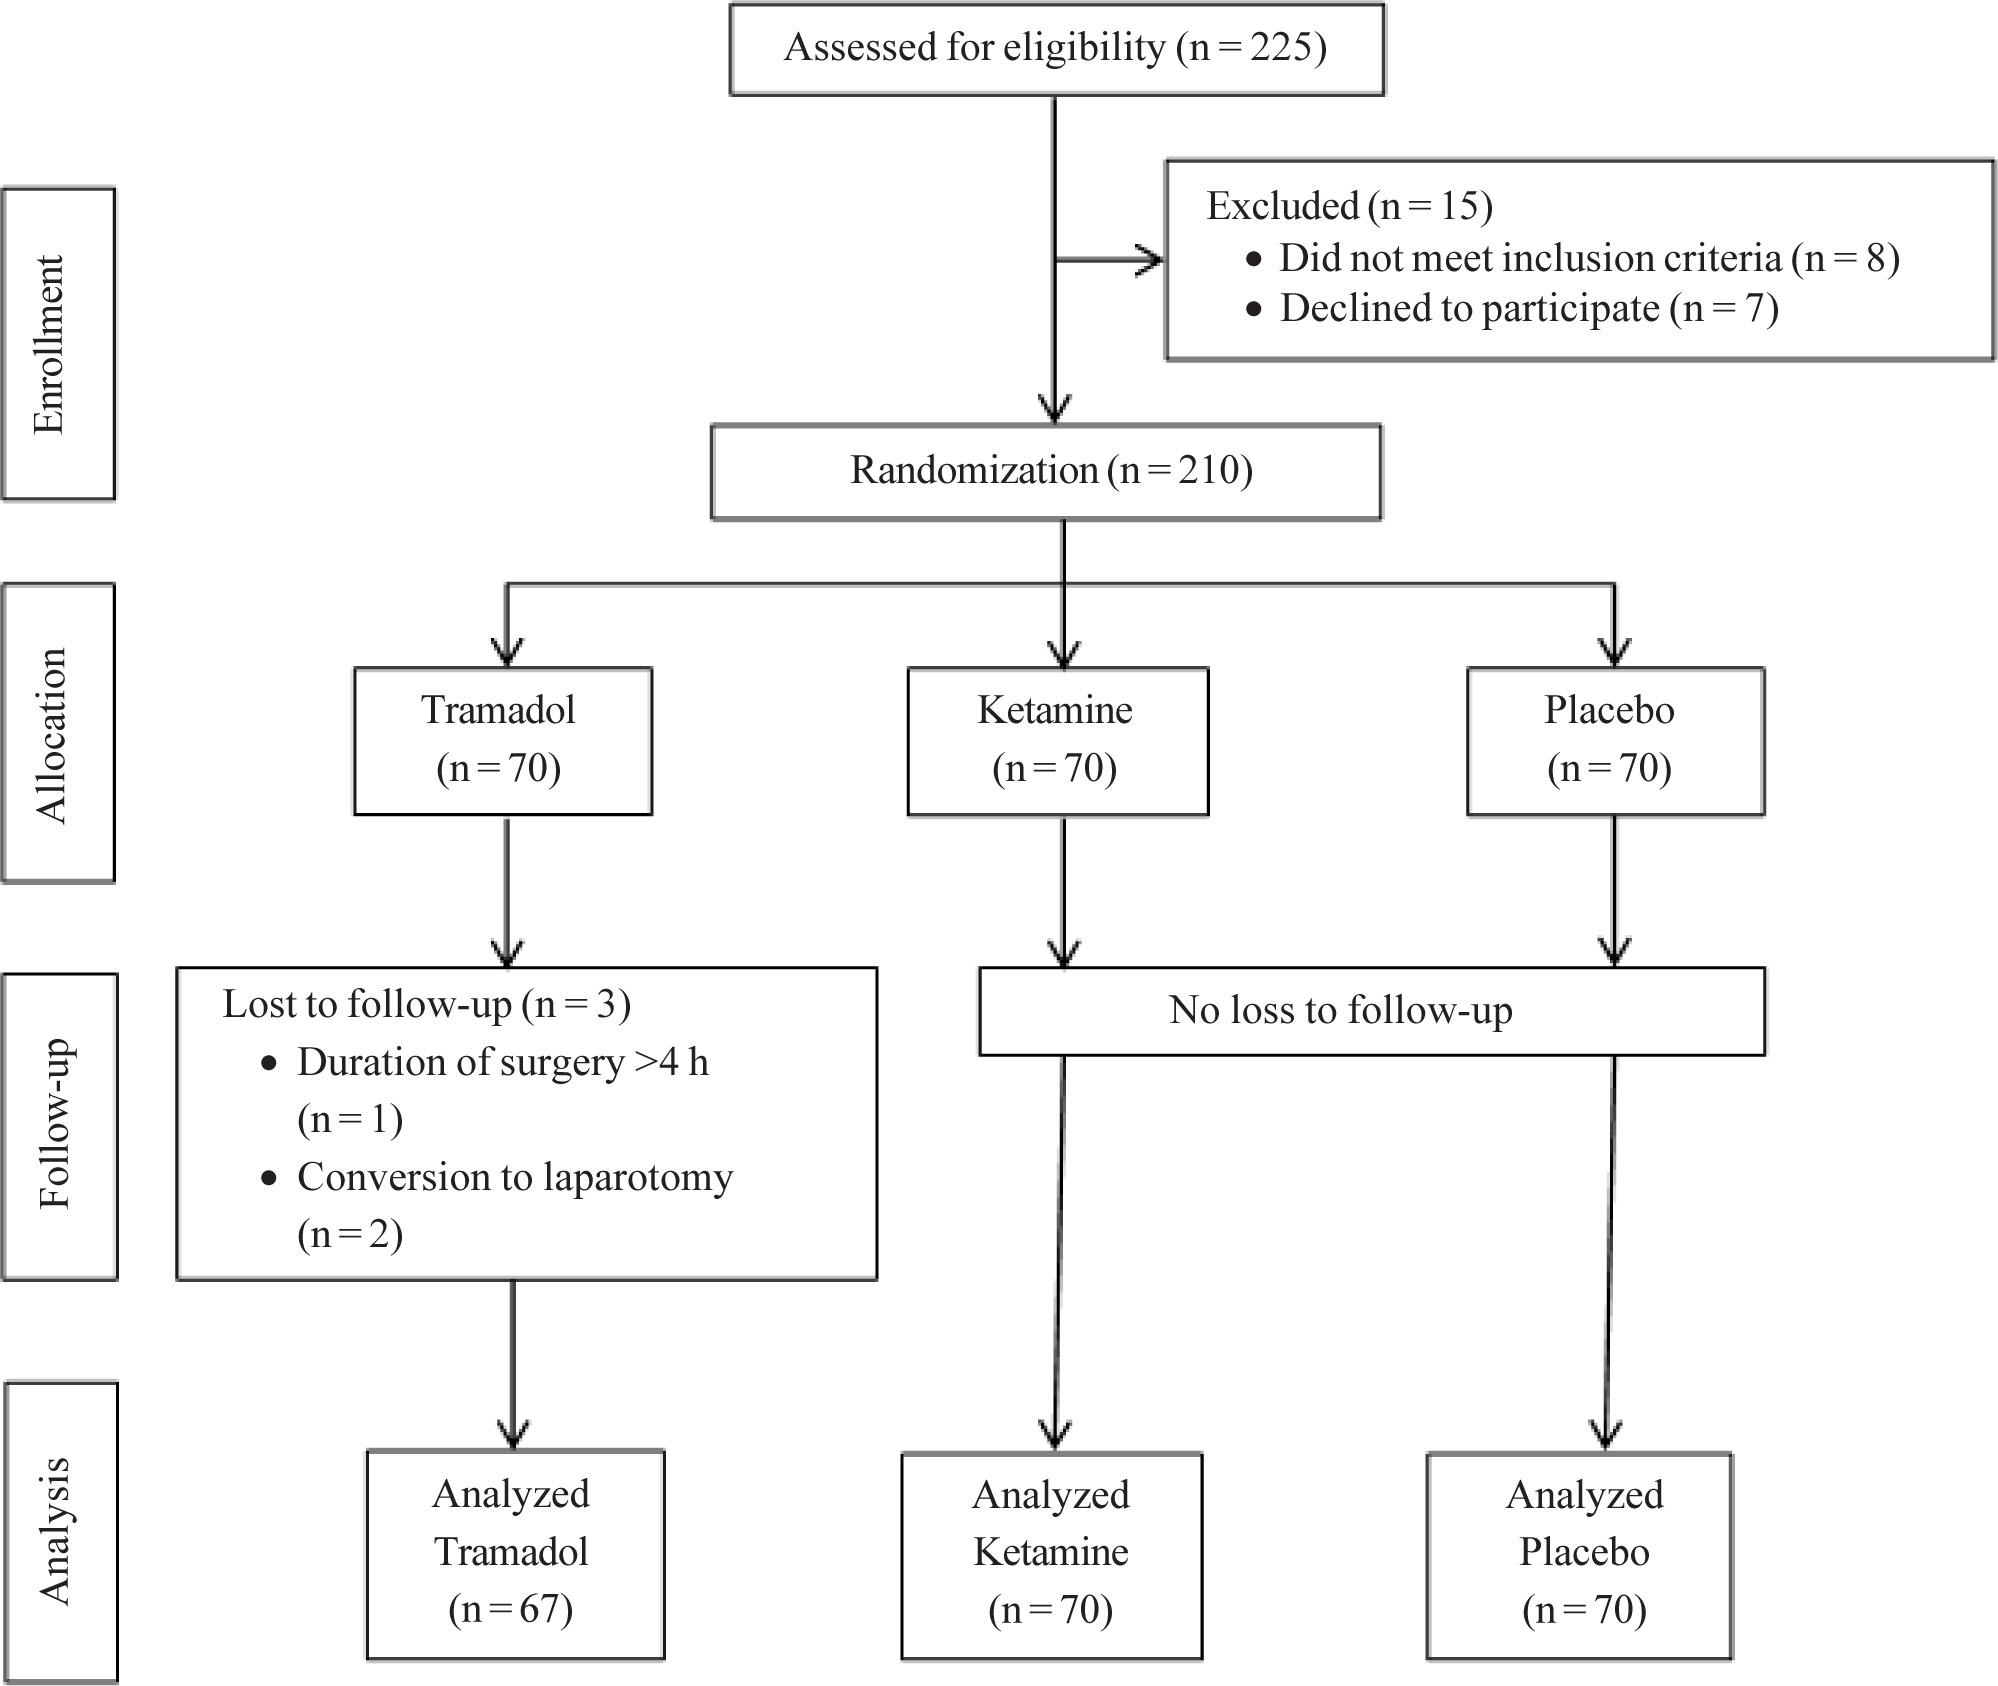
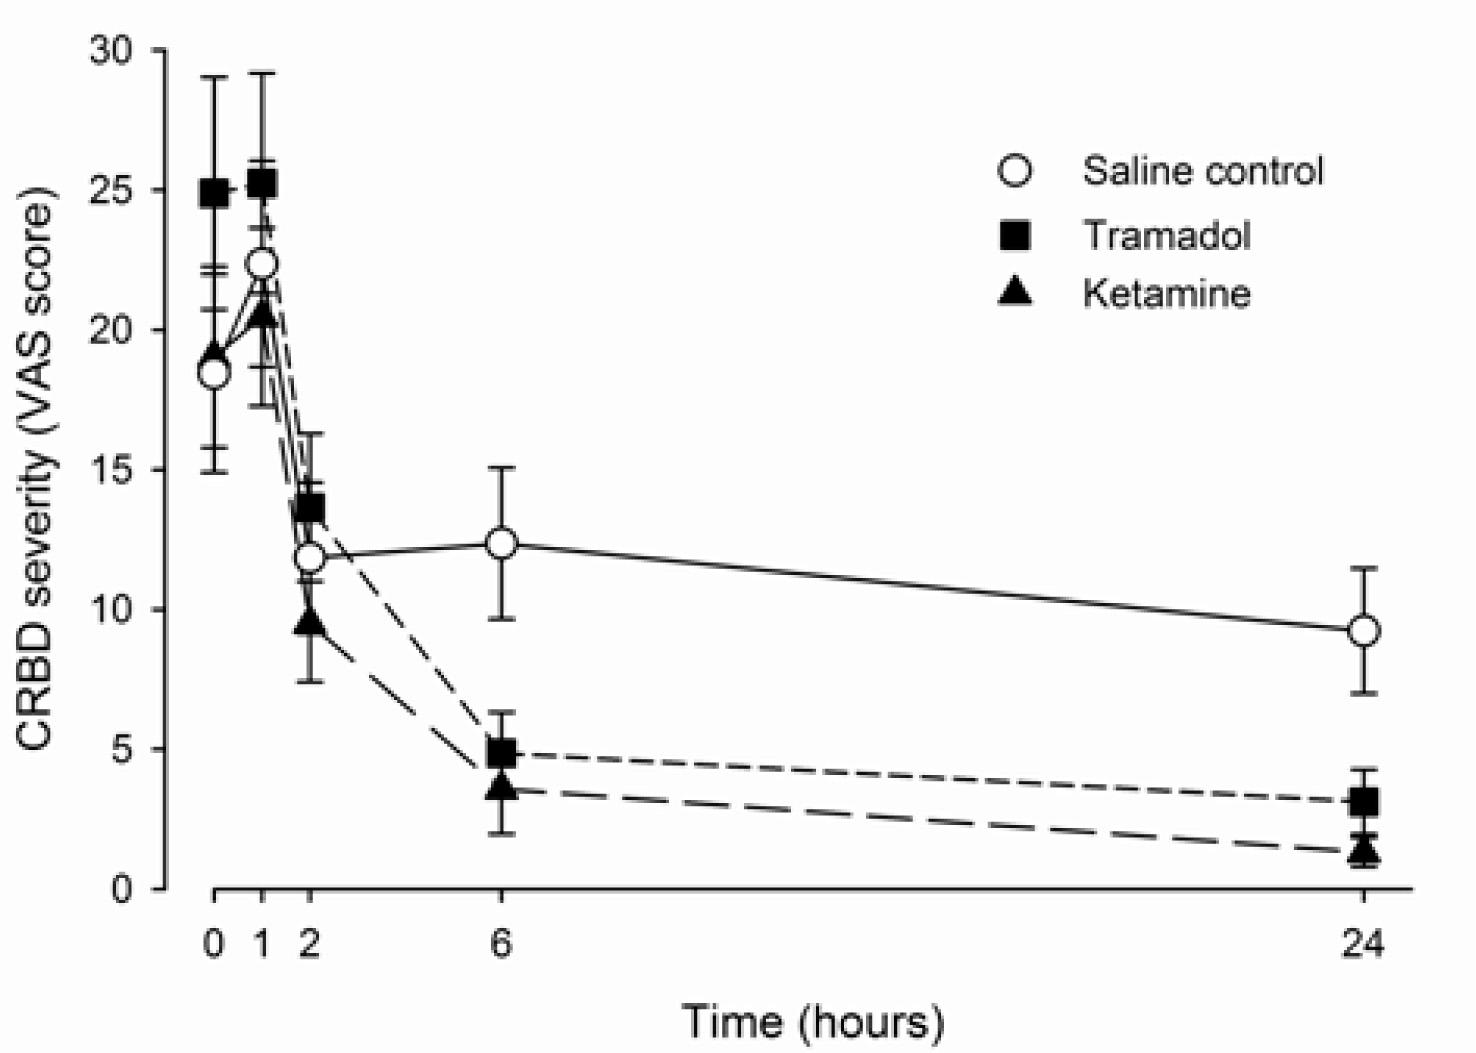
Figure 2
Patients’ demographic data and baseline characteristics
| Variables | Tramadol (T) (n = 67) | Ketamine (K) (n = 70) | Placebo (P) (n = 70) |
|---|---|---|---|
| Age (years) | 44 (12.7) | 47 (12.8) | 46.8 (11.2) |
| Sex | |||
| Male | 12 (18%) | 14 (20%) | 14 (20%) |
| Female | 55 (82%) | 56 (80%) | 56 (80%) |
| Weight (kg) | 61.2 (11.7) | 60.7 (10.6) | 59.5 (13.3) |
| Height (cm) | 159 (7.2) | 160 (6.6) | 160.3 (7.9) |
| BMI (kg/m2) | 24.2 (3.9) | 23.8 (4.0) | 23.1 (4.5) |
| Type of surgery | |||
| Laparoscopic upper abdominal surgery | 5 (8%) | 8 (11%) | 2 (3%) |
| Laparoscopic lower abdominal surgery | 11 (16%) | 9 (13%) | 9 (13%) |
| Laparoscopic uterine surgery | 20 (30%) | 17 (24%) | 25 (36%) |
| Laparoscopic ovarian surgery | 18 (27%) | 22 (31%) | 14 (20%) |
| Laparoscopic nephrectomy/ adrenalectomy | 13 (19%) | 14 (20%) | 20 (29%) |
| Underlying hypertension | 11 (16%) | 13 (19%) | 19 (27%) |
| Administration of COX-2 inhibitor | 18 (27%) | 9 (13%) | 15 (21%) |
| Duration of surgery (min) | 130 (52.6) | 117 (49.4) | 113.8 (55.1) |
| Intraoperative fentanyl administration (mg/h) | 45 (35.1) | 53 (30.8) | 55.0 (37.9) |
Incidence of postoperative shoulder pain
| Time | Tramadol (n = 67) | Ketamine (n = 70) | Placebo (n = 70) | P |
|---|---|---|---|---|
| Overall incidence | 12 (18%) | 26 (37%) | 24 (34%) | 0.03 Statistical significance between the three groups (chi-square test) |
| 0h | 1 (2%) | 3 (4%) | 1 (1%) | 0.62 |
| 1 h | 3 (5%) | 9 (13%) | 3 (4%) | 0.1 |
| 2h | 2 (3%) | 8 (11%) | 2 (3%) | 0.06 |
| 6h | 4 (6%) | 12 (17%) | 5 (7%) | 0.06 |
| 24 h | 7 (10%) Statistical significance compared with ketamine (P = 0.006) and placebo (P =0.001) | 21 (30%) | 24 (34%) | 0.003 Statistical significance between the three groups (chi-square test) |
Adverse effects
| Adverse effect | Tramadol n = 67 | Ketamine n = 70 | Placebon = 70 | P |
|---|---|---|---|---|
| Sedation level | 0.29 | |||
| 1 | 28 (42%) | 22 (31%) | 27 (39%) | |
| 2 | 39 (58%) | 45 (64%) | 42 (60%) | |
| 3 | 0 | 3 (4%) | 1 (1%) | |
| 4 | 0 | 0 | 0 | |
| PONV | 0.06 | |||
| Queasy | 10 (15%) | 8 (11%) | 15 (21%) | |
| Severe nausea | 6 (9.%) | 18 (26%) | 10 (14%) | |
| Vomiting | 16 (24%) | 11 (16%) | 3 (4%) | |
| Blurred vision | 1 (2%) | 1 (1%) | 0 | 0.77 |
| Respiratory depression | 0 | 0 | 0 | N/A |
| Hallucination | 0 | 0 | 0 | N/A |
| Postoperative hypertension | 22 (33%) | 23 (33%) | 28 (40%) | 0.60 |
| Postoperative tachycardia | 5 (8%) | 3 (4%) | 0 | 0.07 |