
Figure 1

Figure 2
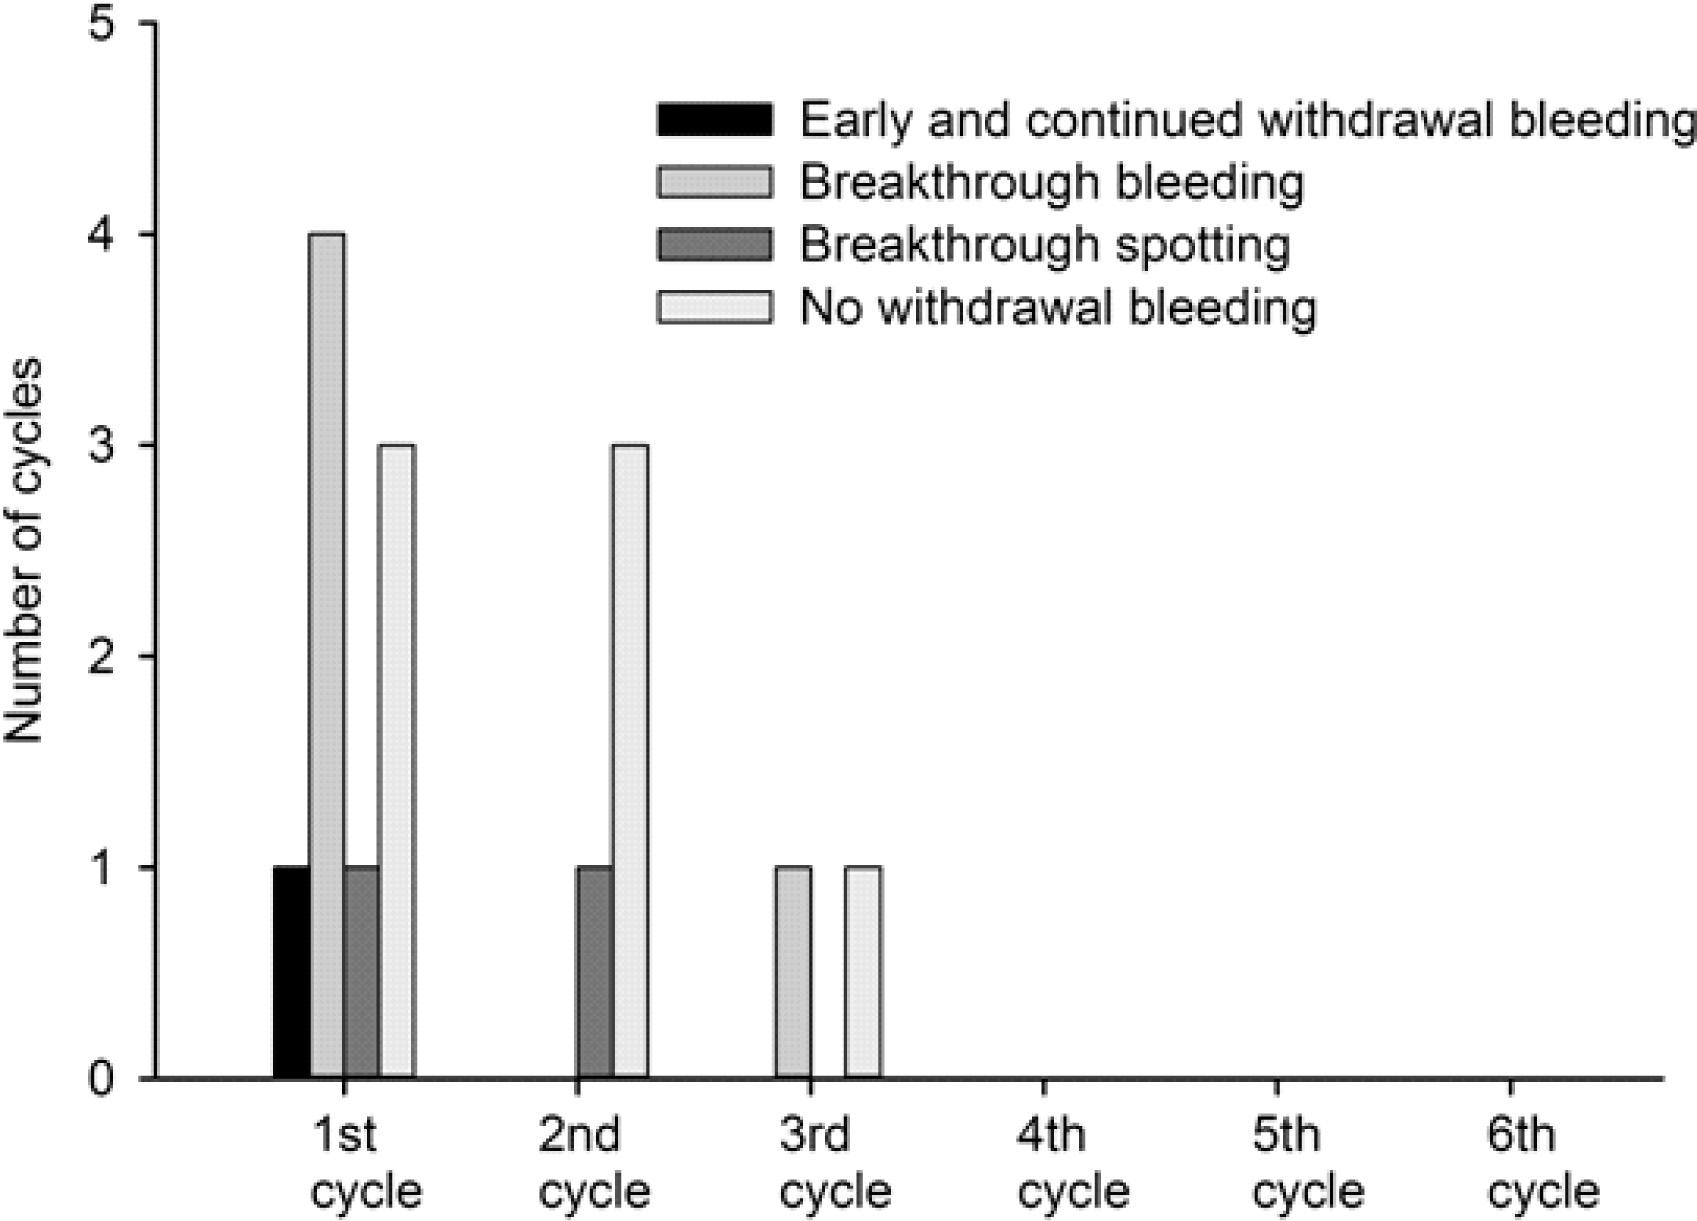
Bleeding patterns from a total of 229 cycles
| Outcome | Number of cycles (%) |
|---|---|
| Normal expected bleeding | 218 (95.1) |
| Early and continued withdrawal bleeding | 1 (0.43) |
| Breakthrough bleeding/spotting | 7 (3.0) |
| Breakthrough bleeding | 5 (2.1) |
| Breakthrough spotting | 2 (0.9) |
| No withdrawal bleeding | 7 (3.0) |
Adverse events reported during the study period
| Adverse events | Number of clients (%) |
|---|---|
| Dizziness | 2 (5.12) |
| Nausea | 1 (2.56) |
| Pelvic pain | 2 (2.5) |
| Back pain | 1 (2.5) |
Statistical analysis comparing before and after using the NuvaRing
| Variables | Baseline Mean (SD) | After 6th cycle Mean (SD) | Mean difference | P |
|---|---|---|---|---|
| Body weight (kg) | 56.49 (6.85) | 56.49 (6.72) | 0.002 (1.11) | 0.998 |
| Systolic BP (mmHg) | 111.92 (7.30) | 111.07 (7.84) | -1.13 (5.7) | 0.23 |
| Diastolic BP (mmHg) | 69.60 (5.78) | 72.10 (4.13) | 2.5 (6.16) | 0.017 |
| Duration of menstrual flow (days) | 4.61 (1.22) | 4.15 (1.00) | -0.44 (1.00) | 0.009 |
| Amount of pads/cycle (pads) | 14.42 (4.57) | 13.71 (4.17) | -0.71 (2.76) | 0.12 |
Baseline characteristics of the clients
| Variable | Mean (SD)/Number of clients (%) Continuous variables are presented as mean (SD), and categorical variables are presented as n (%) |
|---|---|
| Age (years) | 29.2 (4.9) |
| Parity (%) | |
| 0 | 3 (7.7%) |
| 1 | 28 (71.8%) |
| 2 | 5 (12.8%) |
| >2 | 3 (7.7%) |
| Occupation | |
| Housewife | 8 (20.5%) |
| Employee | 19 (48.7%) |
| Bureaucrat | 4 (10.3%) |
| Business | 3 (7.7%) |
| Others | 5 (12.5%) |
| Dysmenorrhea | |
| No | 9 (23.0%) |
| Mild | 25 (64.1%) |
| Moderate | 5 (12.8%) |
| Recent method of contraception | |
| Combined oral contraceptives | 8 (20.5%) |
| DMPA | 1 (2.6%) |
| Condom | 20 (51.3%) |
| None | 10 (25.6%) |