
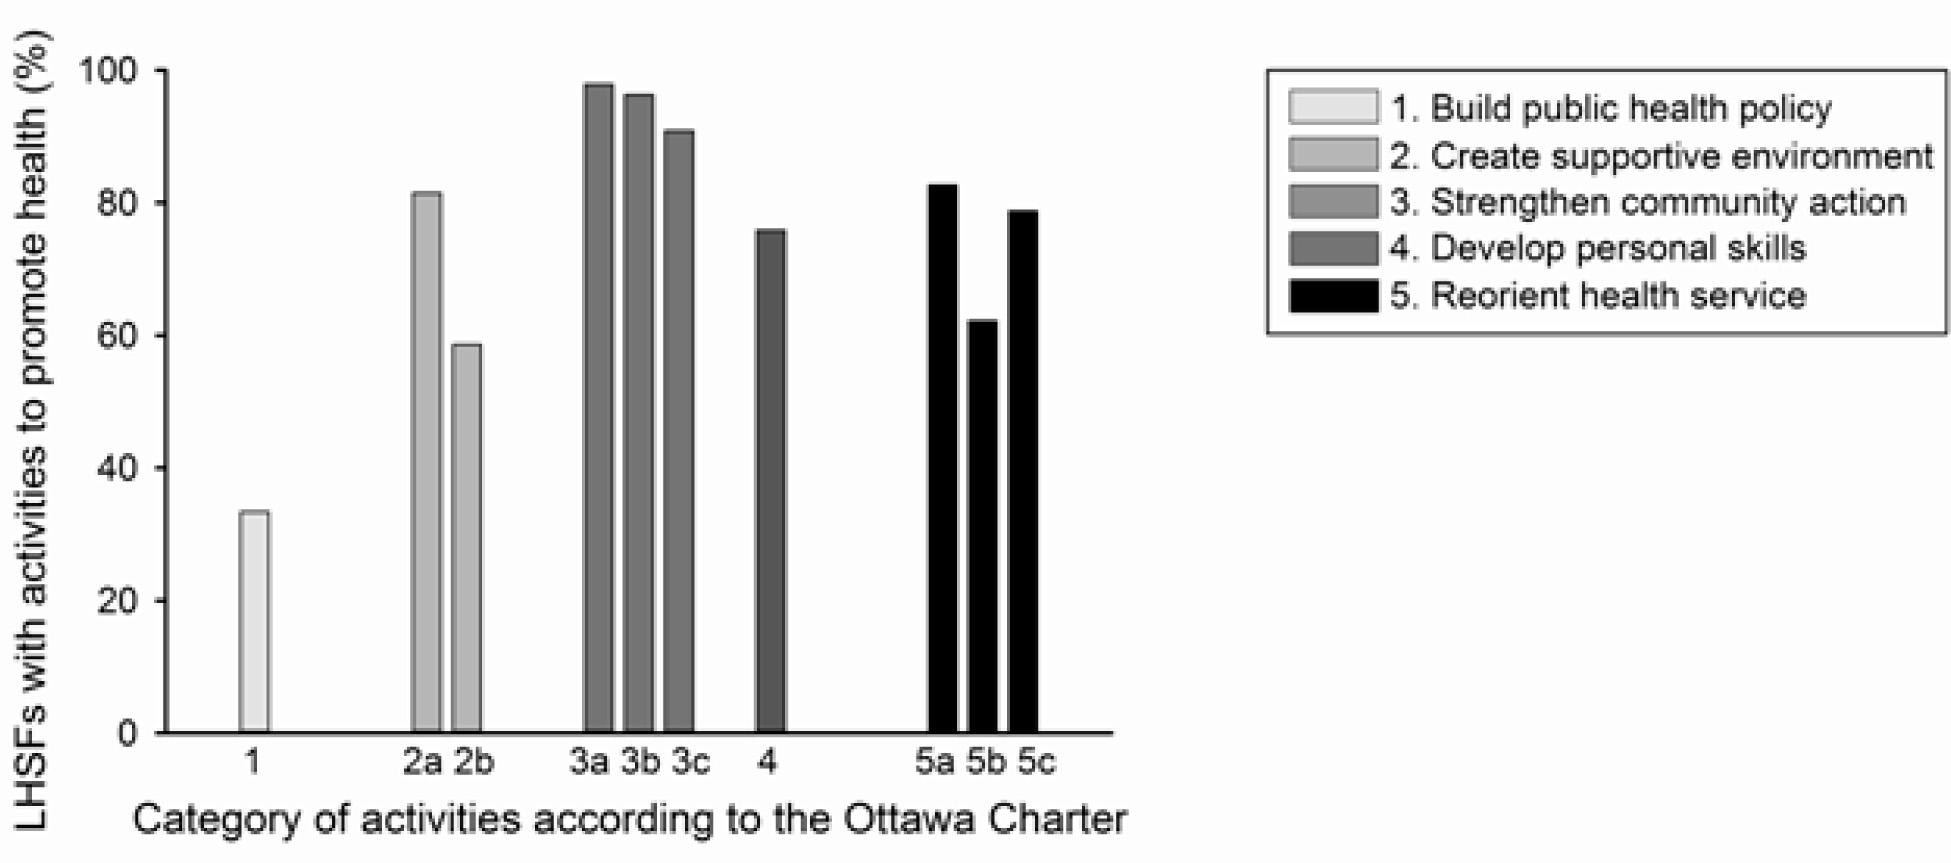
Figure 1
Comparison of the collected data with the national data
| Data | Participants study population | Proportion of | National data | Proportion of Thailand |
|---|---|---|---|---|
| Classified by area | ||||
| Urban municipality | 8 | 0.7 | 155 | 2.0 |
| Sub-district municipality | 208 | 19.4 | 1,900 | 24.5 |
| Sub-district administration organization | 856 | 79.9 | 5,753 | 73.5 |
| Total | 1,072 | 100.0 | 7,808 | 100.0 |
| Classified by region | ||||
| Northern | 194 | 18.1 | 1,612 | 20.6 |
| Southern | 71 | 6.6 | 1,246 | 16.0 |
| Northeastern | 504 | 47.0 | 2,945 | 37.7 |
| Central | 303 | 28.3 | 2,005 | 25.7 |
| Total | 1,072 | 100 | 7,808 | 100.0 |
Health promotion and disease prevention activities for diabetes and high blood pressure in community
| Type of activities | Number (n = 1,072) | Percentage (%) |
|---|---|---|
| Build healthy public policy | ||
| Creating community policies & regulations to support health | 358 | 33.4 |
| promotion | ||
| Identification of community role models | 247 | 69.0 |
| Awards for successful guideline follower | 146 | 40.8 |
| Punishment for violation of rules | 53 | 14.8 |
| Environment improvement to facilitate health promoting | ||
| behavior | ||
| Facility development or improvement | 874 | 81.5 |
| Sports or exercise areas | 775 | 88.7 |
| Public parks | 287 | 32.8 |
| Learning centers | 274 | 31.4 |
| Community areas for herb gardens | 221 | 25.3 |
| Healthy markets | 68 | 7.8 |
| Swimmingpools | 5 | 0.5 |
| Creating community space or areas for health | 628 | 58.6 |
| Designation of smoke-free areas | 436 | 69.4 |
| Designation of alcohol-free areas | 251 | 40.0 |
| Requirement of public places such as temples and schools to be equipped with health risk assessment tools | 242 | 38.5 |
| Requirements of restaurants in the community to have a healthy menu | 103 | 16.4 |
| Strengthen community actions through group or network formation | ||
| Community action plans | 1049 | 97.9 |
| Community strengthening development | 1032 | 96.3 |
| Community networking | 974 | 90.9 |
| Types of groups | ||
| Exercise groups | 694 | 71.3 |
| Women’s groups | 638 | 65.5 |
| Youth groups | 414 | 42.5 |
| Alcohol drinking cessation group | 151 | 15.5 |
| Smoking cessation group | 85 | 8.7 |
| Types of support | ||
| Budget | 890 | 88.9 |
| Supplies | 530 | 52.9 |
| Study visits | 359 | 35.9 |
| Personnel | 286 | 28.6 |
| Organizing contests | 281 | 28.1 |
| Monitoring, evaluation, and support | 221 | 22.1 |
| Search and promotion of role models | 120 | 12.0 |
| Develop personal skills through health education | 814 | 75.9 |
| Target population | ||
| General population | 674 | 82.8 |
| Elderly persons | 454 | 55.8 |
| Overweight persons | 282 | 34.6 |
| Alcohol drinkers | 183 | 22.5 |
| Smokers | 171 | 19.8 |
| Channels of health education | ||
| Workshops/seminars/lectures | 498 | 46.5 |
| Leaflets/brochures | 486 | 44.3 |
| Counselling | 373 | 34.8 |
| Community news broadcast | 313 | 29.2 |
| Billboards in the community | 251 | 23.4 |
| Training camps | 142 | 13.2 |
| Contents of health education in relation to NCDs | ||
| General knowledge | 829 | 77.3 |
| Risk factors | 798 | 74.4 |
| Severity and complications of diseases | 728 | 67.9 |
| Behavior and practice | ||
| Diet | 842 | 78.5 |
| Exercise | 829 | 77.3 |
| Alcohol drinking cessation | 817 | 76.2 |
| Smoking cessation | 815 | 76.0 |
| Stress management | 770 | 71.8 |
| Self-care practice during illness | 747 | 69.7 |
| Self-monitoring or screening | ||
| Blood glucose screening | 731 | 68.2 |
| Monthly blood pressure monitoring | 705 | 65.8 |
| Monthly waist measurement | 636 | 59.3 |
| Weekly weight measurement | 602 | 56.2 |
| Reorient health services to facilitate health promotion activities against NCDs | ||
| Type of activities or support to health facilities or health staff | 887 | 82.7 |
| Provision of financial support to carry out health promotion activities | ||
| Provide data on vulnerable groups e.g. people with | 662 | 74.6 |
| diabetes and hypertension | 606 | 68.3 |
| Provision of supplies for use in health promotion activities | 424 | 47.8 |
| Registration of vulnerable groups | 361 | 40.7 |
| Hiring more staff to work at the healthcare settings | 168 | 18.9 |
| Methods of implementation | 667 | 62.2 |
| Health promoting activities while waiting for services at the hospital | 595 | 89.2 |
| Relaxation activities while waiting for services at the hospital | 191 | 28.6 |
| Integration of health promotion activities into home visits | 845 | 78.8 |
| Blood sugar screening | 714 | 84.5 |
| Blood pressure screening | 751 | 88.9 |
| Weight measurement | 648 | 76.7 |
| Waist circumference measurement | 531 | 62.8 |
Diversity of 5 main categories of health promotion activities
| LHSF characteristics | Total number of LHSFs (n = 1,072) | LHSFs with all 5 categories (n=223) | % complete within each group |
|---|---|---|---|
| Regions P < 0.05 by chi-square or Fisher exact tests | |||
| Northern | 194 | 38 | 19.6 |
| Southern | 71 | 12 | 16.9 |
| Northeastern | 504 | 120 | 23.8 |
| Central | 303 | 53 | 17.5 |
| Size of area | |||
| Urban municipality | 8 | 2 | 25.0 |
| Rural municipality | 208 | 42 | 20.2 |
| SAOs | 856 | 179 | 20.9 |
| Existence of public health office in the local government P < 0.05 by chi-square or Fisher exact tests | |||
| Yes | 338 | 85 | 25.1 |
| No | 730 | 179 | 18.8 |
| Educational level of local government knowledge | |||
| Bachelor’s degree or lower | 408 | 80 | 19.6 |
| Higher than Bachelor’s degree | 657 | 143 | 21.8 |
| Work experience of local government chiefs | |||
| More than one term in office | 401 | 76 | 19 |
| First term in office | 657 | 103 | 19.5 |
| Relationship between head of local government and public health officers P < 0.05 by chi-square or Fisher exact tests | |||
| Excellent | 186 | 44 | 23.7 |
| Good | 718 | 159 | 22.1 |
| Fair | 142 | 15 | 10.6 |
| Poor | 19 | 3 | 15.8 |