
Figure 1
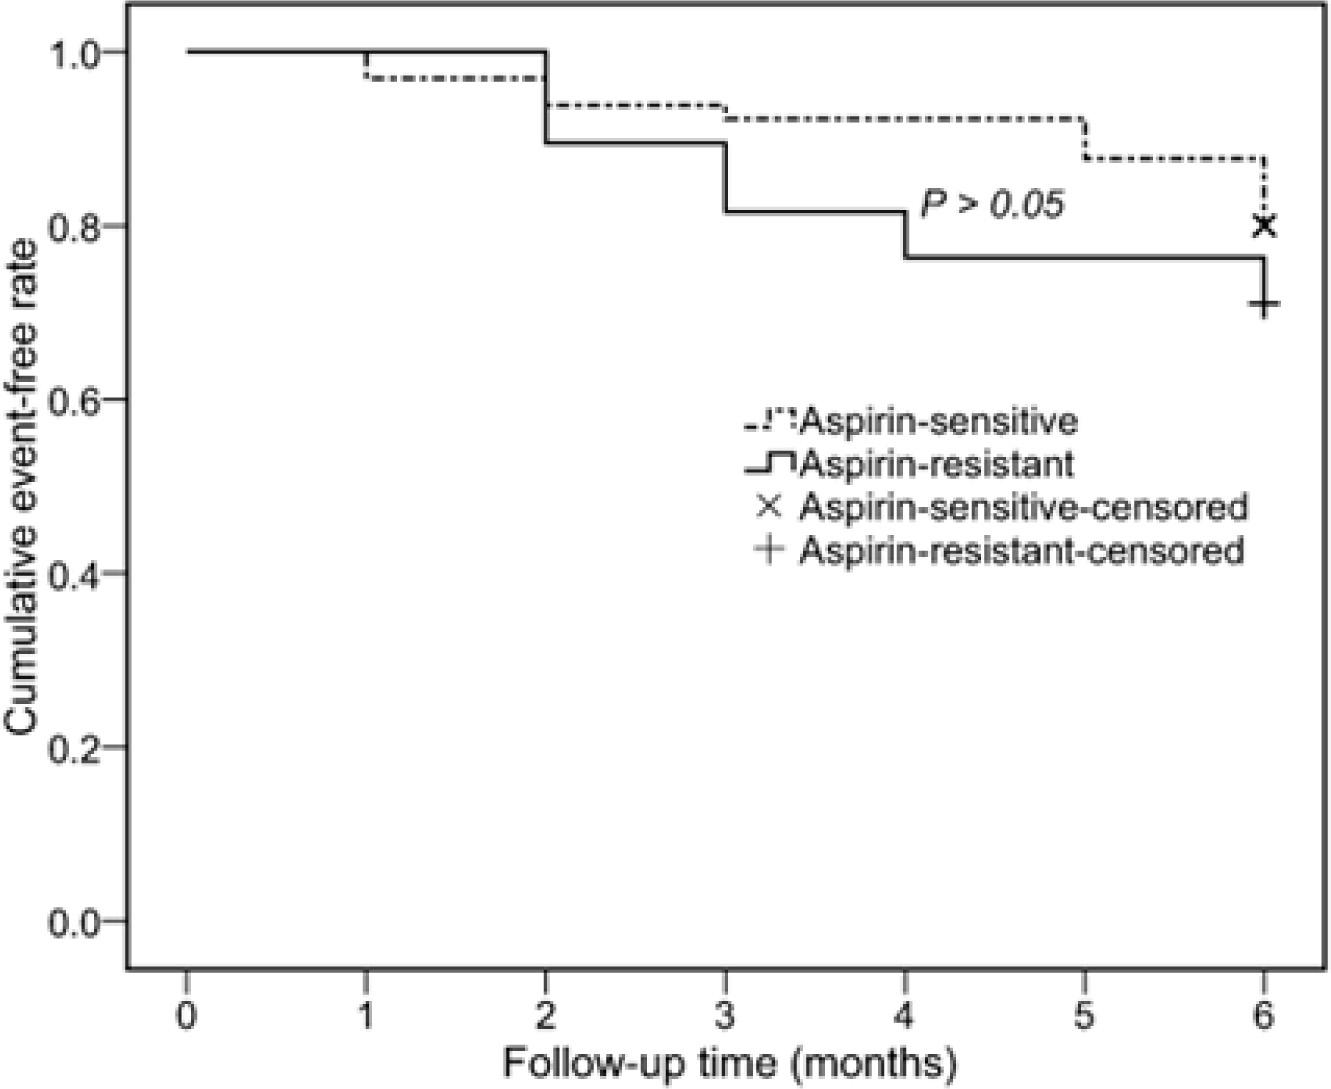
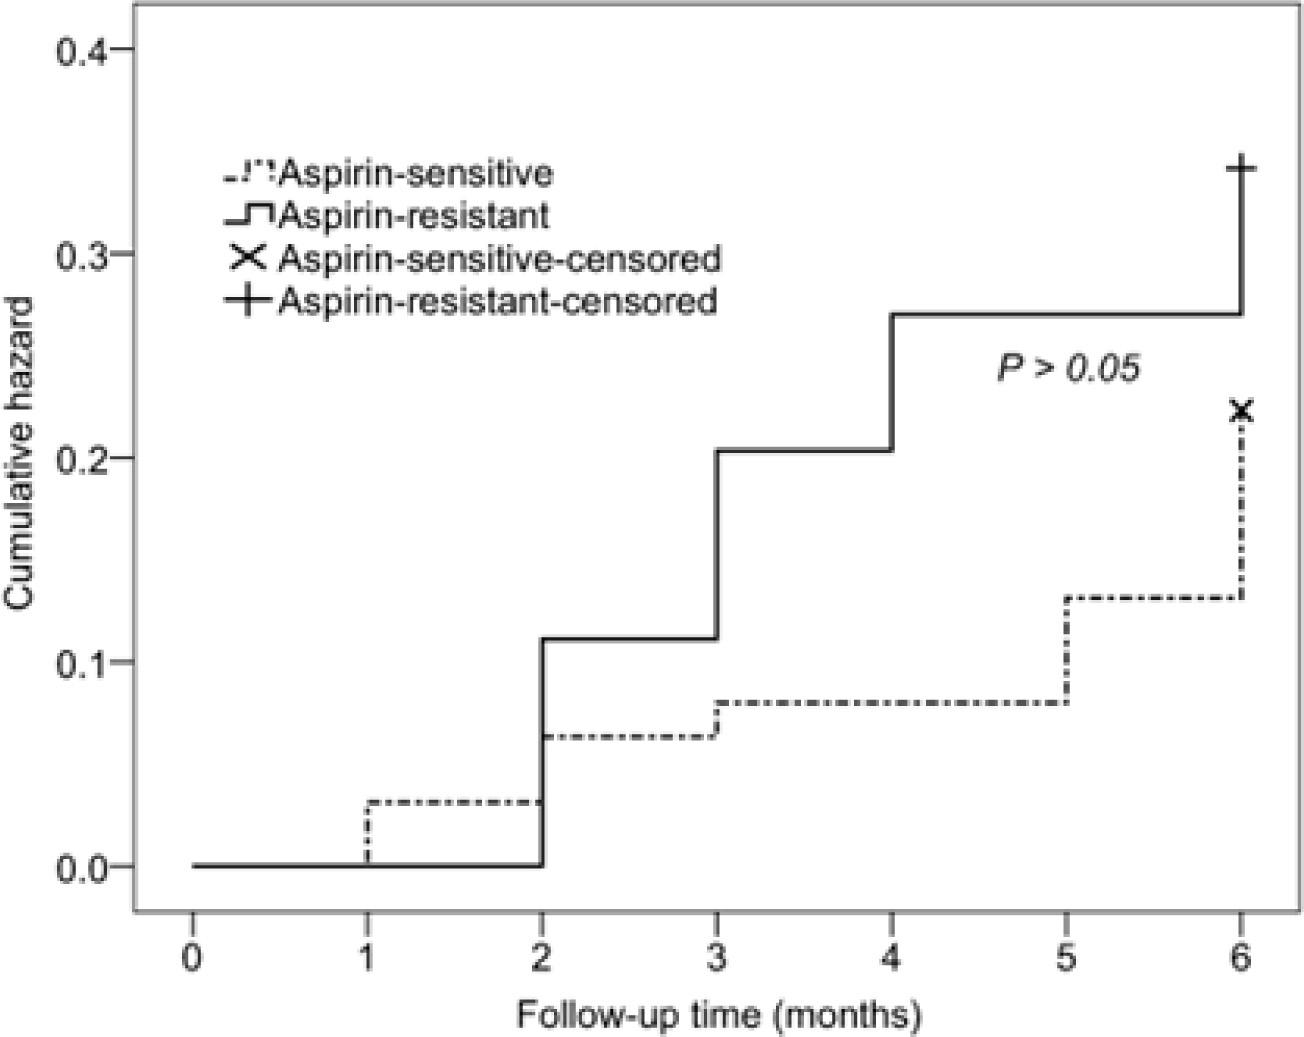
Figure 2
Baseline clinical characteristics of the cohort according to the occurrence of major adverse cardiovascular events
| Total (n = 103) | Major adverse cardiovascular events | P | ||
|---|---|---|---|---|
| Yes(n = 24) | No(n = 79) | |||
| Age (y) | 64.7 ±9.4 | 67.3 ± 8.3 | 63.9 ± 9.6 | 0.12 |
| Male (%) | 57 (55) | 14 (58) | 43 (54) | 0.74 |
| Body mass index (kg/m2) | 23.1 ±3.56 | 24.0±3.98 | 22.8 ±3.40 | 0.16 |
| A trial fibrillation (%) | 20 (19) | 5 (21) | 15 (19) | 0.84 |
| Smoker (%) | 22 (21) | 3 (13) | 19 (24) | 0.23 |
| Hypertension (%) | 62 (60) | 16 (67) | 46 (58) | 0.46 |
| Diabetes P < 0.05 | 14 (14) | 7 (29) | 7 (9) | 0.011 |
| Hyperlipidemia (%) | 12 (12) | 1 (4) | 11 (14) | 0.19 |
| Cerebrovascular disease P < 0.05 | 17 (17) | 8 (33) | 9 (11) | 0.011 |
| Impedance values (Ω) | 8.3 ±4.46 | 9.1 ±4.33 | 8.6±4.50 | 0.34 |
| Aspirin resistance (%) | 38 (37) | 11 (46) | 27 (34) | 0.30 |
Cox regression analysis: hazard ratios of major adverse cardiovascular events according to clinical characteristics, platelet aggregation function, and the status of aspirin responsiveness
| Hazard Ratio | 95% CI | P | |
|---|---|---|---|
| Bivariate analysis | |||
| Age | 1.04 | 0.99-1.09 | 0.13 |
| Male | 0.94 | 0.42-2.12 | 0.89 |
| Body mass index | 1.10 | 0.97-1.24 | 0.14 |
| Atrial fibrillation | 1.13 | 0.42-3.02 | 0.81 |
| Smoker | 0.51 | 0.15-1.71 | 0.28 |
| Hypertension | 1.40 | 0.60–3.27 | 0.44 |
| Diabetes | 3.32 | 1.37–8.02 | 0.008 P < 0.05 |
| Hyperlipidemia | 0.29 | 0.04–2.17 | 0.23 |
| Cerebrovascular disease | 3.10 | 1.32-7.26 | 0.009 P < 0.05 |
| Impedance values | 1.05 | 0.96–1.15 | 0.28 |
| Aspirin resistance | 1.56 | 0.70–3.48 | 0.28 |
| Multivariate analysis | |||
| Diabetes | 2.61 | 1.04–6.58 | 0.04 P < 0.05 |
| Cerebrovascular disease | 2.48 | 1.02–6.05 | 0.046 P < 0.05 |