
Figure 1
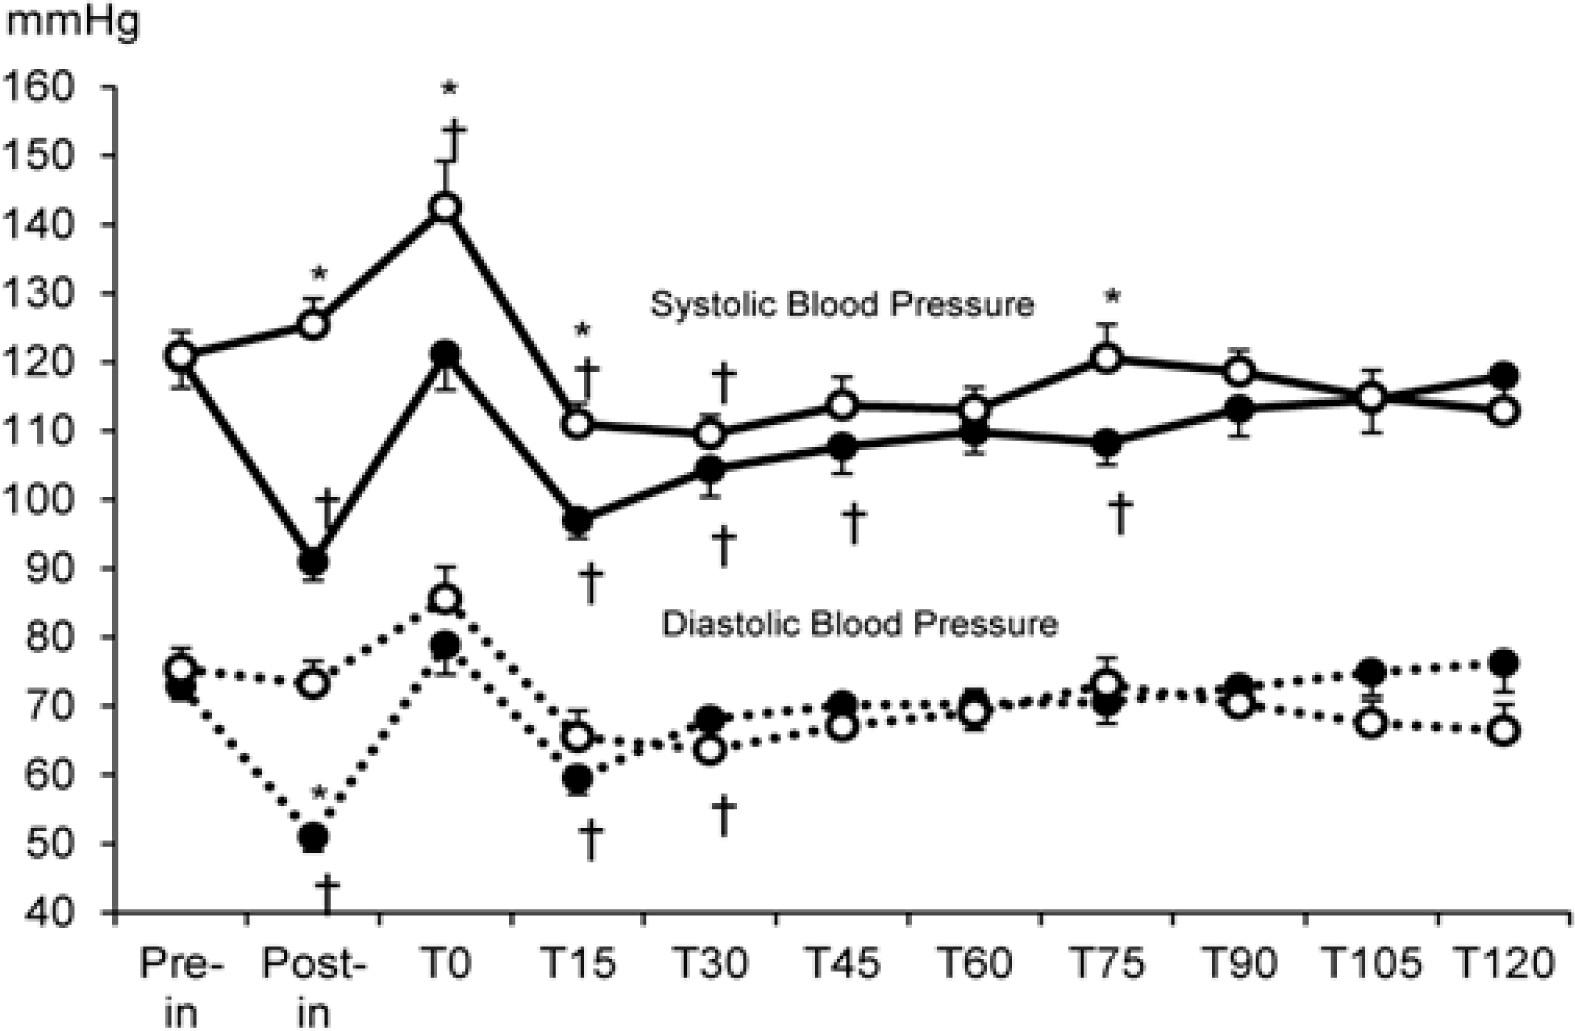
Figure 2
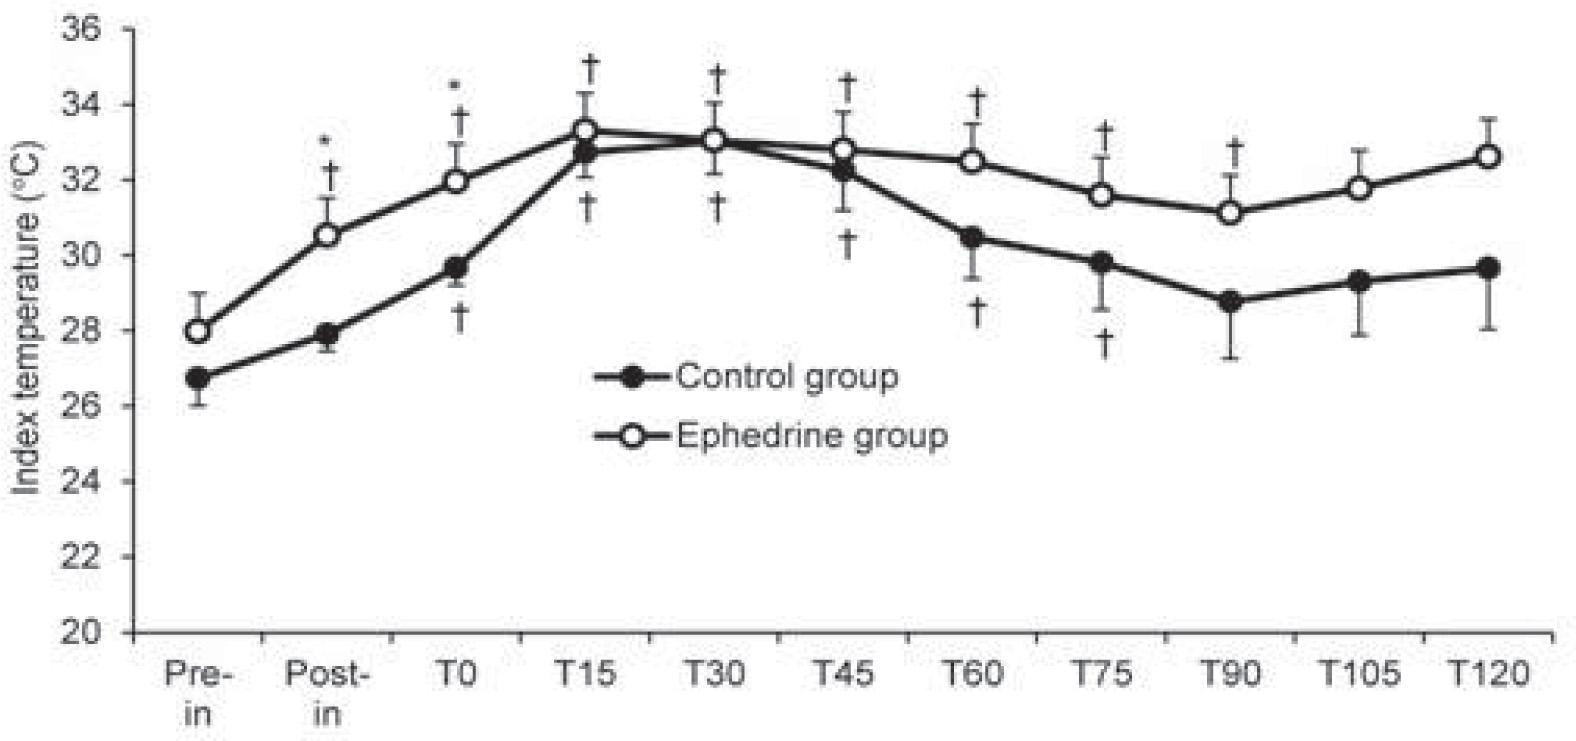
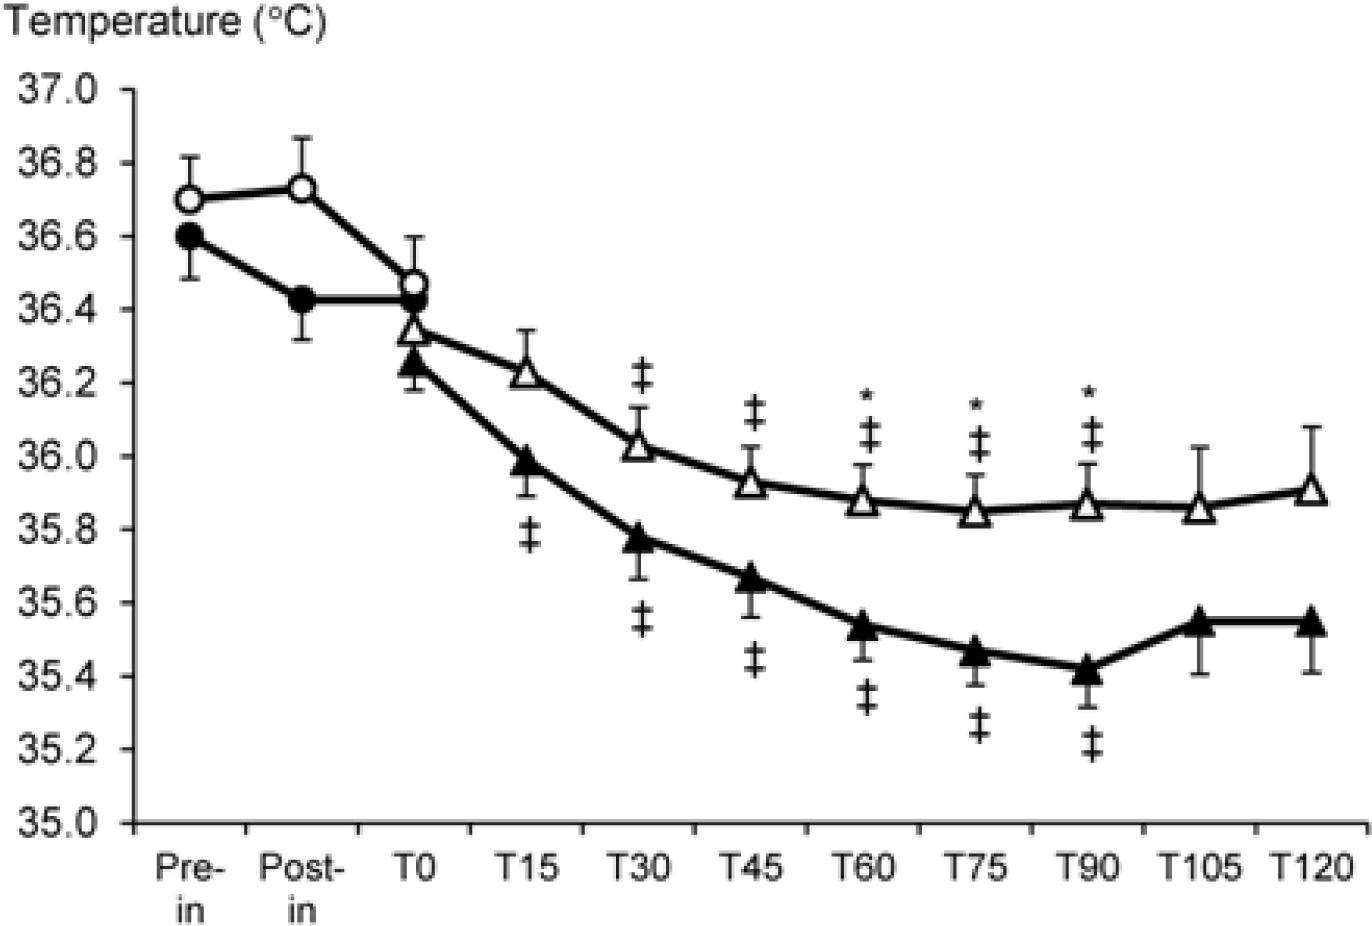
Figure 3
Comparing systolic and diastolic blood pressure between groups
| Systolic pressure | Control (n = 15) | Ephedrine (n = 15) | P | Diastolic pressure | Control (n = 15) | Ephedrine (n = 15) | P |
|---|---|---|---|---|---|---|---|
| 0.006 P < 0.05 statistical significance, Pre-in = pre-induction, Post-in = post-induction 2.5 min, T0, 15, 30,…, 120 = At 0, 15, 30,…, 120 min after intubation | 0.046 P < 0.05 statistical significance, Pre-in = pre-induction, Post-in = post-induction 2.5 min, T0, 15, 30,…, 120 = At 0, 15, 30,…, 120 min after intubation | ||||||
| Pre-in | 120.4 ± 16.1 | 120.9 ± 13.5 | 0.92 | Pre-in | 72.9 ± 7.6 | 75.4 ± 11.7 | 0.49 |
| Post-in | 91.0 ± 10.6 | 125.5 ± 14.5 | <0.001 P < 0.05 statistical significance, Pre-in = pre-induction, Post-in = post-induction 2.5 min, T0, 15, 30,…, 120 = At 0, 15, 30,…, 120 min after intubation | Post-in | 51.1 ± 8.4 | 73.3 ± 12.7 | <0.001 P < 0.05 statistical significance, Pre-in = pre-induction, Post-in = post-induction 2.5 min, T0, 15, 30,…, 120 = At 0, 15, 30,…, 120 min after intubation |
| T0 | 121.1 ± 19.9 | 142.5 ± 25.9 | 0.02 P < 0.05 statistical significance, Pre-in = pre-induction, Post-in = post-induction 2.5 min, T0, 15, 30,…, 120 = At 0, 15, 30,…, 120 min after intubation | T0 | 78.9 ± 16.7 | 85.6 ± 17.7 | 0.30 |
| T15 | 97.0 ± 10.0 | 111.0 ± 11.7 | 0.001 P < 0.05 statistical significance, Pre-in = pre-induction, Post-in = post-induction 2.5 min, T0, 15, 30,…, 120 = At 0, 15, 30,…, 120 min after intubation | T15 | 59.5 ± 9.2 | 65.5 ± 14.7 | 0.19 |
| T30 | 104.4 ± 15.4 | 109.5 ± 10.7 | 0.30 | T30 | 68.1 ± 12.4 | 63.7 ± 10.8 | 0.30 |
| T45 | 107.7 ± 15.2 | 113.7 ± 15.9 | 0.30 | T45 | 70.2 ± 15.4 | 67.1 ± 10.5 | 0.53 |
| T60 | 109.9 ± 12.3 | 113.01 ± 12.5 | 0.49 | T60 | 70.3 ± 14.5 | 69.1 ± 12.6 | 0.81 |
| T75 | 108.3 ± 12.5 | 120.5 ± 19.2 | 0.048 P < 0.05 statistical significance, Pre-in = pre-induction, Post-in = post-induction 2.5 min, T0, 15, 30,…, 120 = At 0, 15, 30,…, 120 min after intubation | T75 | 70.6 ± 12.1 | 73.2 ± 12.4 | 0.45 |
| T90 | 113.2 ± 15.4 | 118.6 ± 12.1 | 0.30 | T90 | 72.7 ± 15.3 | 70.3 ± 13.7 | 0.65 |
| T105 | 114.5 ± 16.6 | 114.9 ± 13.0 | T105 | 74.9 ± 11.7 | 67.6 ± 10.7 | ||
| (n = 10) | (n = 11) | (n = 10) | (n = 11) | ||||
| T120 | 118.0 ± 14.6 | 112.9 ± 11.8 | T120 | 76.3 ± 14.6 | 66.5 ± 12.5 | ||
| (n = 10) | (n = 11) | (n = 10) | (n = 11) |
Comparing temperature between groups
| Temperature | Control (n = 15) | Ephedrine (n = 15) | P | Temperature | Control (n = 15) | Ephedrine (n = 15) | P |
|---|---|---|---|---|---|---|---|
| Tympanic | 0.38 | Index | 0.03 P < 0.05 statistical significance, Pre-in = pre-induction, Post-in = post-induction 2.5 min, T0, 15, 30, …, 120 = At 0, 15, 30, …, 120 min after intubation | ||||
| Pre-in | 36.6 ± 0.45 | 36.7 ± 0 . 5 | 0.55 | Pre-in | 26.7 ± 2.1 | 27.99 ± 2.49 | 0.15 |
| Post-in | 36.4 ± 0.42 | 36.7 ± 0 . 5 | 0.099 | Post-in | 27.9 ± 2.6 | 30.53 ± 2.55 | 0.01 P < 0.05 statistical significance, Pre-in = pre-induction, Post-in = post-induction 2.5 min, T0, 15, 30, …, 120 = At 0, 15, 30, …, 120 min after intubation |
| T0 | 36.4 ± 0.7 | 36.5 ± 0 . 5 | 0.83 | ||||
| Esophageal | 0.03 P < 0.05 statistical significance, Pre-in = pre-induction, Post-in = post-induction 2.5 min, T0, 15, 30, …, 120 = At 0, 15, 30, …, 120 min after intubation | T0 | 29.7 ± 2.8 | 31.96 ± 2.52 | 0.03 P < 0.05 statistical significance, Pre-in = pre-induction, Post-in = post-induction 2.5 min, T0, 15, 30, …, 120 = At 0, 15, 30, …, 120 min after intubation | ||
| T0 | 36.3 ± 0.3 | 36.4 ± 0 . 4 | 0.51 | ||||
| T15 | 35.9 ± 0.4 | 36.2 ± 0.4 | 0.13 | T15 | 32.7 ± 1.7 | 33.31 ± 2.45 | 0.47 |
| T30 | 35.8 ± 0.5 | 36.0 ± 0 . 4 | 0.11 | T30 | 33.0 ± 1.8 | 33.05 ± 1.89 | 0.97 |
| T45 | 35.7 ± 0.4 | 35.9 ± 0 . 4 | 0.09 | T45 | 32.3 ± 2.6 | 32.80 ± 1.70 | 0.49 |
| T60 | 35.5 ± 0.4 | 35.9 ± 0.4 | 0.02 P < 0.05 statistical significance, Pre-in = pre-induction, Post-in = post-induction 2.5 min, T0, 15, 30, …, 120 = At 0, 15, 30, …, 120 min after intubation | T60 | 30.5 ± 3.8 | 32.49 ± 2.19 | 0.06 |
| T75 | 35.5 ± 0.4 | 35.9 ± 0.4 | 0.01 P < 0.05 statistical significance, Pre-in = pre-induction, Post-in = post-induction 2.5 min, T0, 15, 30, …, 120 = At 0, 15, 30, …, 120 min after intubation | T75 | 29.8 ± 4.1 | 31.60 ± 2.48 | 0.16 |
| T90 | 35.4 ± 0.4 | 35.9 ± 0.4 | 0.006 P < 0.05 statistical significance, Pre-in = pre-induction, Post-in = post-induction 2.5 min, T0, 15, 30, …, 120 = At 0, 15, 30, …, 120 min after intubation | T90 | 28.8 ± 4.3 | 31.13 ± 2.90 | 0.09 |
| T105 | 35.6 ± 0.4 (n = 8) | 35.9 ± 0.5 (n = 11) | T105 | 29.3 ± 3.5 | 31.78 ± 3.29 (n = 11) | ||
| T120 | 35.6 ± 0.4 (n = 8) | 35.9 ± 0 . 6 (n = 11) | T120 | 29.7 ± 4.3 (n = 8) | 32.62 ± 2.21 (n = 11) |
Patient characteristics and preoperative data
| Control (n = 15) | Ephedrine (n = 15) | P | |
|---|---|---|---|
| Sex, female/male, n | 11/4 | 12/3 | >0.999 |
| Age, y | 33.8 ± 11.3 | 30.3 ± 9 . 9 | 0.38 |
| BMI | 21.9 ± 3.2 | 21.8 ± 3 . 8 | 0.87 |
| Operating room temperature, °C | 21.1 ± 0.9 | 20.8 ± 1 . 2 | 0.42 |
| Anesthesia time, min (median [range]) | 145 [95-290] | 135 [90-405] | 0.39 |
| At 90 min | |||
| Hypotension, n | 0 | 0 | – |
| IV fluid, mL | 963 ± 418 | 660 ± 219 | 0.02 P < 0.05 statistical significance |
| Blood loss, mL (median [range]) | 20 [5-500] | 4 0 [5-250] | 0.41 |
| Fentanyl, μg (median [range]) | 100 [50-250] | 100 [50-150] | 0.38 |
| At 120 min | |||
| Hypotension, n | 1 | 0 | >0.999 |
| IV fluid, mL | 1235 ± 578 (n = 11) | 762 ± 245 (n = 11) | 0.02 P < 0.05 statistical significance |
| Blood loss, mL (median [range]) | 20 [5-500] (n = 11) | 50 [5–250] (n = 11) | 0.52 |
| Fentanyl, μg (median [range]) | 100 [50–300] (n = 11) | 100 [50–150] (n = 11) | 0.22 |