
Figure 1
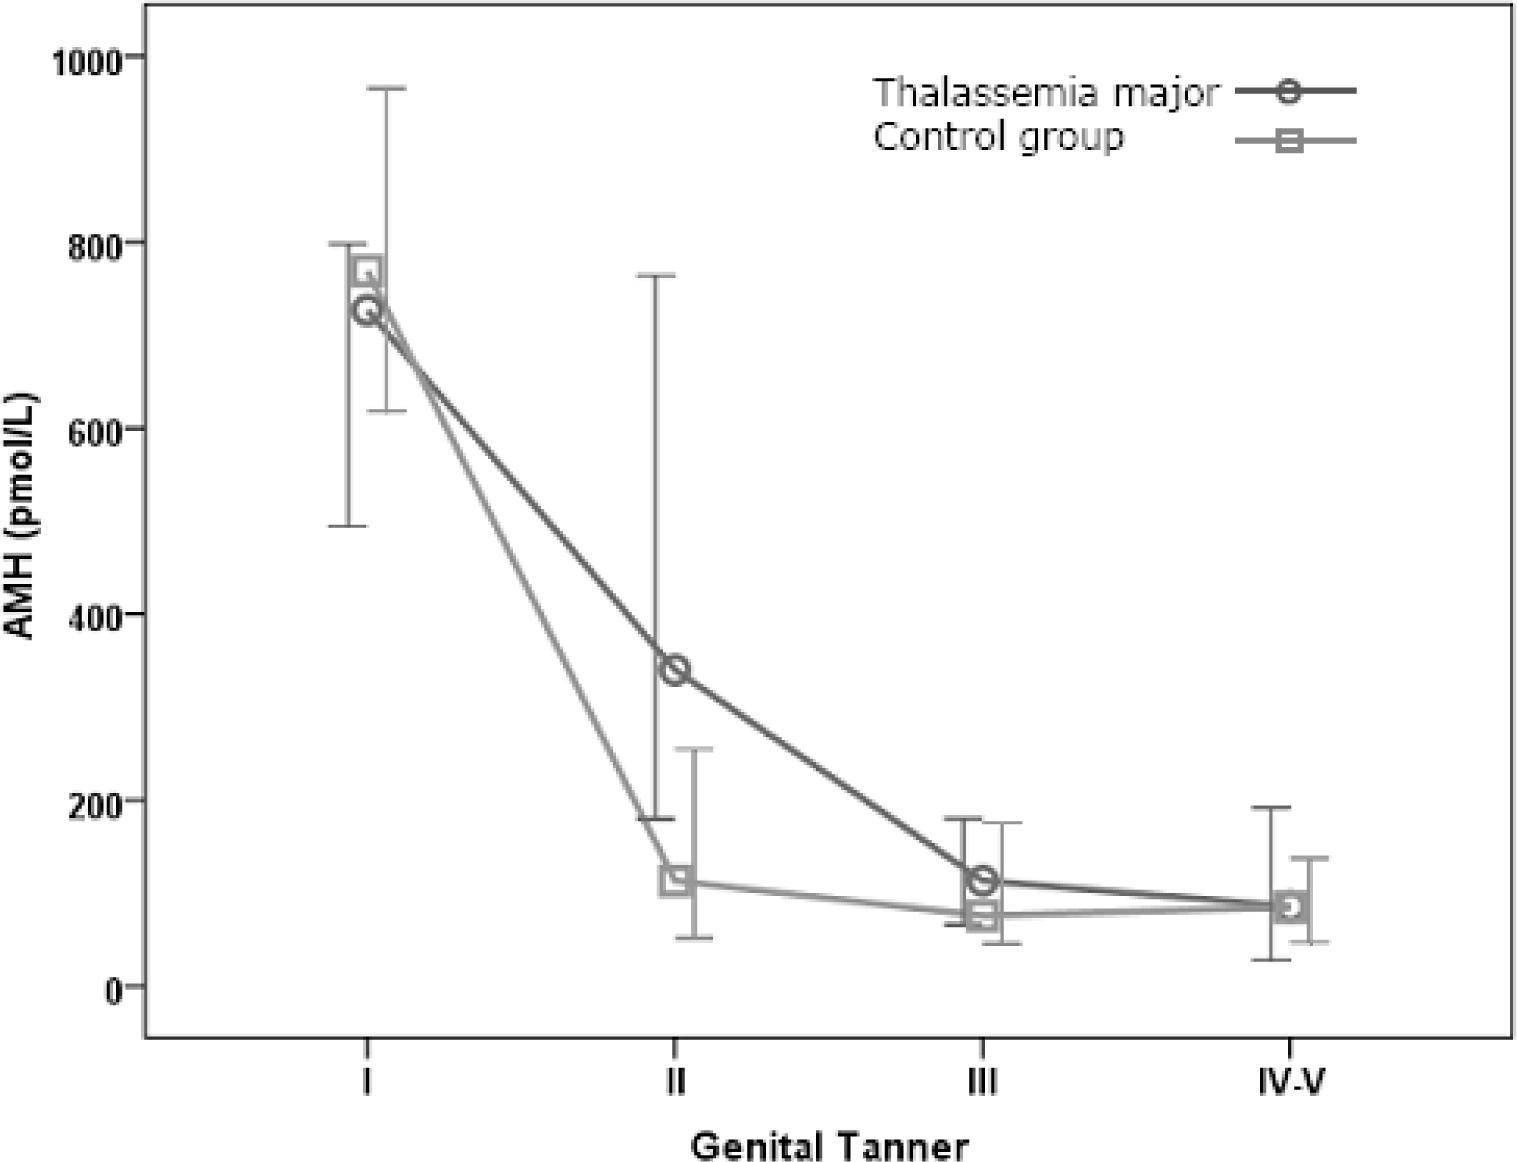
Figure 2
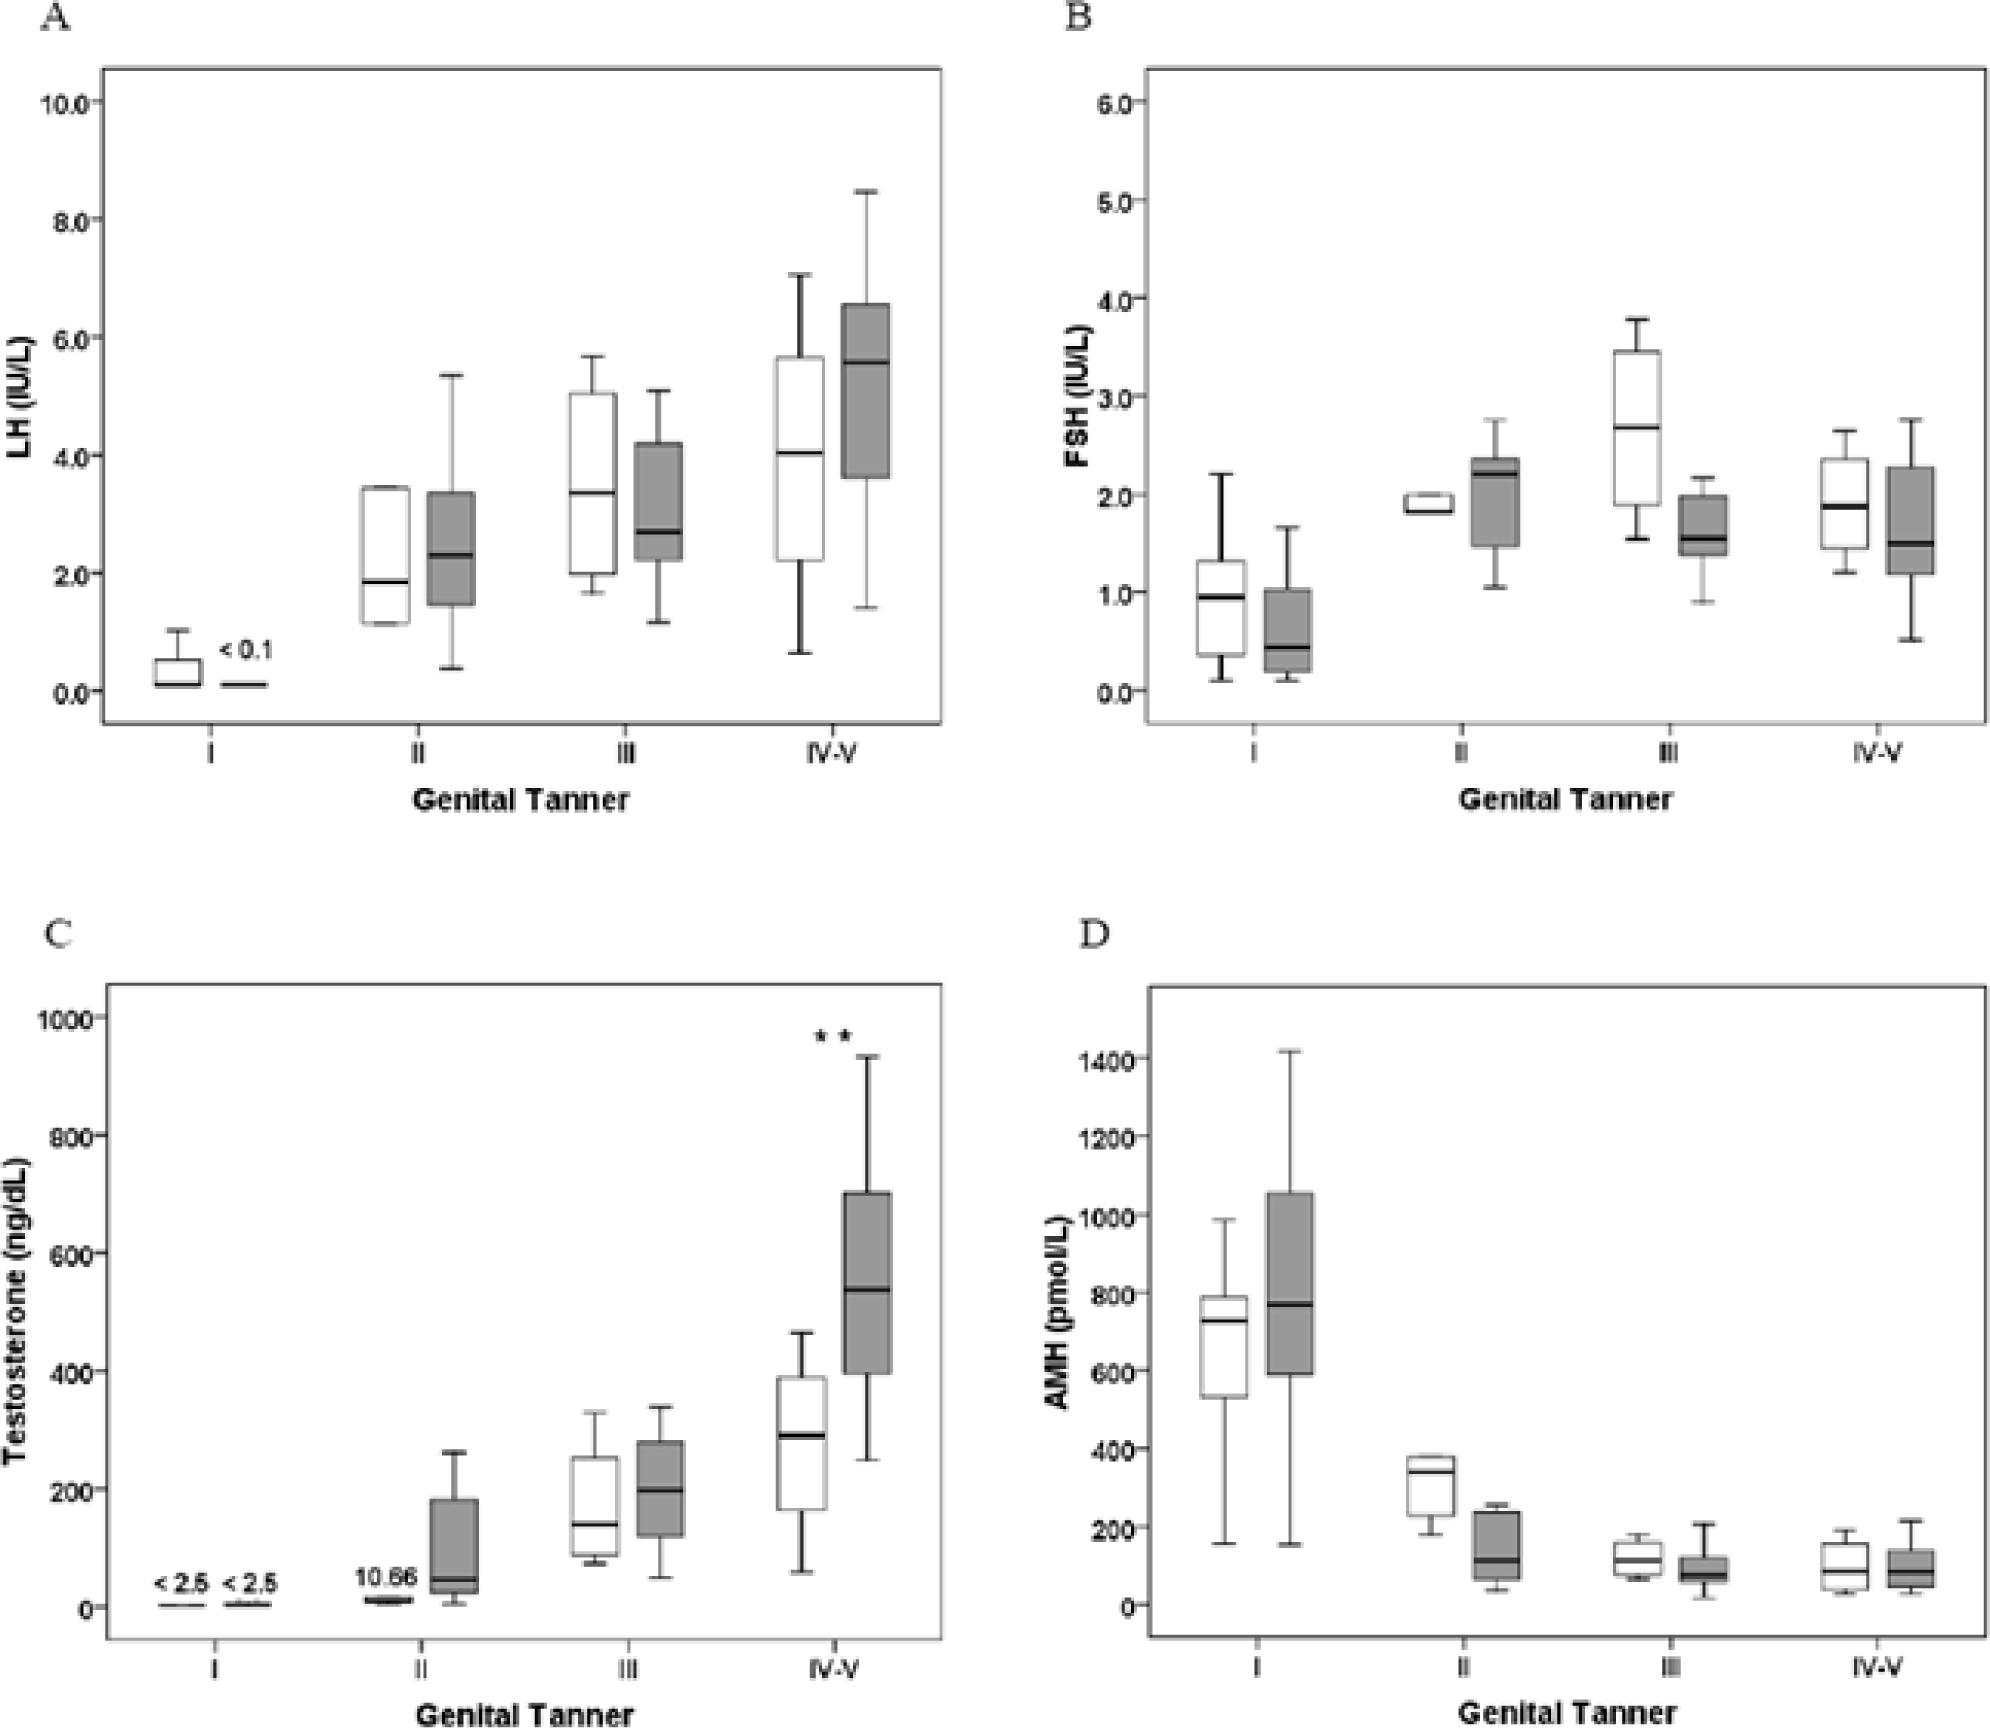
The testicular volume and basal LH, FSH, testosterone and AMH levels in patients with Thalassemia major and the controls
| Genital Tanner | n | Age (y) | Testicular volume (mL) | LH (IU/L) | FSH (IU/L) | Testosterone (ng/dL) | AMH (pmol/L) |
|---|---|---|---|---|---|---|---|
| Tanner I | |||||||
| Thalassemia | 15 | 10.6 ± 1.4 | 3 | <0.1 | 0.95 | <2.5 | 726.86 |
| (2–4) | (<0.1–0.5) | (0.3–1.42) | (494.29–797.86) | ||||
| Control | 26 | 10.6 ± 1.4 | <0.1 | 0.44 | <2.5 | 769.16 | |
| (0.18–1.1) | (<2.5–5.6) | (587.7–1,073.4) | |||||
| Tanner II | |||||||
| Thalassemia | 5 | 11.5 ± 1.0 | 5 | 1.85 | 1.82 | 10.66 | 340.0 |
| (4–7) | (1.1–3.4) | (1.3–2.0) | (6.3–26.2) | (203.82–570.68) | |||
| Control | 11 | 12.5 ± 0.9 | 2.3 | 2.2 | 46.1 | 113.17 | |
| (1.4–3.5) | (1.4–2.4) | (19.2–188.8) | (58.33–256.10) | ||||
| (P = 0.058) | |||||||
| Tanner III | |||||||
| Thalassemia | 4 | 13.3 ± 0.8 | 12 | 3.4 | 2.7 | 139.97 | 113.32 |
| (12–14.3) | (1.8–5.4) | (1.7–3.6) | (80.9–290.6) | (71.48–169.47) | |||
| Control | 9 | 13.7 ± 0.8 | 2.7 | 1.5 | 196.99 | 75.69 | |
| (2.1–4.2) | (1.3–2.0) | (117.0–294.1) | (55.25–134.84) | ||||
| Tanner IV-V | |||||||
| Thalassemia | 4 | 14.1 ± 1.0 | 20 | 1.9 | 4.0 | 290.88 | 85.71 |
| (14–20) | (1.3–2.5) | (1.4–6.4) | (111.5–426.6) | (33.75–173.89) | |||
| Control | 18 | 15.5 ± 2.0 | 1.5 | 5.6 | 537.4 | 84.68 | |
| (1.2–2.3) | (3.5–6.6) | (394.6–720.6) | (45.61–137.68) | ||||
| P <0.05 |
The demographic characteristics of patients with thalassemia major
| Characteristic | Mean ± SD (range) |
|---|---|
| Recent age (y) | 11.7 ± 1.8 (8–14.9) |
| Height (SDS) | −0.4 ± 0.87 (−2.3–1.5) |
| Weight (SDS) | −0.04 ± 0.87 (−1.2–2.2) |
| Age at diagnosis of thalassemia (y) | 1.9 ± 1.1 (0.4–4.4) |
| Onset of blood transfusion (y) | 3.8 ± 2.3 (0.6–9.1) |
| Onset of chelation therapy (y) | 6.6 ± 2.8 (2–12.1) |
| Serum ferritin level before start chelation therapy (ng/mL) | 1,645 ± 536 (1,019–2,846) |
| Mean ferritin level in 1 year (ng/mL) | 1,575 ± 642 (534–3,207) |
| Mean hemoglobin level in 1 year (g/dL) | 8.9 ± 0.7 (7.1–10) |
| Maximum ferritin level (ng/mL) | 3,169 ± 1,184 (1,419–6,220) |
| Age of maximum ferritin level (y) | 9.7 ± 2.4 (5.3–13.8) |