
Figure 1
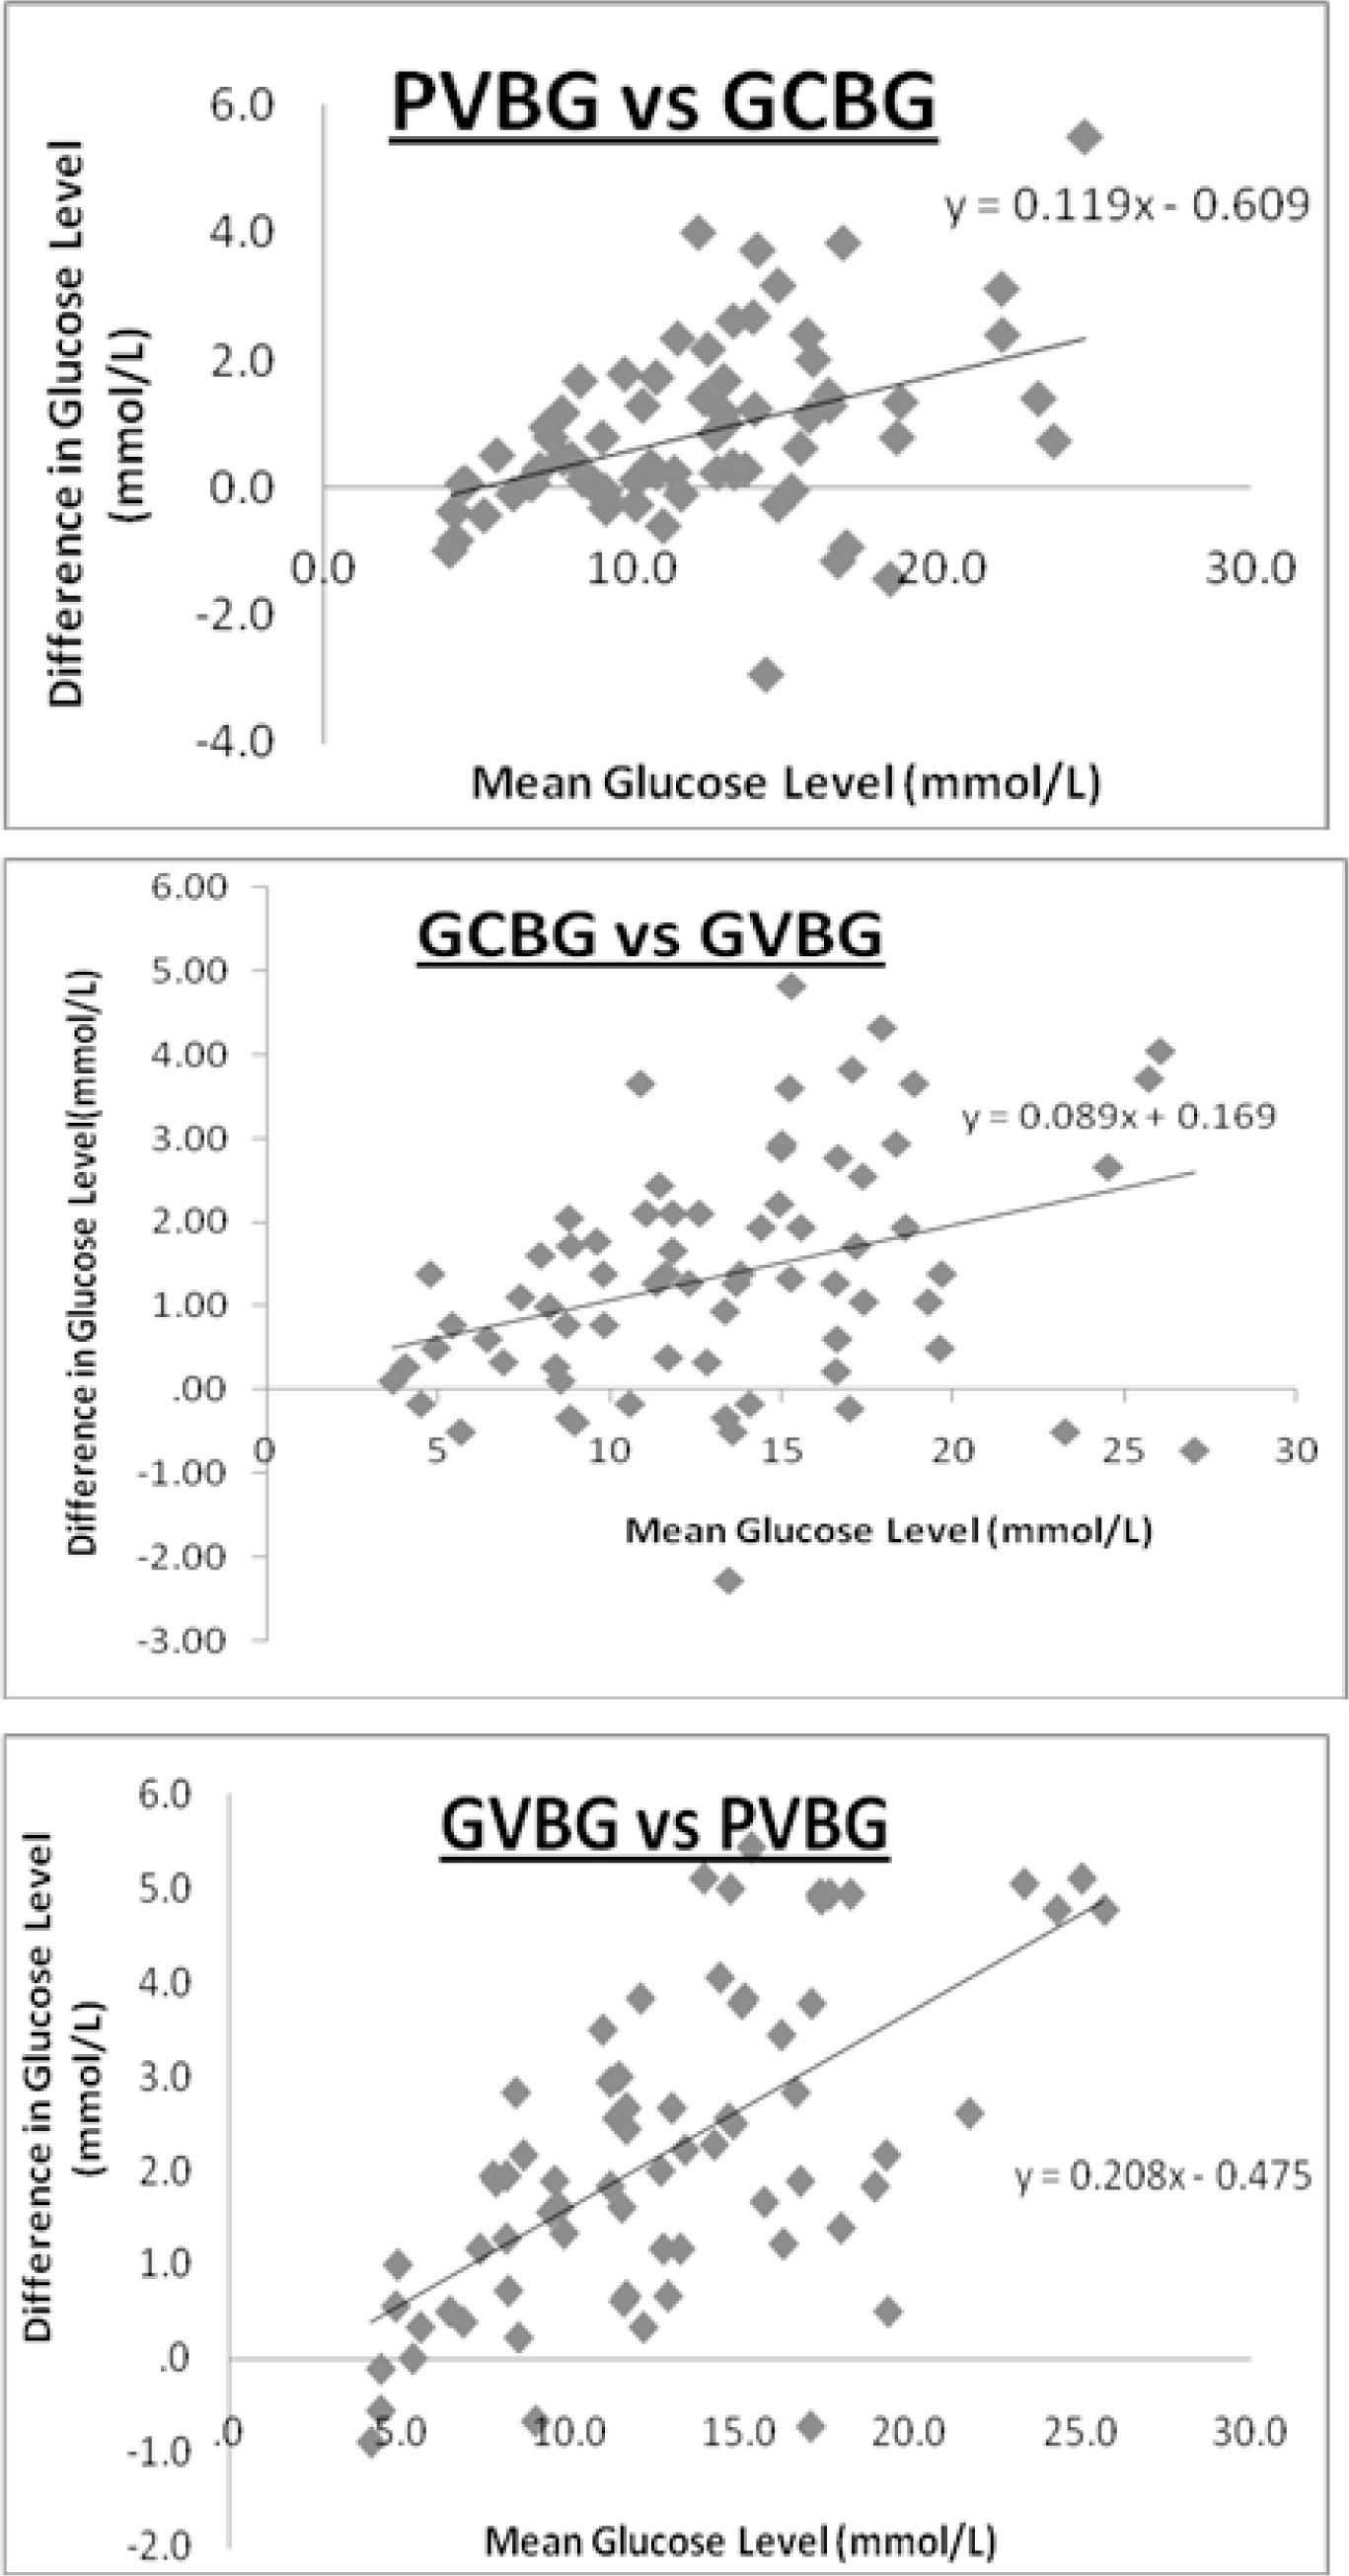
Comparison of different glucose estimation methods
| Paired Differences | |||||||
|---|---|---|---|---|---|---|---|
| Mean | SD | 95% Confidence Interval of the Difference | P | ICC | CCC | ||
| Lower | Upper | ||||||
| PVBG Vs GCBG | 0.84 | 1.40 | 0.51 | 1.17 | <0.001 P < 0.05 was considered significant | 0.947 | 0.95 |
| (0.864-0.974) | (0.505-0.974) | ||||||
| GCBG Vs GVBG | 1.35 | 1.39 | 1.02 | 1.68 | <0.001 P <0.05 was considered significant | 0.939 | 0.94 |
| (0.643-0.978) | (0.507-0.962) | ||||||
| GVBG Vs PVBG | 2.19 | 1.67 | 1.79 | 2.59 | <0.001 P < 0.05 was considered significant | 0.871 | 0.87 |
| (0.149-0.160) | (0.515-0.887) | ||||||