
Table 1
Demographic and clinical characteristics of study participants.
| SOCIO-DEMOGRAPHICS | |||||
|---|---|---|---|---|---|
| CHARACTERISTIC | CONTROL (n = 100) | ET (n = 60) | ET-PLUS (n = 40) | χ² (df = 1); KRUSKAL WALLIS | p-VALUE |
| Age (years), mean ± SD (range) | 44.0 ± 12.6 (24–69) | 42.3 ± 14.5 (17–66) | 54.0 ± 13.8 (22–75) | H(2) = 7.69, p = 0.021 | Control vs ET: p = 1.000 (ns) Control vs ET-plus: p = 0.024 (significant) ET vs ET-plus: p = 0.058 |
| Sex (M/F) | 66/34 | 47/13 | 29/11 | χ² = 2.83 | p = 0.244 |
| Disease Duration (years) | 7 (IQR: 5–12) | 10 (IQR: 6–18) | |||
| Hypertension, n(%) | 11 (11%) | 14 (23%) | 15 (38%) | 1.701878 | 0.192043 |
| Diabetes, n (%) | 3 (3%) | 6 (10%) | 10 (25%) | 2.979291 | 0.084336 |
| Ischemic Heart Disease, n (%) | 0 (0%) | 6 (10%) | 1 (3%) | 1.081669 | 0.298324 |
| Hypothyroidism, n(%) | 4 (4%) | 2 (3%) | 1 (3%) | – | – |
| Tremor Feature | |||||
| Bilateral upper limb tremors | – | 60 (100%) | 40 (100%) | – | – |
| Lower limb tremors | – | 14 (23%) | 15 (38%) | 1.7 | 0.192 |
| Voice tremors | – | 20 (33%) | 23 (58%) | 4.78 | 0.029* |
| Head tremors | – | 8 (13%) | 13 (33%) | 4.22 | 0.040* |
| Tongue tremors | – | 13 (22%) | 16 (40%) | 3.08 | 0.079 |
Table 2
Tremor rating scale scores in ET vs ET-plus patients.
| TREMOR SCALE | ET (n = 60) | ET-PLUS (n = 40) | MANN-WHITNEY U p-VALUE | ɛ² |
|---|---|---|---|---|
| TETRAS ADL subscale (0–48) | 16 (11, 20) | 22 (14, 30) | <0.001 | 0.74 |
| TETRAS Performance subscale (0–64) | 24 (20, 29) | 34 (23, 41) | <0.001 | 0.766 |
| TETRAS Total score (0–112) | 41 (32, 48) | 58 (37, 72) | <0.001 | 0.78 |
| FTMRS Total score (0–144) | 30 (25, 37) | 44 (30, 63) | <0.001 | 0.798 |
| FTMTRS Severity%(0–144) | 21 (17, 26) | 31 (21, 44) | <0.001 | 0.795 |
| FTMRS Disability level | 1 (1, 2) | 2 (1, 3) | <0.001 | 0.884 |
[i] *Data are presented as median (IQR) unless otherwise specified.
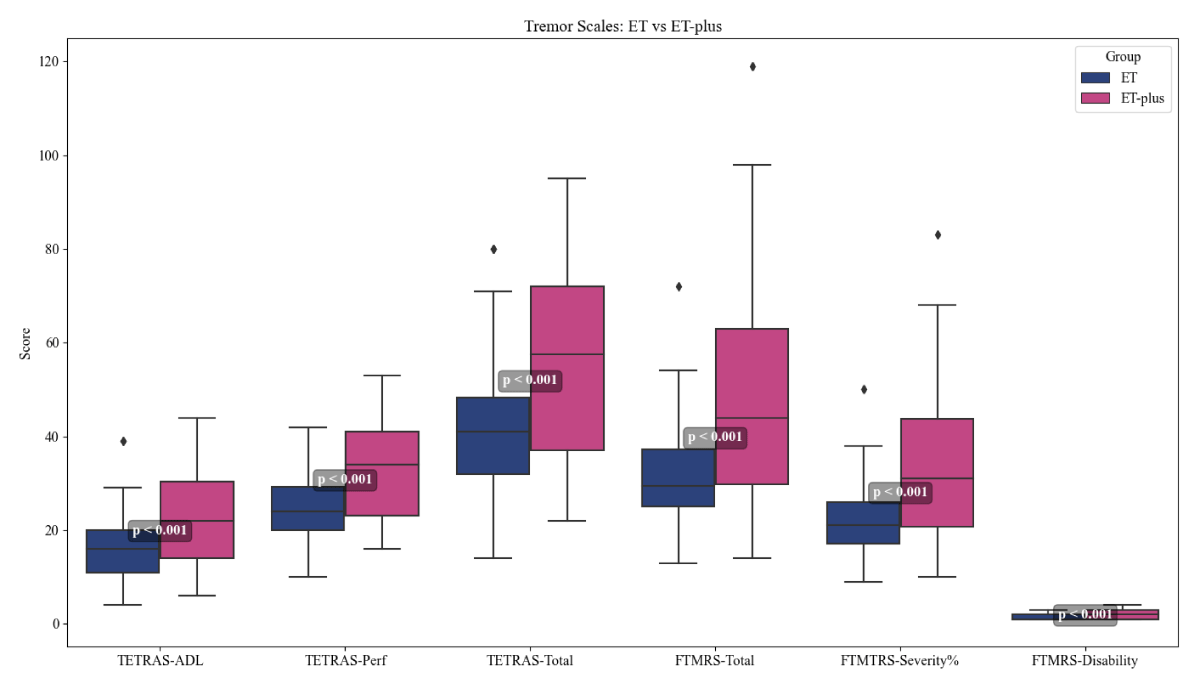
Figure 1
Tremor rating scales in ET and ET-plus groups.
Table 3
Pittsburgh Sleep Quality Index (PSQI) scores across groups.
| PSQI COMPONENTS | CONTROL (n = 100) | ET (n = 60) | ET-PLUS (n = 40) | KRUSKAL-WALLIS (df = 2) | p-VALUE | ɛ² | ET vs CONTROL | ET-PLUS vs CONTROL | ET vs ET-PLUS |
|---|---|---|---|---|---|---|---|---|---|
| Global PSQI score | 3 (2, 4) | 4 (3, 7) | 5 (3, 12) | 30.1 | <0.001 | 0.151 | <0.001* | <0.001* | 0.164 |
| Component 1: Subjective sleep quality | 1 (0, 1) | 1 (1, 2) | 1 (1, 2) | 48.91 | <0.001 | 0.246 | <0.001* | <0.001* | 0.095 |
| Component 2: Sleep latency | 1 (1, 1) | 1 (0, 1) | 1 (0, 1) | 3.51 | 0.173 | 0.018 | 0.139 | 0.909 | 0.561 |
| Component 3: Sleep duration | 0 (0, 0) | 0 (0, 1) | 1 (0, 1) | 14.82 | <0.001 | 0.075 | 0.186 | <0.001* | 0.128 |
| Component 4: Sleep efficiency | 0 (0, 1) | 1 (0, 1) | 1 (0, 2) | 11.94 | 0.003 | 0.06 | 0.018* | 0.010* | 0.664 |
| Component 5: Sleep disturbances | 1 (0, 1) | 1 (1, 1) | 1 (1, 2) | 38.98 | <0.001 | 0.196 | <0.001* | <0.001* | 0.333 |
| Component 6: Sleep medication use | 0 (0, 0) | 0 (0, 0) | 0 (0, 0) | 21.37 | <0.001 | 0.107 | <0.001* | <0.001* | 0.577 |
| Component 7: Daytime dysfunction | 0 (0, 1) | 1 (0, 1) | 1 (1, 2) | 37.91 | <0.001 | 0.191 | <0.001* | <0.001* | 0.039* |
[i] *Data are presented as median (IQR) unless otherwise specified.
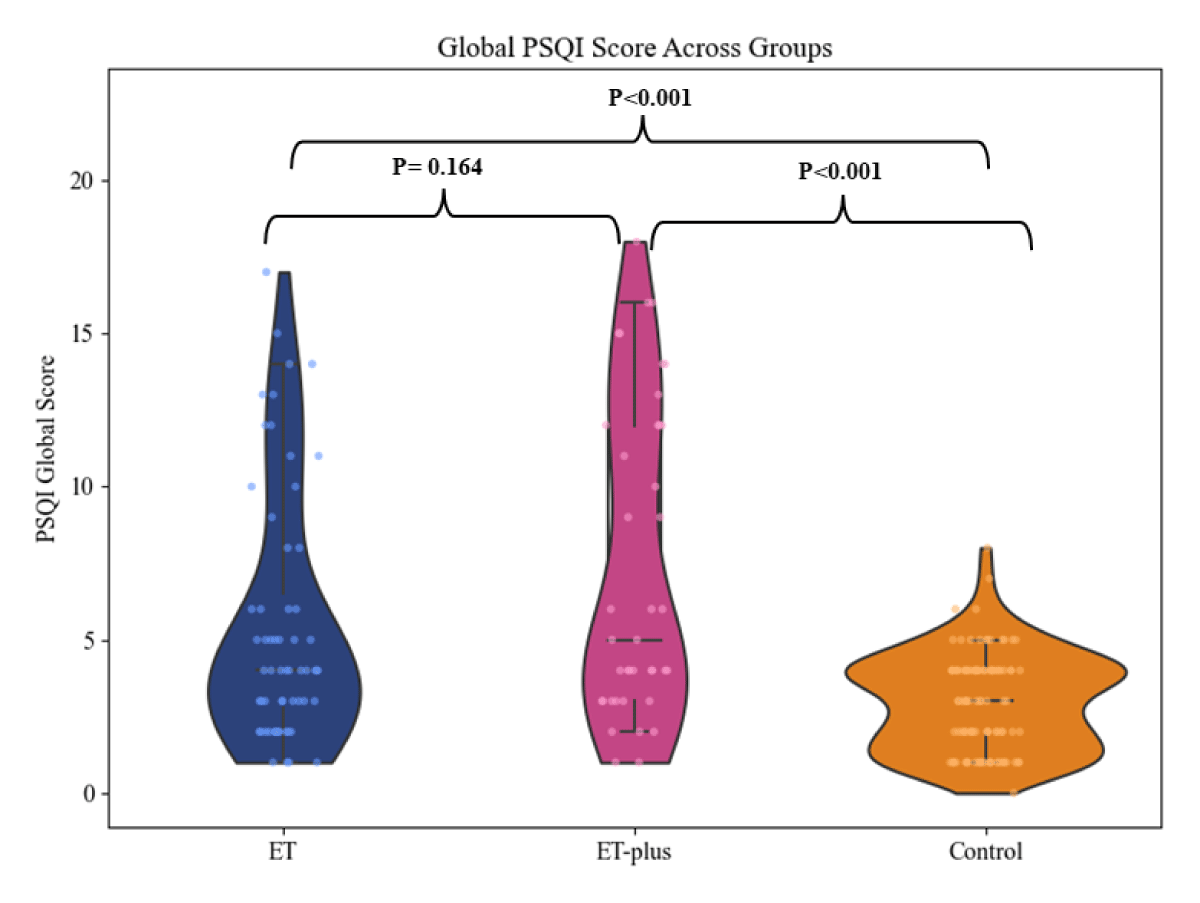
Figure 2
Distribution of Global PSQI scores across Control, ET, and ET-plus groups.
Table 4
Probable RBD, RLS, Somnambulism and Sleep Apnea screening across groups.
| VARIABLE | CONTROL (n = 100) | ET (n = 60) | ET-PLUS (n = 40) | χ² (df = 2) | p-VALUE | ɛ² | ET vs CONTROL | ET-PLUS vs CONTROL | ET vs ET-PLUS |
|---|---|---|---|---|---|---|---|---|---|
| MSQ I – Probable RBD (yes/no) | 9% | 17% | 30% | 14.94 | <0.001 | 0.075 | 0.012* | <0.001* | 0.639 |
| MSQ – RLS (yes/no) | 0% | 20% | 25% | 37.32 | <0.001 | 0.188 | <0.001* | <0.001* | 0.133 |
| MSQ – Somnambulism (yes/no) | 0% | 0% | 3% | 4 | 0.135 | 0.02 | – | 0.254 | 0.439 |
| BQ – Sleep Apnea (high risk) | 7% | 18% | 30% | 12.54 | 0.002 | 0.063 | 0.073 | 0.001* | 0.367 |
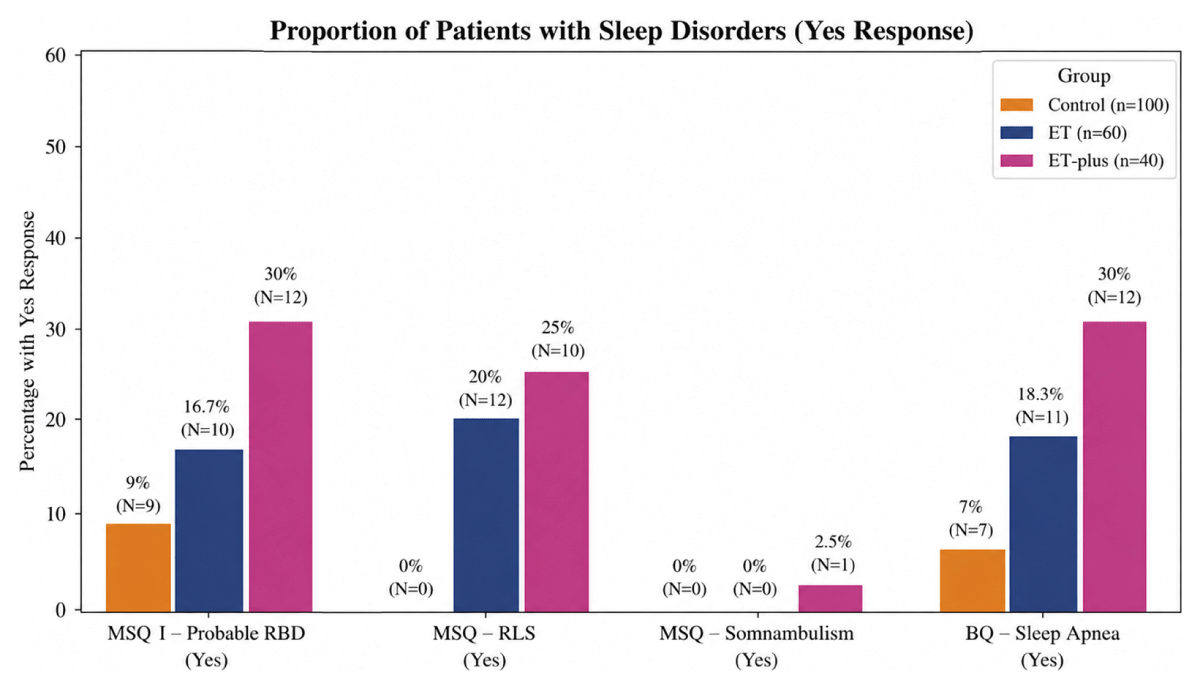
Figure 3
Prevalence of other sleep disorders across ET, ET plus and Controls.
Table 5
Cognitive, sleepiness, and psychiatric measures across groups.
| VARIABLE | CONTROL (n = 100) | ET (n = 60) | ET-PLUS (n = 40) | KRUSKAL WALLIS (df = 2) | p-VALUE | ɛ² | ET vs CONTROL | ET-PLUS vs CONTROL | ET vs ET-PLUS |
|---|---|---|---|---|---|---|---|---|---|
| MMSE score | 30 (29, 30) | 30 (30, 30) | 29 (23, 30) | – | – | – | – | – | <0.001* |
| ESS > 9 (Excessive sleepiness) | 1 (0, 3) | 3 (1, 5) | 4 (3, 7) | 21.15 | <0.001 | 0.106 | 0.007* | <0.001* | 0.301 |
| RLS severity (0–40) | 0 (0, 0) | 6 (5, 12) | 5 (3, 9) | 26.86 | <0.001 | 0.135 | <0.001* | <0.001* | 0.795 |
| GAD-7 (Anxiety severity) | 0 (0, 3) | 6 (3, 9) | 5 (4, 7) | 83.02 | <0.001 | 0.419 | <0.001* | <0.001* | 0.974 |
| PHQ-9 (Depression severity) | 3 (1, 6) | 5 (3, 9) | 5 (3, 6) | 23.48 | <0.001 | 0.118 | <0.001* | 0.006* | 0.665 |
[i] *Data are presented as median (IQR) unless otherwise specified.
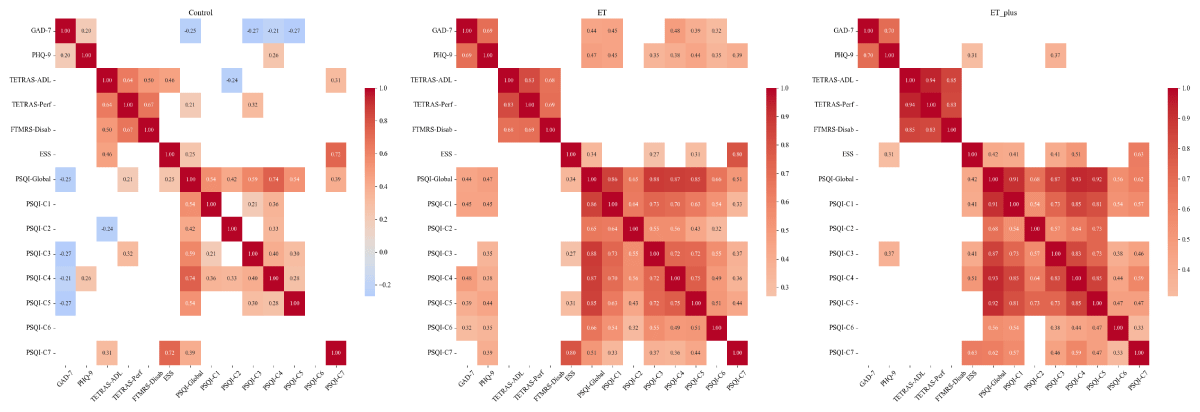
Figure 4
Correlation matrices of clinical and sleep parameters across ET, ET plus and Controls.