
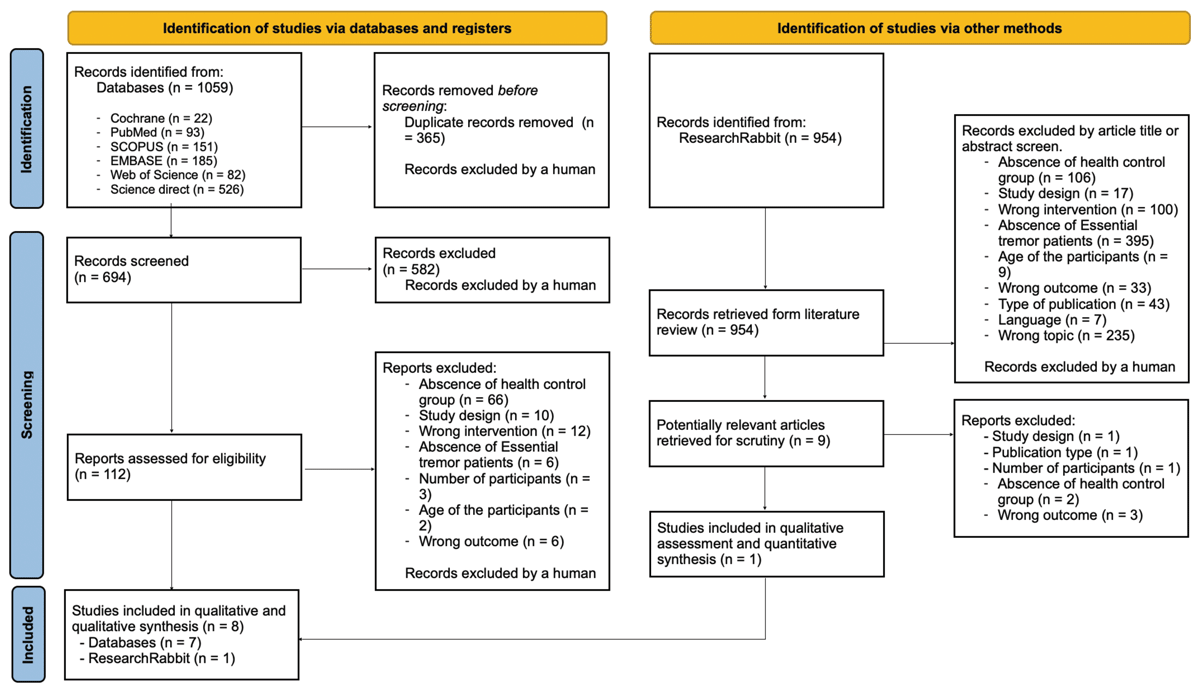
Figure 1
PRISMA flowchart.
Table 1
Summary of included studies.
| STUDY (YEAR) | DESIGN | LOCAL | PARTICIPANTS | MEN IN TE GROUP | AGE (SD) | IRB | |||
|---|---|---|---|---|---|---|---|---|---|
| TOTAL | ET | HC | ET | HC | |||||
| Lorenz et al (2008) [19] | Cross-sectional | Denmark/Germany | 624 | 190 | 346 | 122 | 74,7 (SI) | 74,1 (SI) | Yes |
| López-de-ipiña et al (2015) [26] | Cross-sectional | Spain | 51 | 24 | 27 | WI | WI | WI | No |
| López-de-ipiña et al (2016) [27] | Cross-sectional | Spain | 51 | 24 | 27 | WI | WI | WI | Yes |
| López-de-ipiña et al (2018) [23] | Feasibility study | Spain | 50 | 29 | 21 | WI | WI | WI | Yes |
| Jordi Solé-Casals et al (2019) [28] | Cross-sectional | Spain | 24 | 12 | 12 | WI | WI | WI | Yes |
| Ishii et al (2020) [13] | Cross-sectional | Japan | 108 | 36 | 36 | 15 | 73(12,4) | 67,4(10,9) | Yes |
| Roth, Brain-Beyamin, Rosenbaum (2021) [20] | Cross-sectional | Israel | 38 | 20 | 18 | 10 | 64,9(15,7) | 64,4(10,9) | Yes |
| Rajan et al (2023) [21] | Validação diagnóstica | India | 100 | 25 | 25 | 22 | 52,5(15,2) | 42,8(15,4) | Yes |
[i] ET – Essential tremor; HC – Health control; SD – standard deviation; IRB – Institutional Review Board; WI – Without information.
Table 2
Archimedes spiral characteristics summary.
| STUDY (YEAR) | HAND USED | ATTENUATING | ARM | DRAWING | START | DRAWING | ACQUISITION | OTHER DEVICES | AI USE | EVALUATION FORM | APPLIED SCALE | SENSIBILITY | SPECIFICITY ACCURACY | |
|---|---|---|---|---|---|---|---|---|---|---|---|---|---|---|
| MEDICATION | SUPPORT | DIRECTION | POINT | SHAPE | METHOD | |||||||||
| Lorenz et al(2008) [19] | Dominant | – | – | – | Inner | Guided | Paper | No | No | Amplitude + Regularity | BFS | 52.60% | 75.50% | 74.58% |
| Lôpez-de- ipina et al (2015) [26] | Most affected | – | – | – | – | – | Tablet | No | Yes | Linear characteristics + Entropy | – | 94.10% | 92.15% | 92.97% |
| Lôpez-de-ipina et al (2016) [27] | Best performance | – | – | Clockwise | – | Free | Tablet | EMG + Accelerometer | Yes | Linear characteristics + Entropy | FTM | – | – | 96.07% |
| Lôpez-de-ipina et al (2018) [23] | Both Hand | – | – | Clockwise | – | – | Tablet | No | Yes | Fractal dimension + Entropy | FTM | – | – | 94.11% |
| Jordi Solé- t’asalset al (2019) [28] | Both Hand | – | – | – | – | – | Tablet | No | Yes | DCT + Residual + Radius | WHIGET | 100% | 96.42% | 97.96% |
| Ishii et al (2020) [13] | – | – | – | – | Outer | Guided | Paper | No | Yes | Mean deviation + Percentage of spiral length | TETRAS | 44% | 79% | 70% |
| Roth, Brain-Beyamin, Rosenbaum (2021) [20] | – | – | Yes | Clockwise | – | Guided | Tablet | No | No | Radial deviation + Drawing speed | TETRAS | – | – | – |
| Rajan et al (2023) [21] | Dominant | No | No | Clockwise | Inner | Free | Paper | EMG + Accelerometer | Yes | Mean deviation + Tremor variability | BFSRS | 80.90% | 76.00% | 78.45% |
[i] FTM – Fahn-Tolosa-Marin; BFS – Bain-Findley spiral Rating Scale; TETRAS – Tremor Research Group Essential Tremor Rating Assessment Scale; WHIGET – Washington. Heights-Inwood Genetic Study of Essential Tremor; DCT – Discrete Cosine Transform.
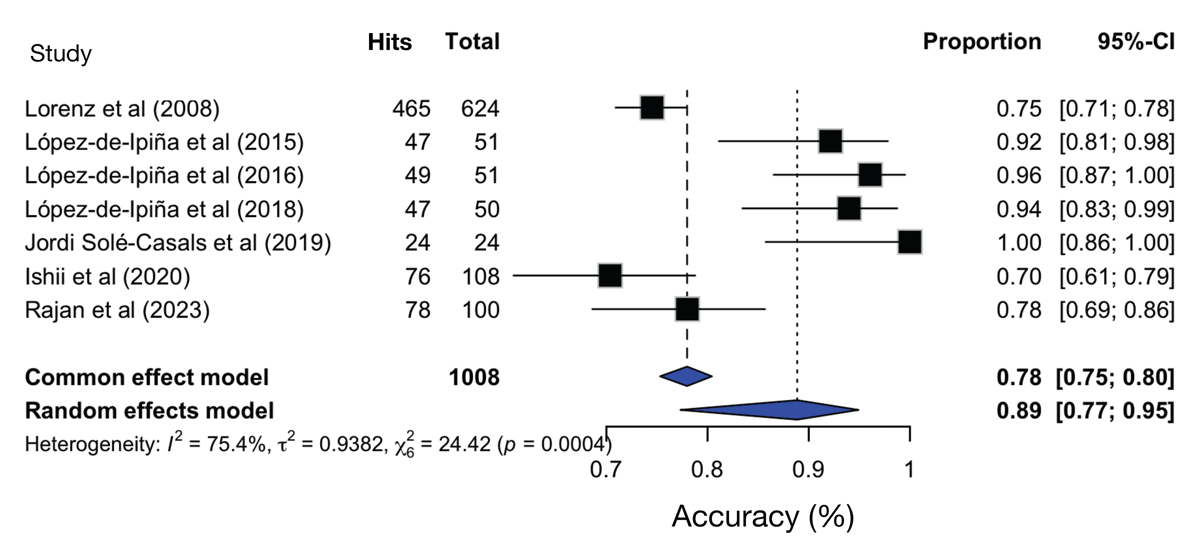
Figure 2
Forest-plot of global ET diagnosis accuracy.
I2 – Heterogeneity test; τ2 – Variance between studies; CI – Confidence interval.
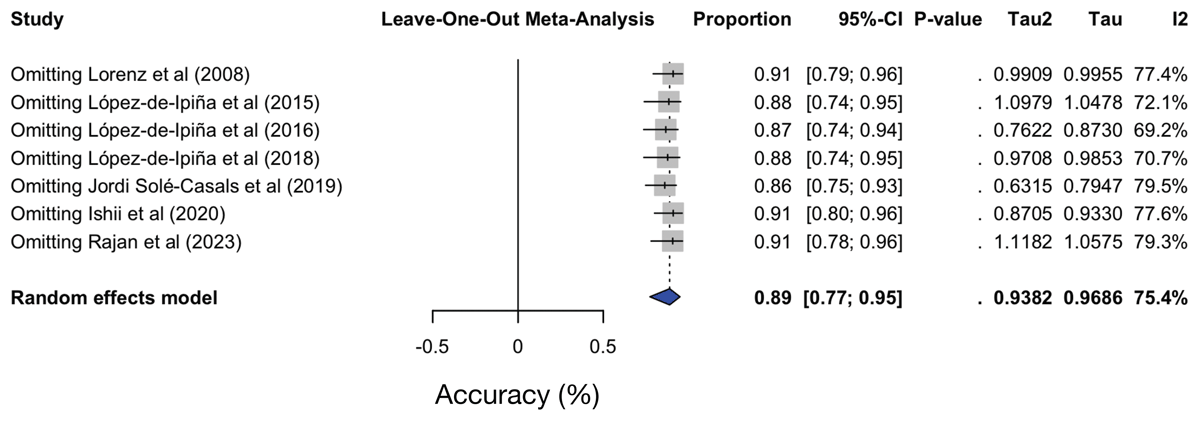
Figure 3
Sensitivity analyses.
I2 – Heterogeneity test; τ2 – Variance between studies; CI – Confidence interval.