

Figure 1
Global diagram of (V)AE-based sound analysis-transformation-synthesis.
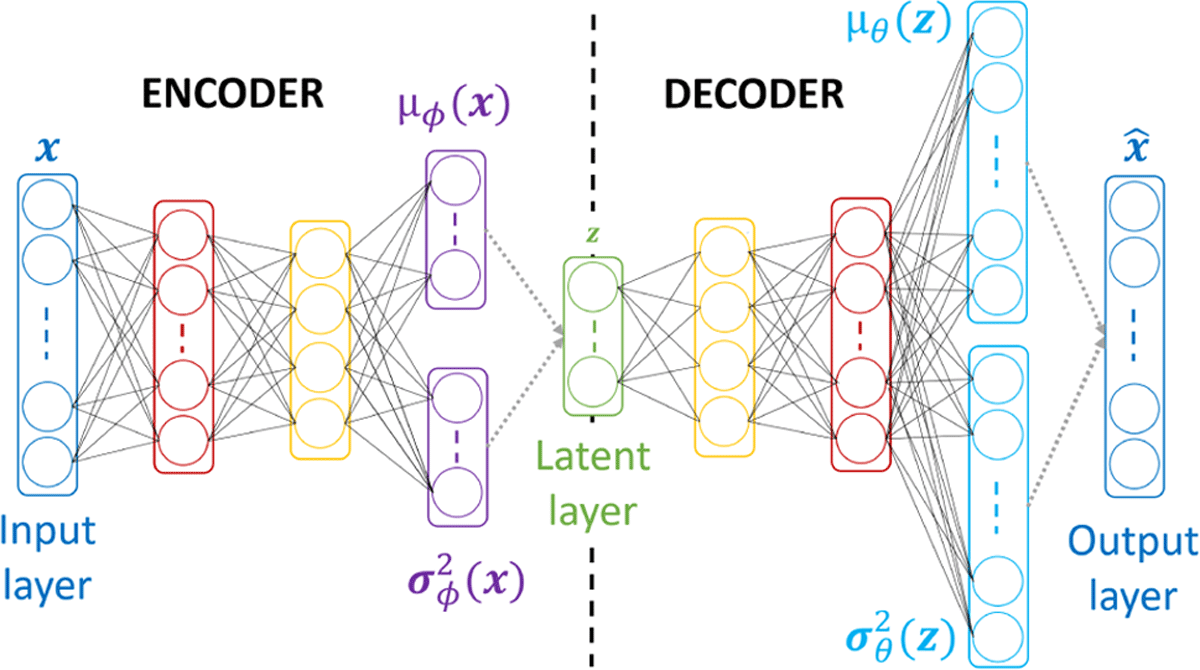
Figure 2
General architecture of a VAE. Grey dotted arrows represent sampling processes.

Figure 3
Global diagram of the semantic proximity analysis.
Table 1
Frequency and transversality measures of the eight most frequent and transverse semantic clusters, represented by the most frequent and transverse verbal descriptor within each cluster. The frequency of the semantic clusters is expressed as percentages of the evaluated sounds for each participant and their transversality as percentages of the total number of participants. The frequency and transversality of the verbal descriptors are expressed as percentages of the expressions within each cluster.
| Semantic Cluster | Frequency (in %) | Transversality (in %) | ||
|---|---|---|---|---|
| Semantic Cluster | Isolated Verbal Desc. | Semantic Cluster | Isolated Verbal Desc. | |
| Qui résonne (cluster of 8 expressions) | 13.5 | 25.7 | 47.5 | 37.5 |
| Métallique (cluster of 4 expressions) | 10.6 | 52.6 | 43.6 | 75.0 |
| Agressif (cluster of 4 expressions) | 9.9 | 47.6 | 40.6 | 48.8 |
| Qui vibre (cluster of 7 expressions) | 7.8 | 43.5 | 46.5 | 40.4 |
| Chaud (cluster of 4 expressions) | 7.7 | 45.8 | 36.6 | 40.5 |
| Qui évolue (cluster of 8 expressions) | 5.7 | 27.0 | 29.7 | 33.3 |
| Soufflé (cluster of 5 expressions) | 4.5 | 43.5 | 25.7 | 57.7 |
| Percussif (cluster of 4 expressions) | 3.6 | 37.8 | 25.7 | 26.9 |
Table 2
Intra- and inter-listener agreement on the eight perceptual dimensions, for the second perceptual test. The first two columns give information on the intra-listener agreement: the average Pearson’s coefficient R and the percentage of participants showing an R > 0.5. The four last columns report the levels of inter-listener agreement observed over the whole group of participants and for each group of participants identified from the HAC analysis (the percentage of participants in each group being reported in brackets).
| Perceptual dimension | Intra-listener agreement | Inter-listener agreement | ||||
|---|---|---|---|---|---|---|
| Average Pearson’s R | % of part. for whom R > 0.5 | Average Pearson’s R (% of participants) | ||||
| All | 1st cluster (selected) | 2nd cluster | 3rd cluster | |||
| Métallique | 0.59 | 69.0% | 0.38 | 0.47 (59.2%) | 0.40 (40.8%) | |
| Chaud | 0.50 | 64.8% | 0.36 | 0.48 (43.5%) | 0.39 (37.0%) | 0.45 (19.5%) |
| Soufflé | 0.58 | 66.2% | 0.31 | 0.40 (53.2%) | 0.35 (46.8%) | |
| Qui vibre | 0.38 | 49.3% | 0.23 | 0.42 (62.9%) | 0.30 (37.1%) | |
| Percussif | 0.81 | 87.3% | 0.56 | 0.62 (85.5%) | 0.40 (14.5%) | |
| Qui résonne | 0.41 | 57.7% | 0.23 | 0.33 (56.1%) | 0.27 (43.9%) | |
| Qui évolue | 0.54 | 67.6% | 0.42 | 0.47 (70.8%) | 0.49 (29.2%) | |
| Agressif | 0.68 | 81.7% | 0.51 | 0.58 (60.3%) | 0.60 (27.6%) | 0.57 (12.1%) |
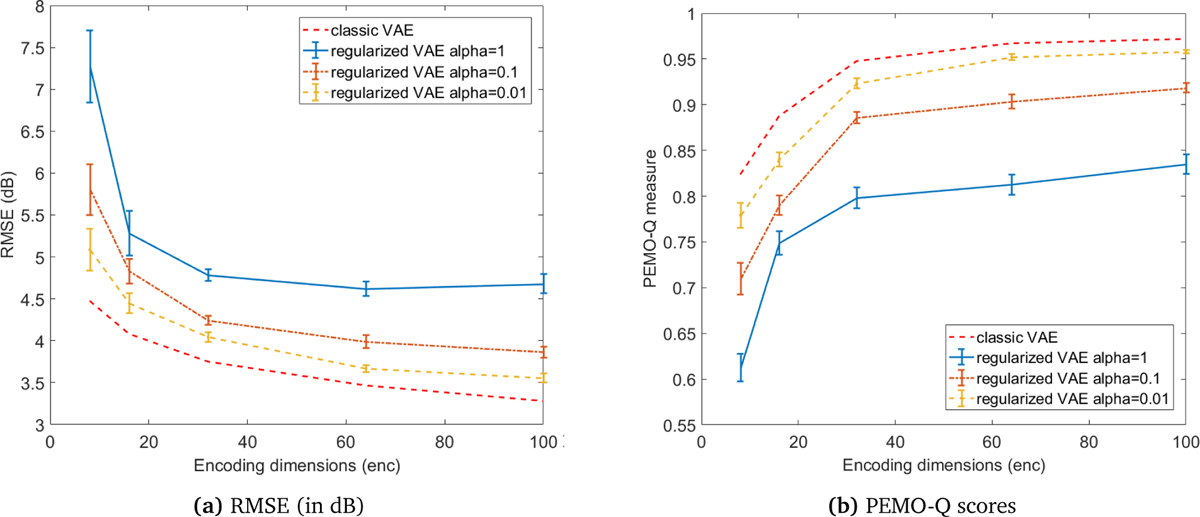
Figure 4
Performance of the classic VAE and the proposed perceptually-regularized VAE in terms of (a) RMSE (in dB) and (b) PEMO-Q scores, for three values of α (error bars represent 95% confidence intervals calculated with paired t-tests considering the classic VAE as the reference).
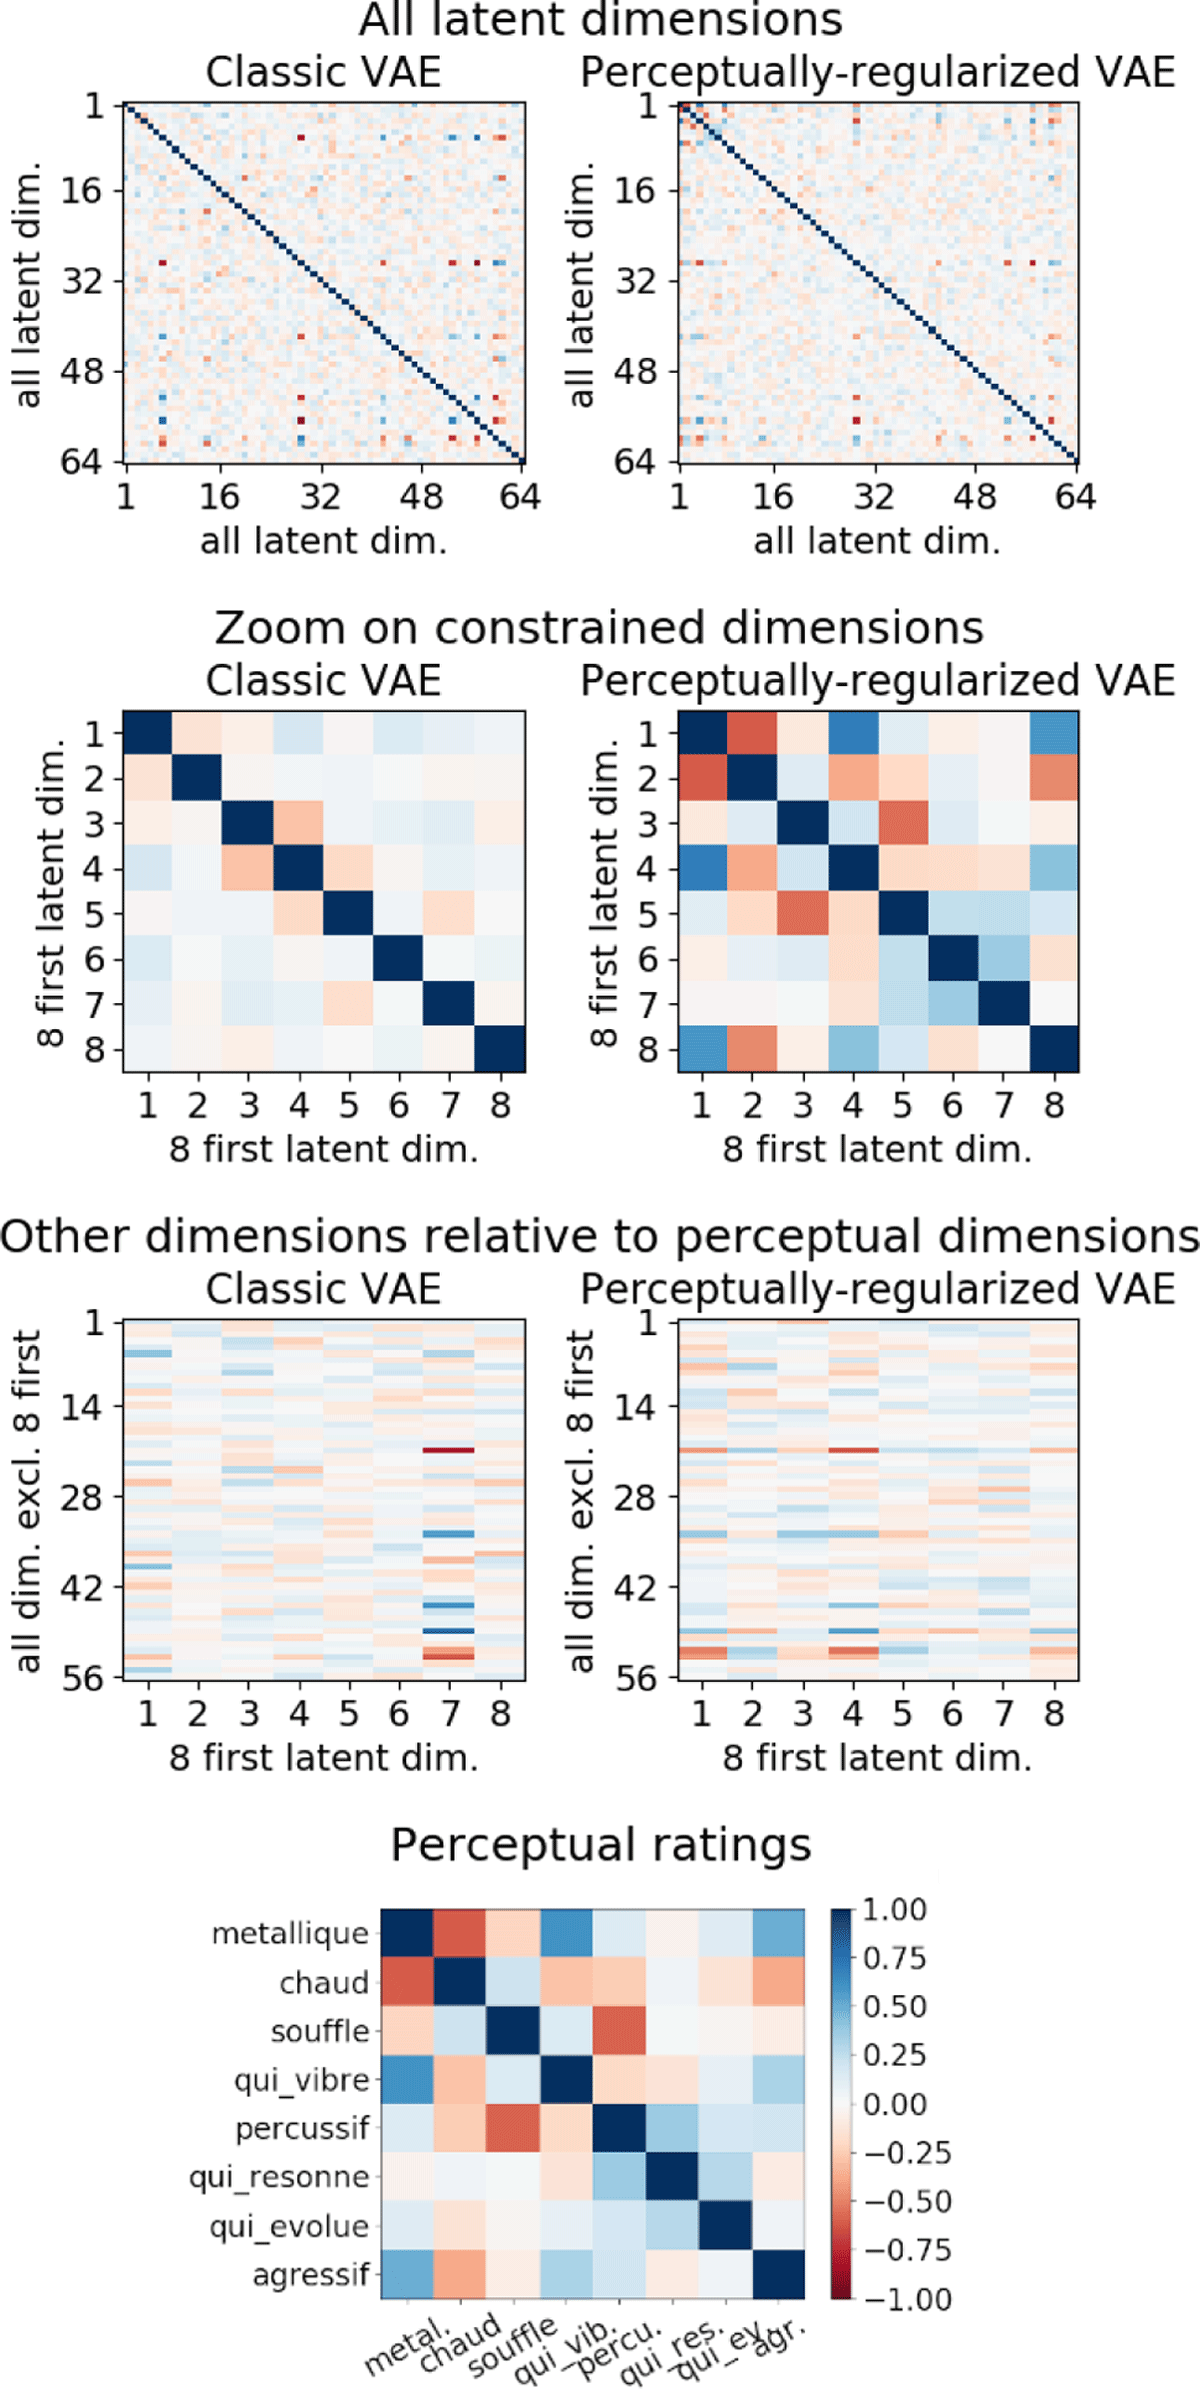
Figure 5
Spearman correlation coefficients between extracted latent dimensions (first three rows) and perceptual ratings (last row).
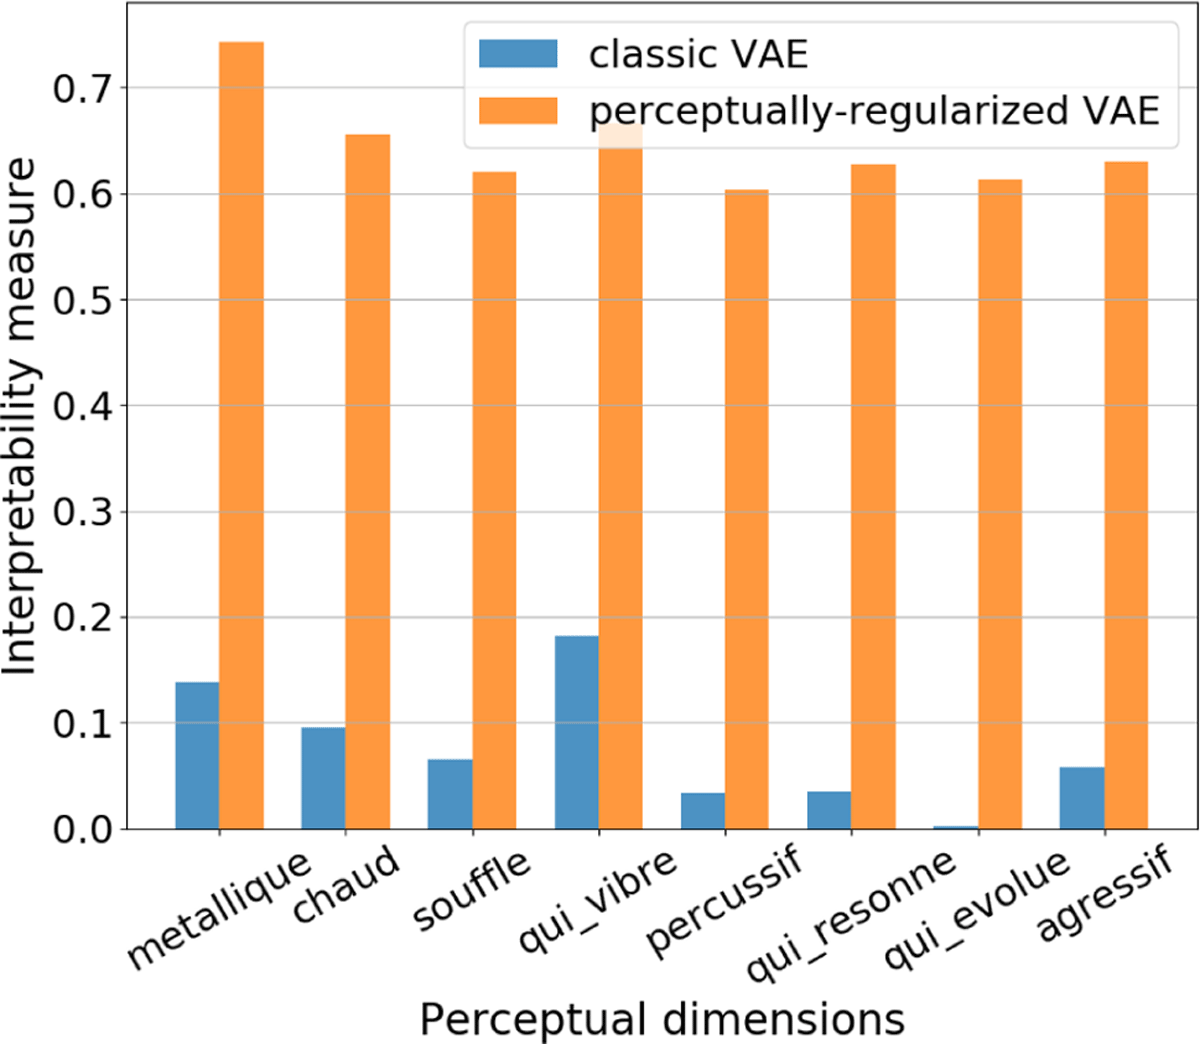
Figure 6
Interpretability measure (Pati and Lerch, 2020) for the first eight dimensions of the latent space.
Table 3
Averaged mapping and disentanglement metrics (Pati and Lerch, 2020) obtained for the classic and perceptually-regularized VAE models.
| SCC | Interpretability | MIG | SAP | |
|---|---|---|---|---|
| Classic VAE | 0.3216 | 0.0762 | 0.0035 | 0.0264 |
| Perceptually-regularized VAE | 0.7895 | 0.6448 | 0.0513 | 0.4275 |
Table 4
Statistical results of the perceptual A/B test results for the five selected perceptual dimensions. Effect of the train/test data origin factor (first two columns). Comparison of the perceptual choice (A/B) with chance level (third and fourth columns). Inter-listener agreement using Randolph’s free-marginal multi-rater kappa (Randolph, 2005) (last column).
| Dimension | “train/test dataset” factor | Chance threshold comparison | Inter-listener agreement | ||
|---|---|---|---|---|---|
| χ2 | p-value | z | p-value | Randolph’s κ | |
| Agressif | 0.026 | 0.87 | 3.39 | ≪0.0001 | 0.50 |
| Chaud | 1.07 | 0.30 | 0.37 | 0.36 | 0.08 |
| Métallique | 0.43 | 0.61 | 1.47 | 0.07 | 0.29 |
| Soufflé | 0.002 | 0.96 | 0.25 | 0.40 | 0.36 |
| Qui vibre | 0.76 | 0.38 | 3.93 | ≪0.0001 | 0.27 |
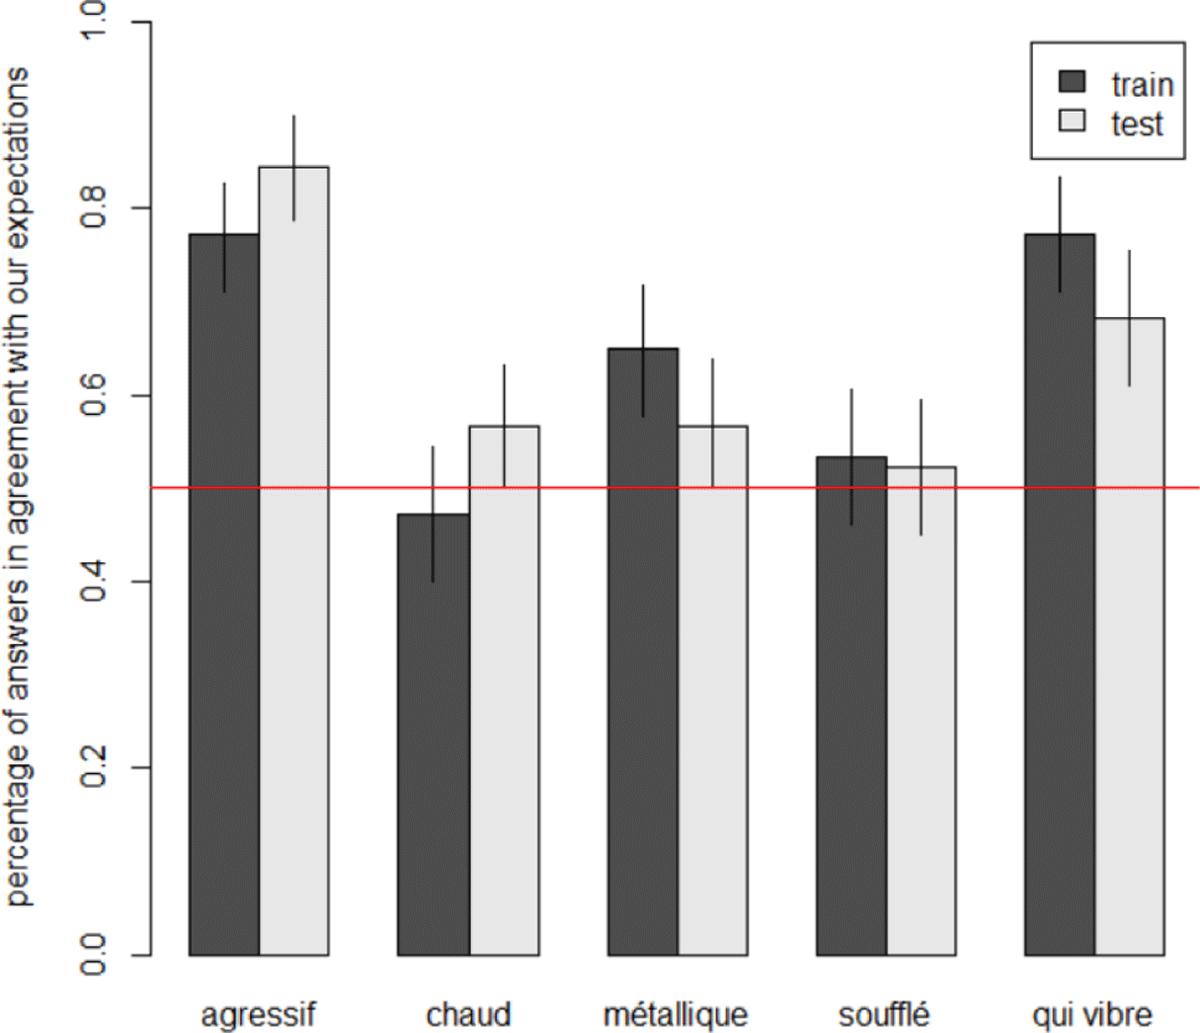
Figure 7
Results of the A/B perceptual test for five perceptual dimensions and for labeled stimuli (train) and new unknown ones (test). Bars represent mean values, error bars represent 95% confidence interval, and the red line indicates chance level.