
| roots | Requires enharmonic agreement only at the root of the chord, ignoring quality or bass. Example: C♯:min ≡ D♭:maj ≢ C:min. |
| thirds | Requires agreement only at the root and the third scale degree, ignoring other pitch classes. Example: C:maj ≡ C:aug ≢ C:min. |
| triads | As above, but including the fifth, and ignoring additional pitch classes. Example: C:maj ≡ C:7 ≢ C:aug. |
| sevenths | Compares the root, third, fifth, and seventh, ignoring above-octave extensions.2 Example: C:9 ≡ C:7 ≢ C:maj7. |
| tetrads | Compares all 12 pitch classes (including the root). |

Figure 1
Two examples of automatic hierarchy expansion. In both examples, the contraction level (green, top) removes variation markers, while the refinement level (blue, bottom) adds counters to each instance of a segment label. The center level (orange) preserves the original annotation. The left example is a flat segmentation with segments (A, B, A′, B, B) expanded into a three-level hierarchy. The right example has a flat segmentation with structural labels (Intro, VerseA, Chorus, VerseA, VerseB, Chorus).
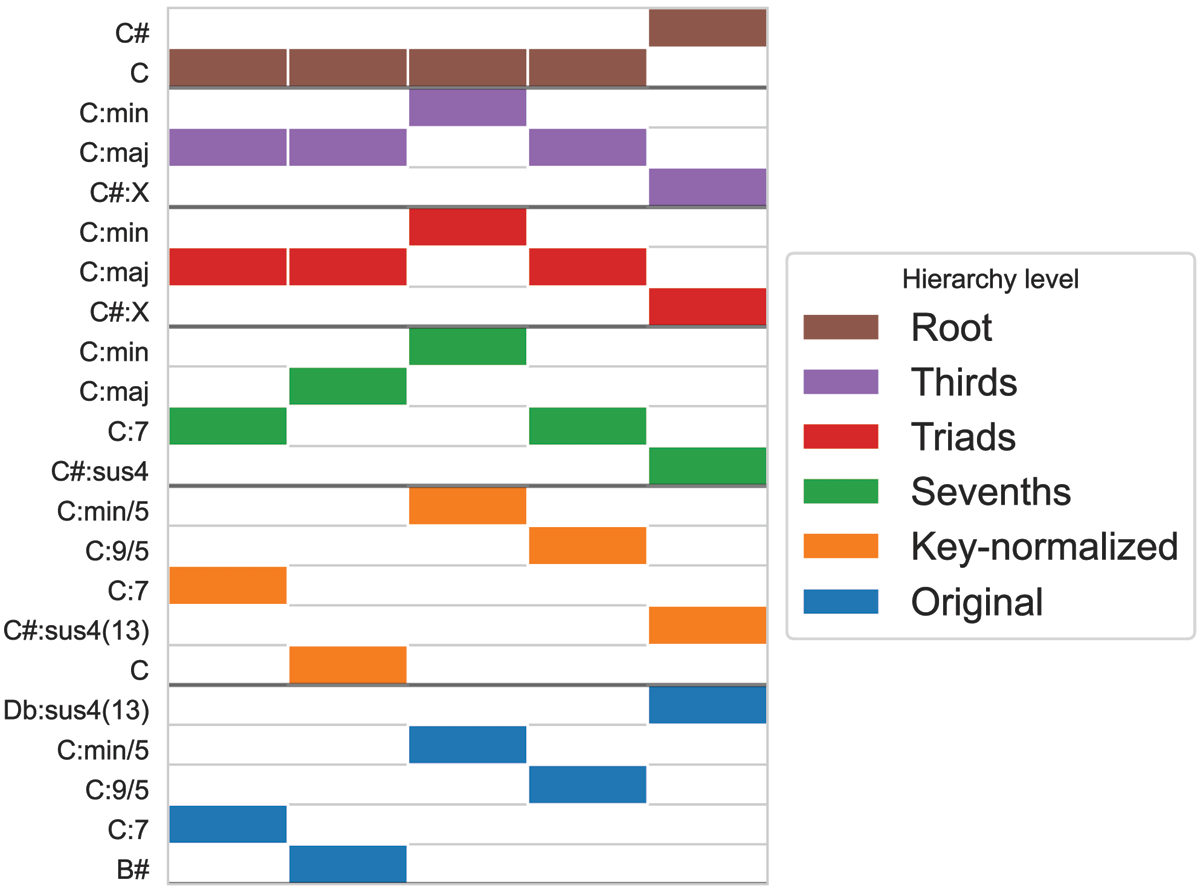
Figure 2
An example of automatic hierarchy expansion applied to chord annotations. The original (full detail) labels form the bottom layer of the hierarchy, and each successive layer represents simplification: key normalization, extension elimination, then simplification to triads, thirds, and finally the roots at the top of the hierarchy.
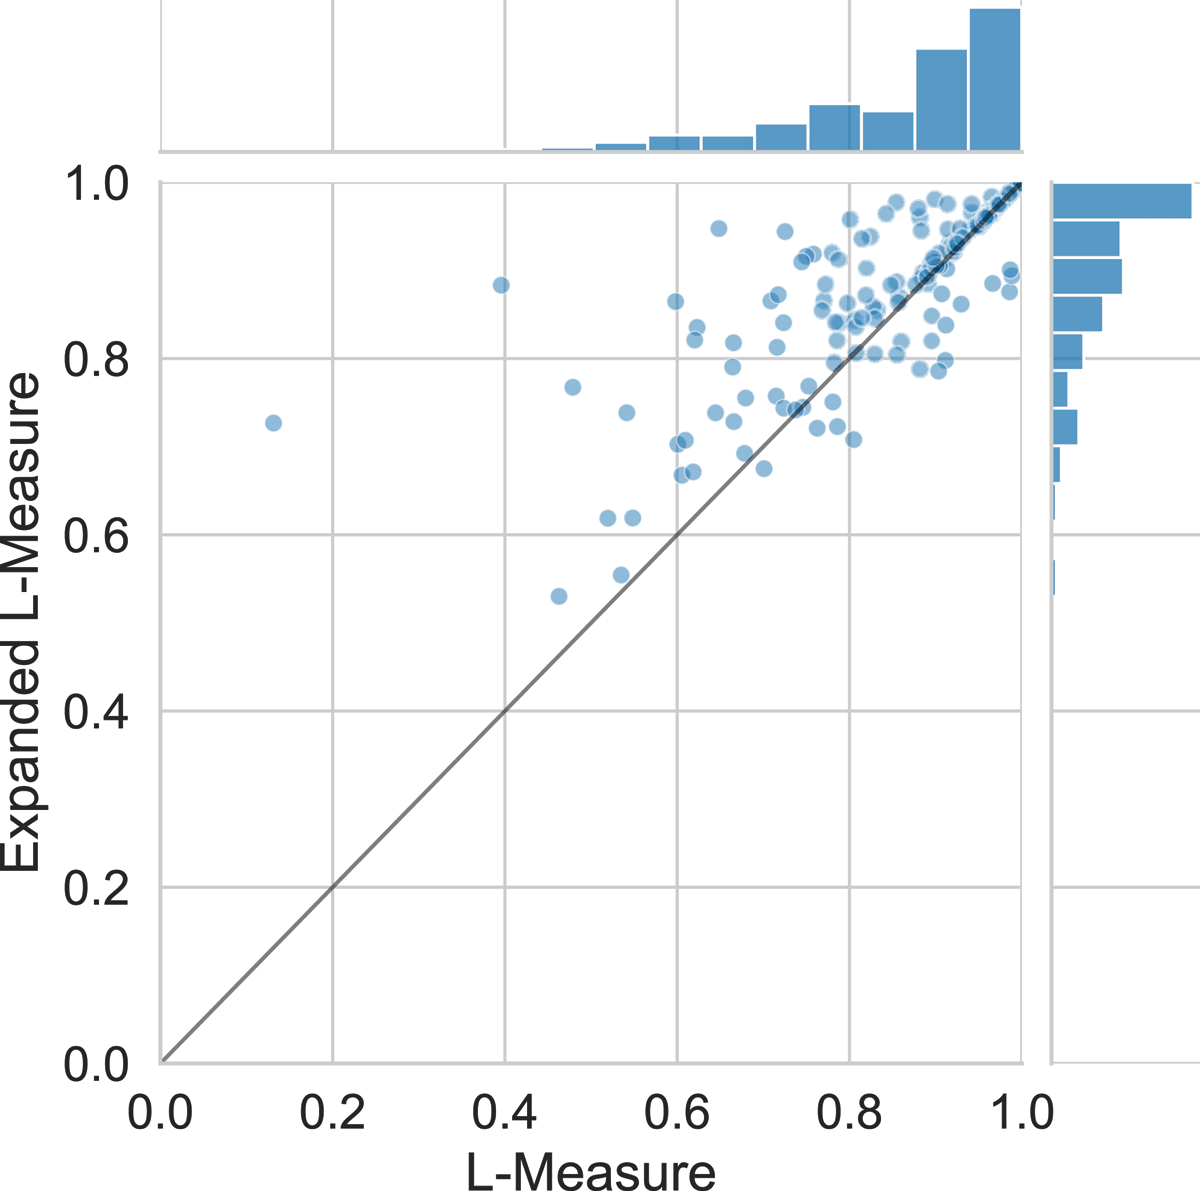
Figure 3
A comparison of structure agreement between the TUT and Isophonics examples using the L-measure before automatic hierarchy expansion (horizontal axis) and after expansion (vertical axis).
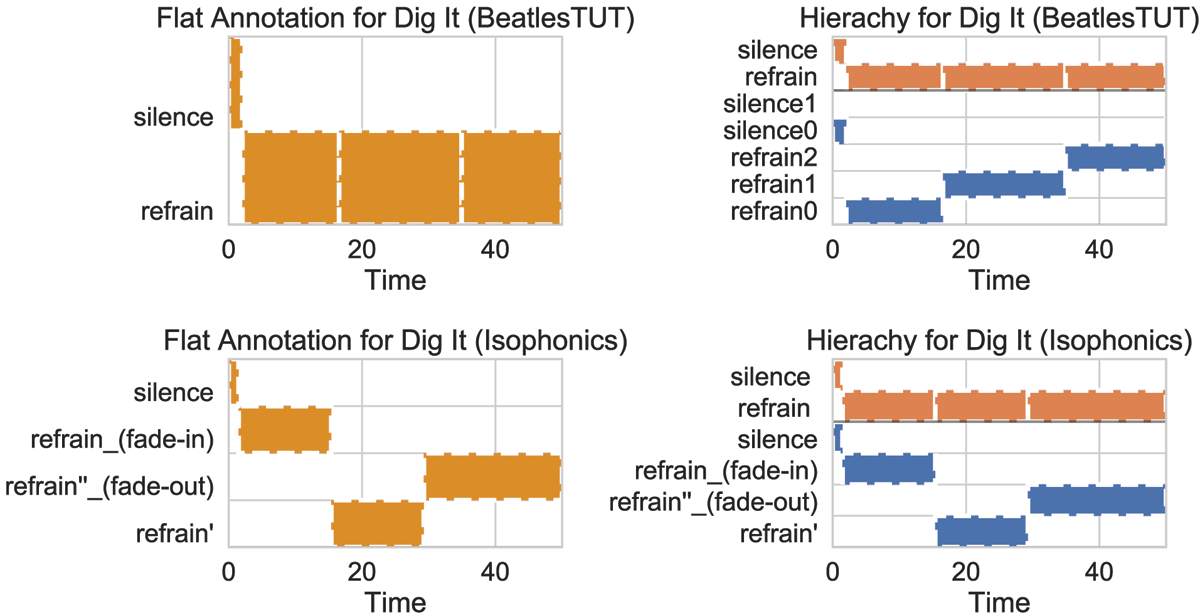
Figure 4
Extreme example “Dig It” where hierarchy expansion increases the L-measure from flat annotations by +0.595. Top left: Flat annotation in Beatles-TUT; Top right: Automatic hierarchy expansion for Beatles-TUT annotation; Bottom left: Flat annotation in Isophonics; Bottom right: Automatic hierarchy expansion for Isophonics annotation.
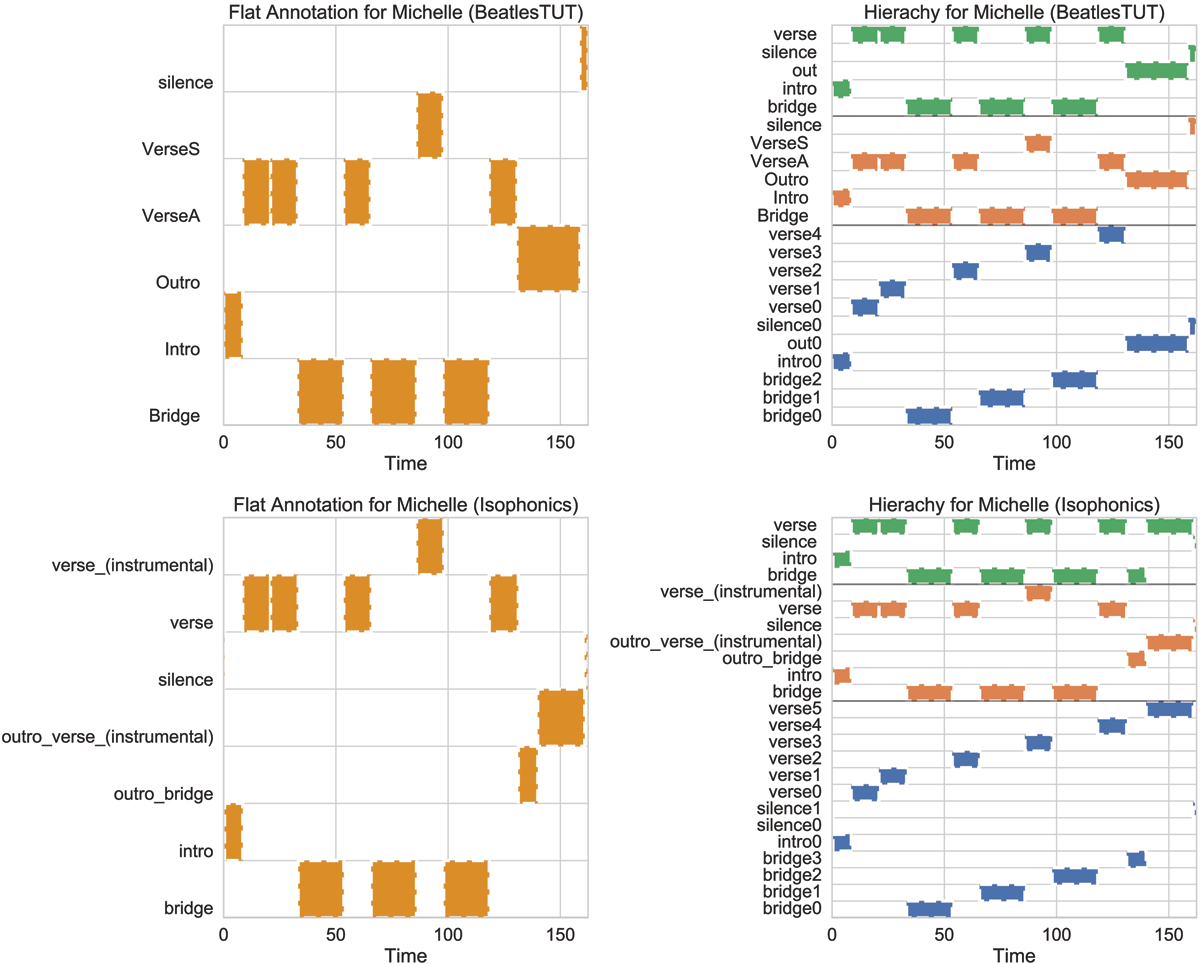
Figure 5
Extreme example “Michelle” where hierarchy expansion decreases by –0.118 the L-measure from flat annotations. Top left: Flat annotation in Beatles-TUT; Top right: Automatic hierarchy expansion for Beatles-TUT annotation; Bottom left: Flat annotation in Isophonics; Bottom right: Automatic hierarchy expansion for Isophonics annotation.

Figure 6
Basic chord metrics (roots, thirds, triads, sevenths, tetrads) are compared to hierarchy expansion metrics on the collection of 1217 songs. The solid line (and shaded region) indicates the linear regression between each combination of metrics (and 95% confidence interval).
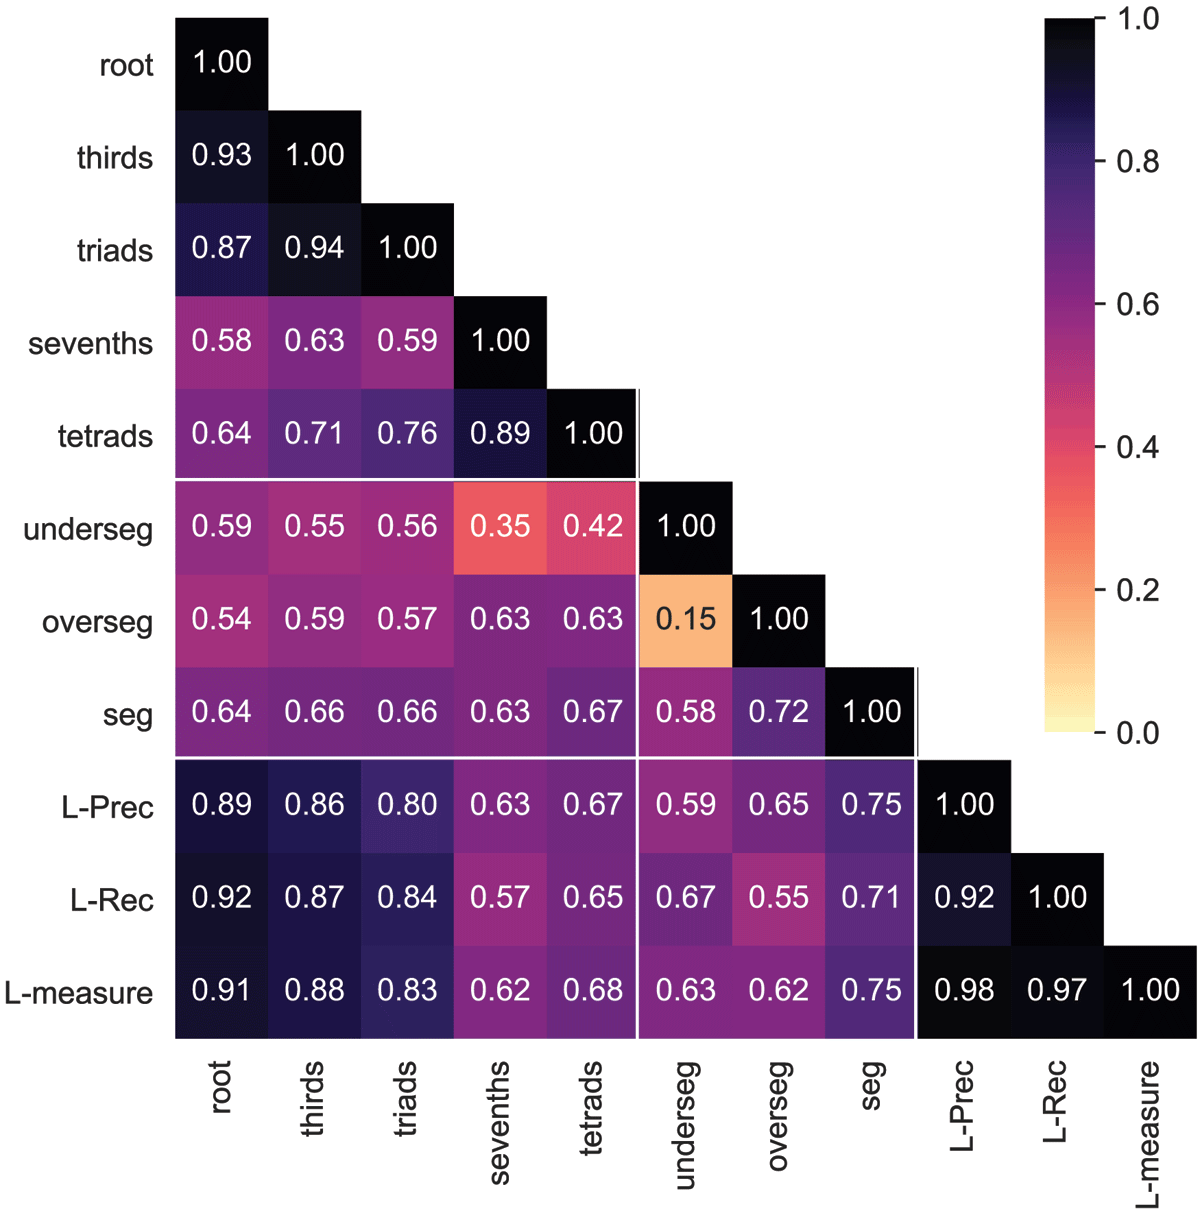
Figure 7
The Spearman correlation between each pair of chord metrics on the 1217 dataset. In addition to the basic metrics (roots, thirds, triads, sevenths, tetrads), we include the directional Hamming distance metrics (underseg, overseg, and seg).
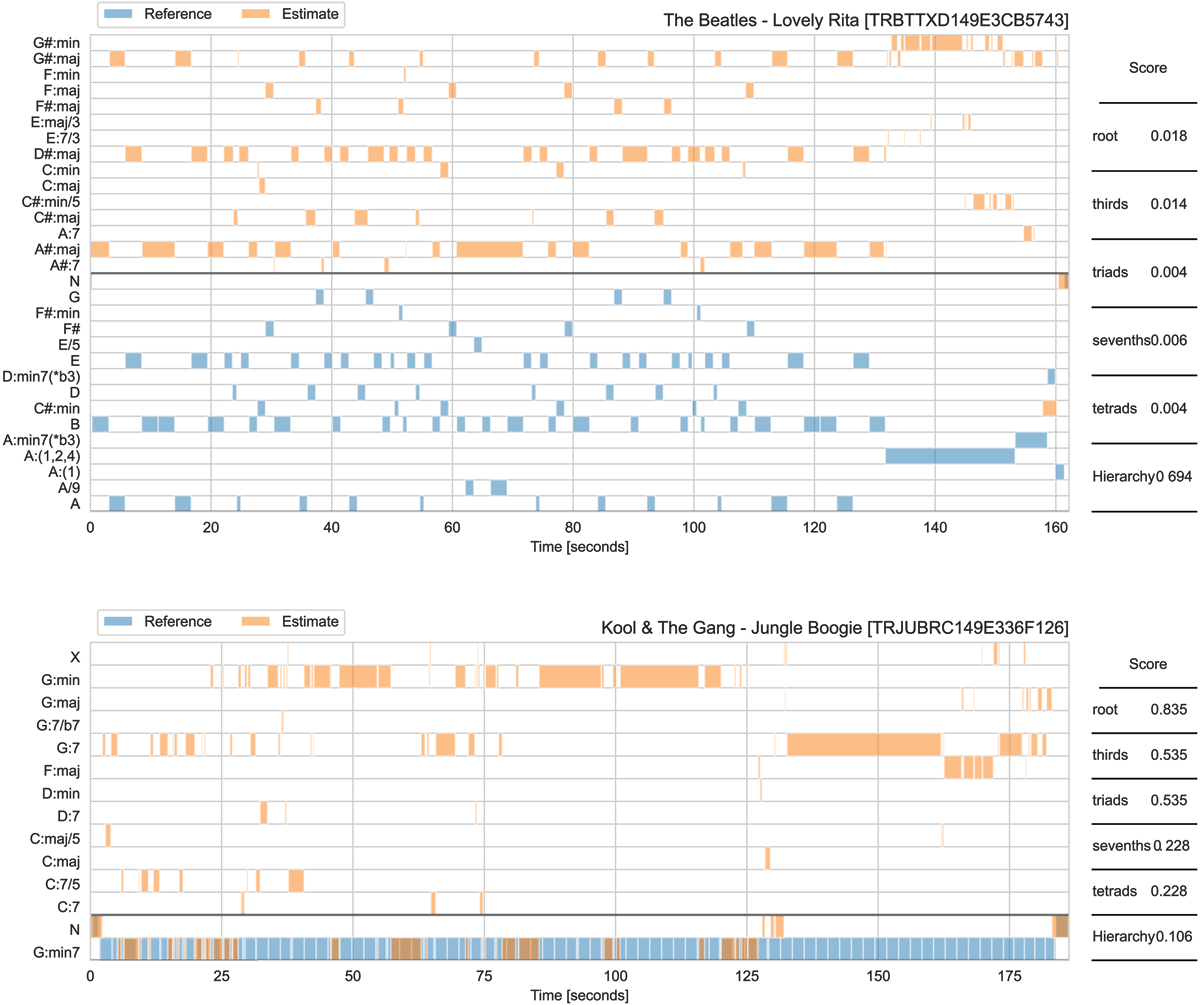
Figure 8
Examples of extreme disagreements between roots and hierarchy measures. Top: a high expanded L-measure, but a low roots score due to disagreement in tuning. Bottom: a high roots score, but a low hierarchy score due to large structural discrepancies.
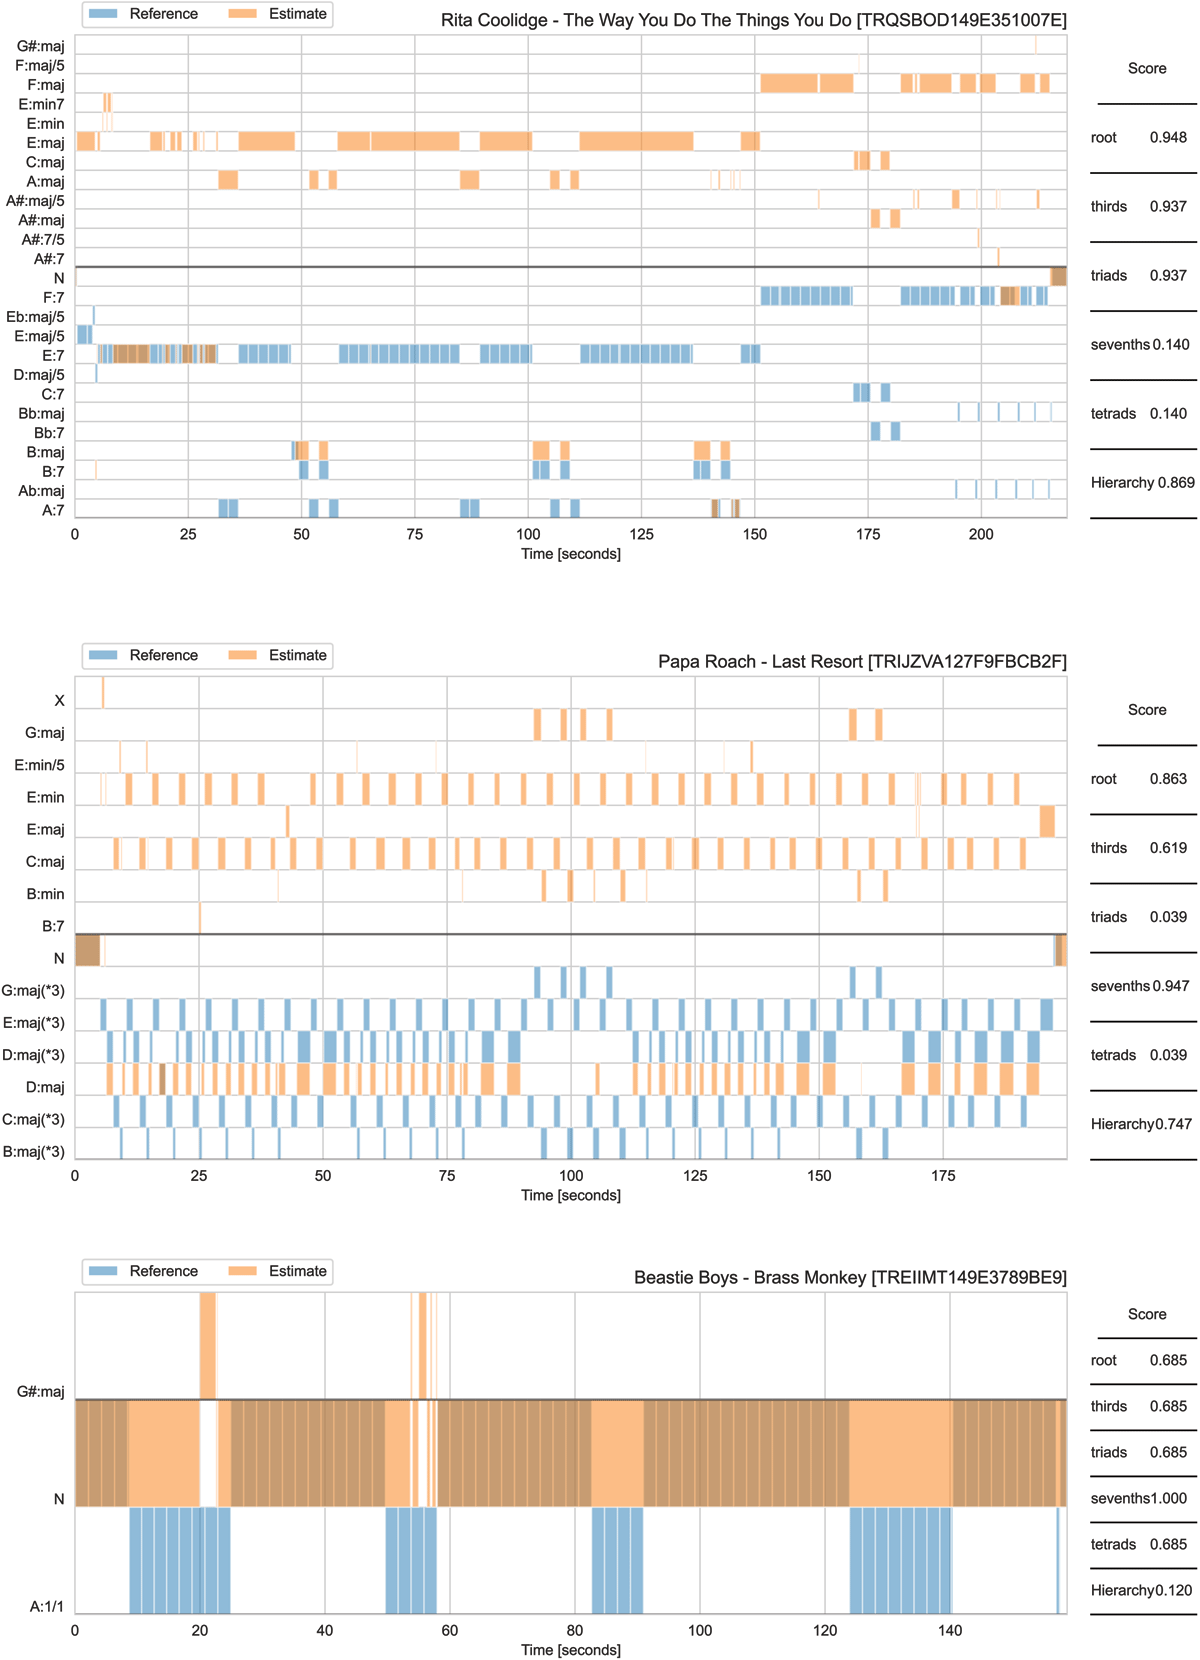
Figure 9
Examples of extreme disagreements between tetrads and hierarchy measures. Top and middle: high L-measure but a low tetrads score. Bottom: high tetrads score, but low L-measure.