
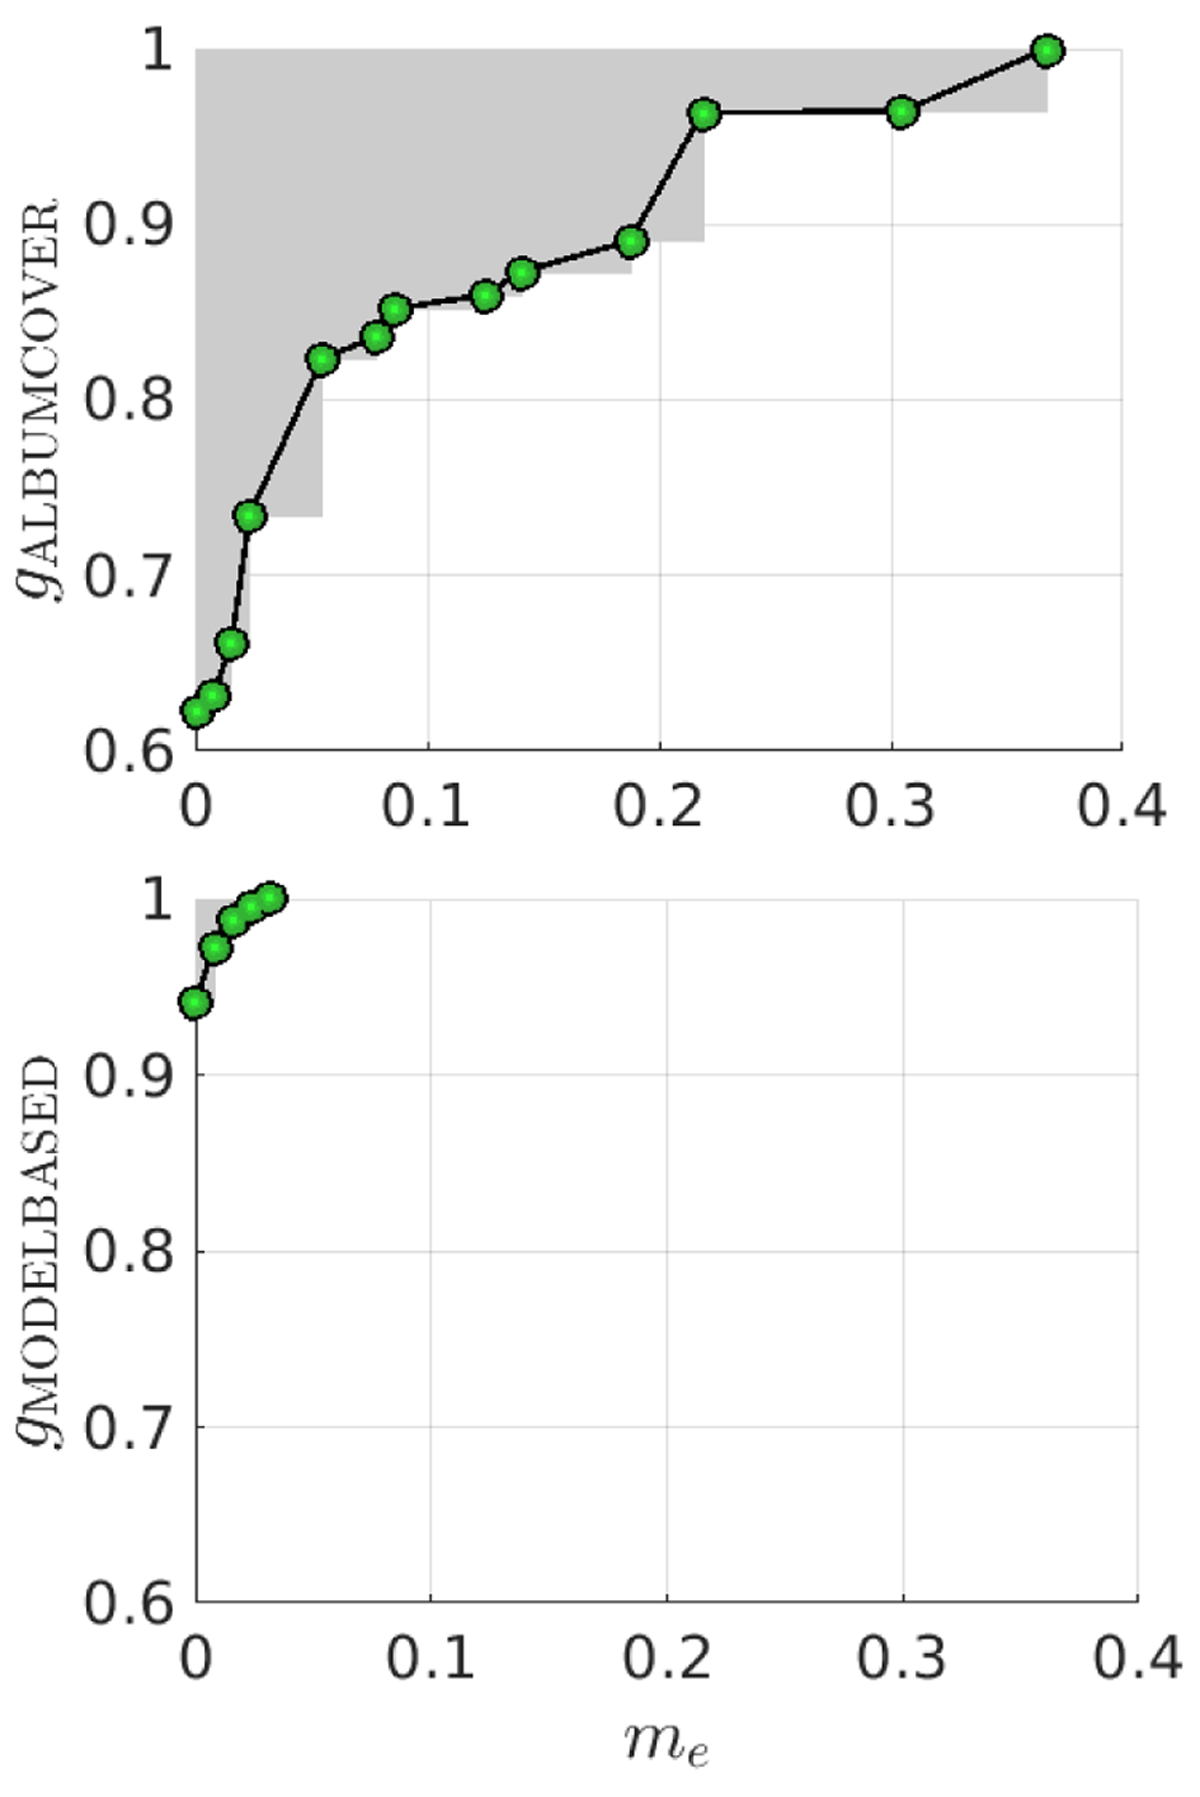
Figure 1
Examples of non-dominated feature sets (connected circles) after feature selection in an experiment on Rock music (see Section 5) using two criteria: the first is binary classification error me, which is minimized, and the second is the proportion gk of the features from the k-th group, which is maximized. The share of album cover features is maximized in the upper sub-figure, and the share of model-predicted semantic tags is maximized in the lower sub-figure.

Figure 2
Theoretically possible non-dominated fronts for the minimization of me and maximization of gk.
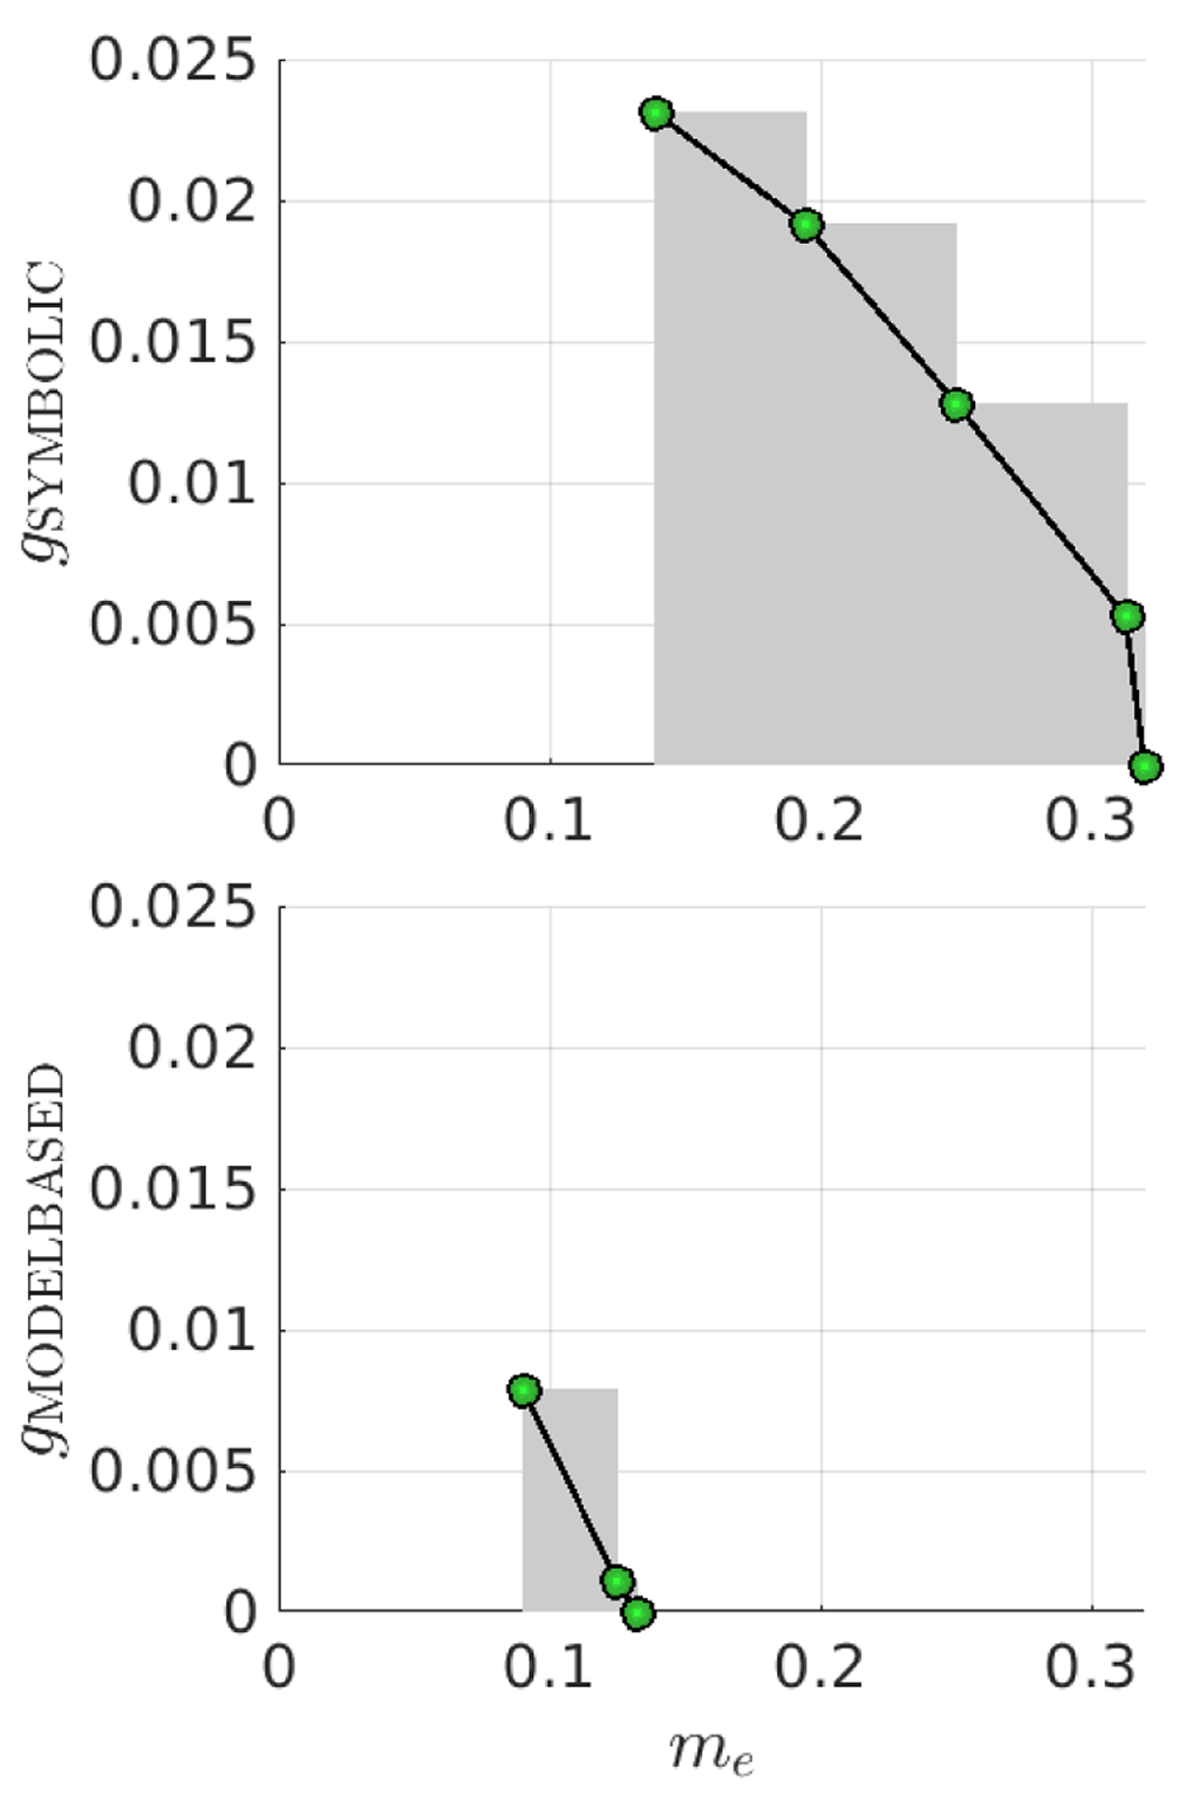
Figure 3
Binary classification performance of symbolic (top) and model-based (bottom) features on Traditional Blues music (see Section 5), based on minimization of both me and gk.
Table 1
Summary of feature groups associated with each of the six modalities. The complete list of features is provided in the supplementary material, Sections A.1 to A.6.
| Group | Sub-Groups | Sample Features | Dim. |
|---|---|---|---|
| Audio signal | Timbre, pitch + harmony, tempo + rhythm + structure, structural complexity | MFCCs and delta MFCCs (Lartillot and Toiviainen, 2007), CMRARE modulation features (Martin and Nagathil, 2009), chroma DCT-reduced log pitch (Müller and Ewert, 2011), structural complexity (Mauch and Levy, 2011) for chroma, chords, harmony, tempo/rhythm, timbre | 908 |
| Model-based | Instruments, instrumental complexity, moods, various semantic descriptors | Share of guitar, piano, wind, and strings, semantic descriptors annotated by music experts: orchestra occurence, clear or rough vocals, melodic range, dynamics, digital effects, level of activation | 494 |
| Symbolic | Pitch, melodic, chords, rhythm, tempo, instrument presence, instruments, texture, dynamics | Pitch class histogram, amount of arpeggiation, tempo, number of instruments, dynamic range and variation | 789 |
| Album covers | – | SIFT descriptors (Lowe, 2004) | 100 |
| Playlists | – | Co-occurrences of artists (Vatolkin et al., 2014) | 293 |
| Lyrics | – | Average number of syllables per word, rate of misspelling, vocabulary size, bag-of-words, Doc2Vec | 87/219 |
Table 2
Fold assignments in cross-validation splits.
| Split | Training | Validation | Test |
|---|---|---|---|
| 1 | Fold 1 | Fold 2 | Fold 3 |
| 2 | Fold 2 | Fold 3 | Fold 1 |
| 3 | Fold 3 | Fold 1 | Fold 2 |
Table 3
Numbers of positive and negative tracks in the training, validation, and test sets for a split.
| Tracks | Training | Validation | Test |
|---|---|---|---|
| LMD-aligned genres | |||
| Positives | 105 | 105 | 105 |
| Negatives | 104 | 420 | 420 |
| SLAC genres | |||
| Positives | 16 | 16 | 16 |
| Negatives | 16 | 64 | 64 |
| SLAC sub-genres | |||
| Positives | 8 | 8 | 8 |
| Negatives | 16 | 72 | 72 |
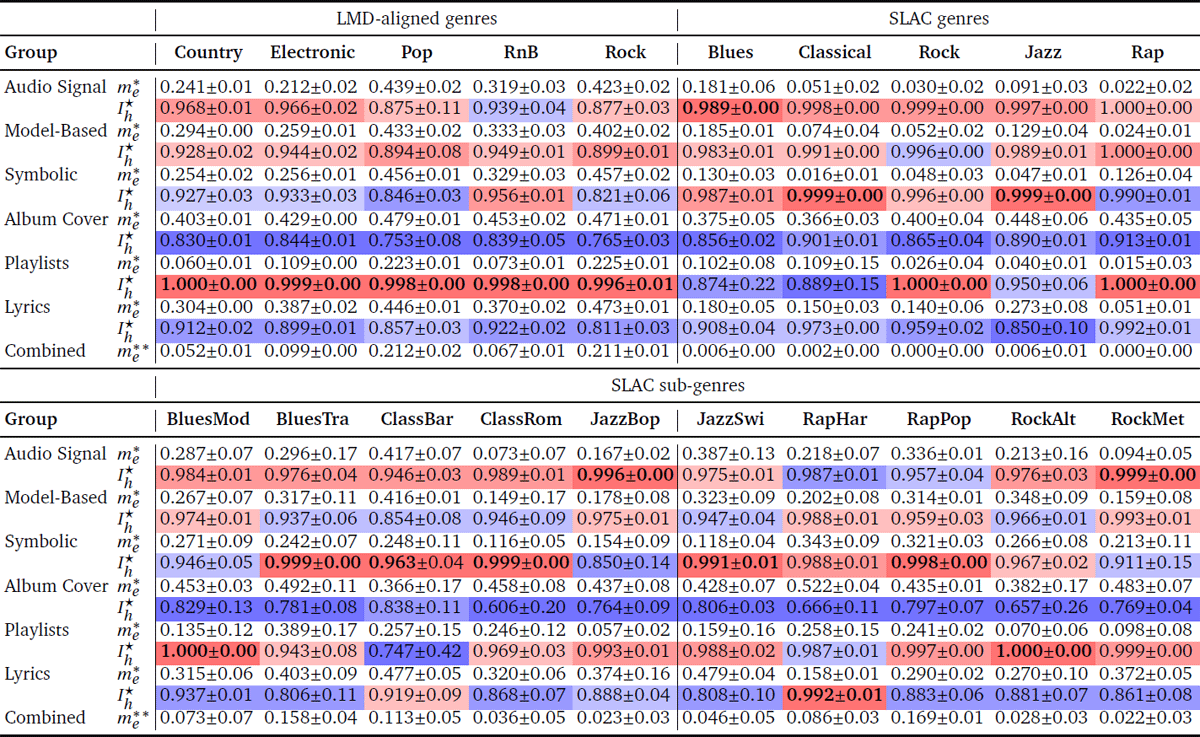
Table 4
Comparison of the six feature types based on h (me ↓, gk ↑) FS optimization. Mean and standard deviations are estimated for the three folds in the splits in which they respectively played a test role (see Section 5.8), and across all ten repetitions of each experiment. All rows but the two starting with “Combined” indicate mean best test classification errors for pure feature groups only (lower values are better) and mean normalized multi-group feature importance (higher values are better). values are averaged across the ten repetitions, and each value specifies the highest-importance non-dominated solution among all ten experimental trials. The mean best and for each class is in bold, and cell background color indicates sorted mean values: deep red indicates highest importance and deep blue corresponds to lowest importance for a given column and its folds. Finally, the values in the rows starting with “Combined” indicate the smallest mean test error obtained across all non-dominated solutions for each class, including (in this row only) mixed feature sets. The following procedure was used to estimate : first, the smallest error from all non-dominated solutions for each individual experimental run is noted, this is then averaged across the ten experimental trials, and the minimum is taken across all six feature groups.
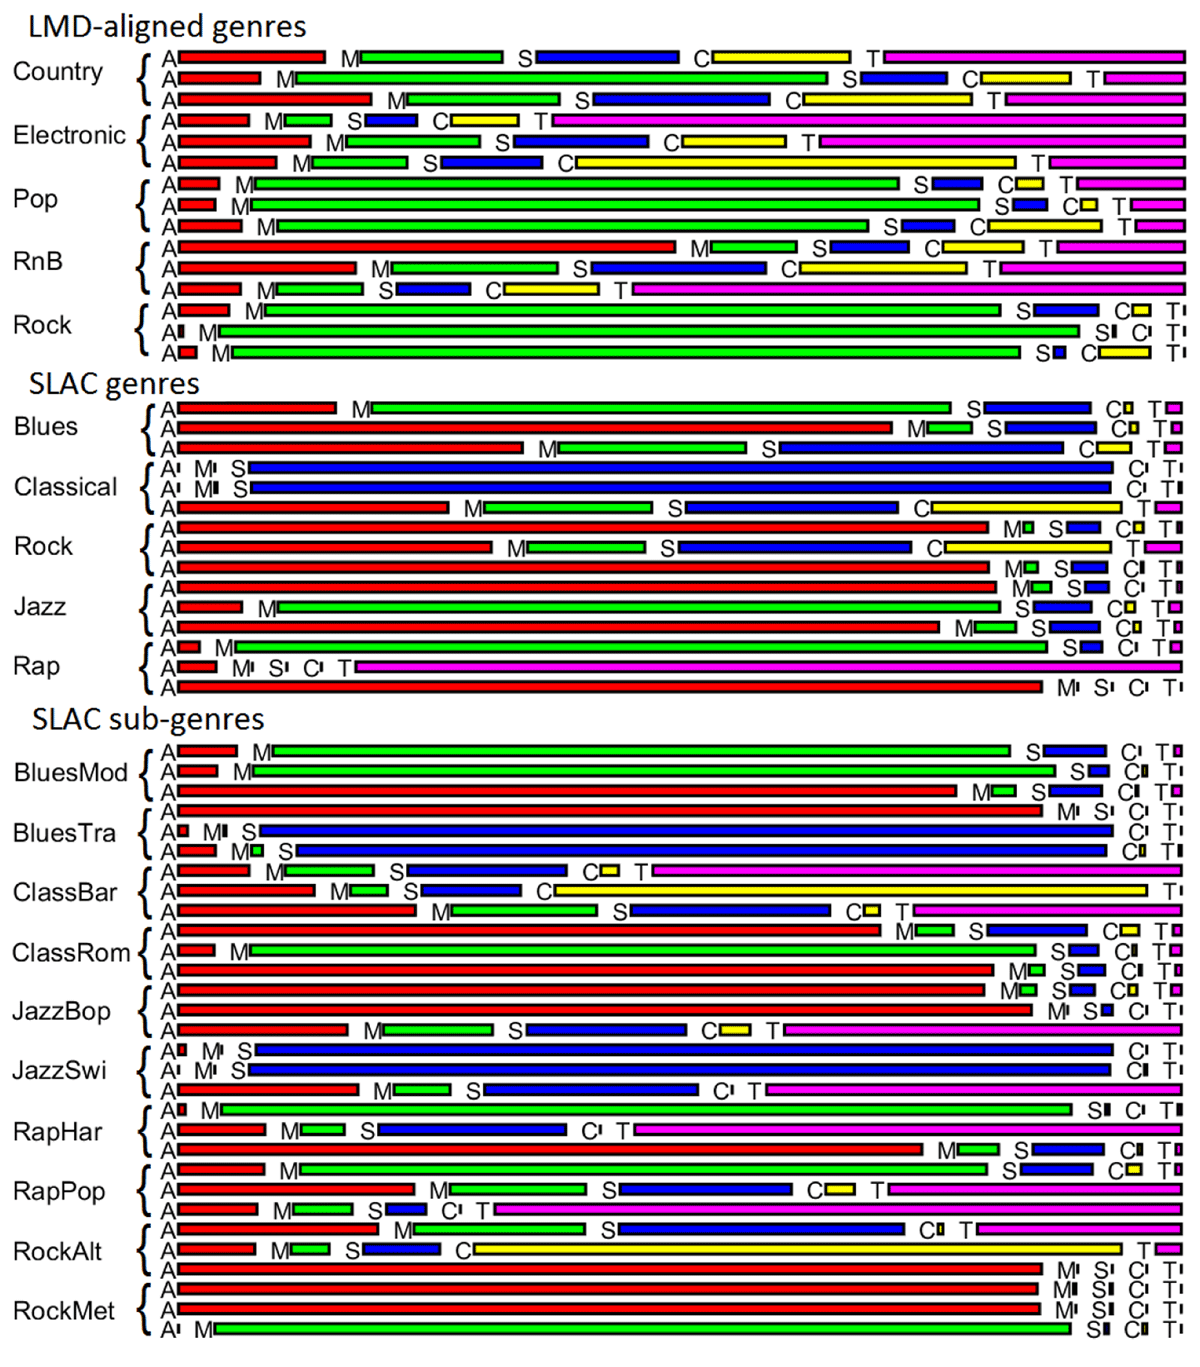
Figure 4
Share of each non-playlist feature group in the feature subsets with the smallest test errors for each genre. A: audio; M: model-predicted tag; S: symbolic; C: album cover; T: lyrics. Results are based on h(me ↓, gk ↑) FS optimization, and are shown for each of the three folds separately, for the splits in which they played a test role.
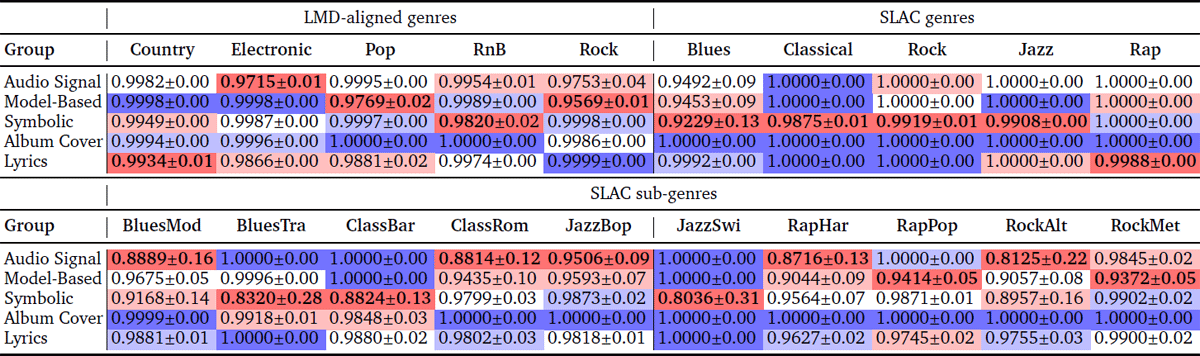
Table 5
Normalized multi-group feature redundancy (Rh⋆) comparison of the five feature types left after excluding playlist features (lower values are better). The mean and standard deviation are shown across three folds. The best value for each class is in bold. Deep red indicates the best mean Rh⋆ and deep blue the worst (equal values are possible).
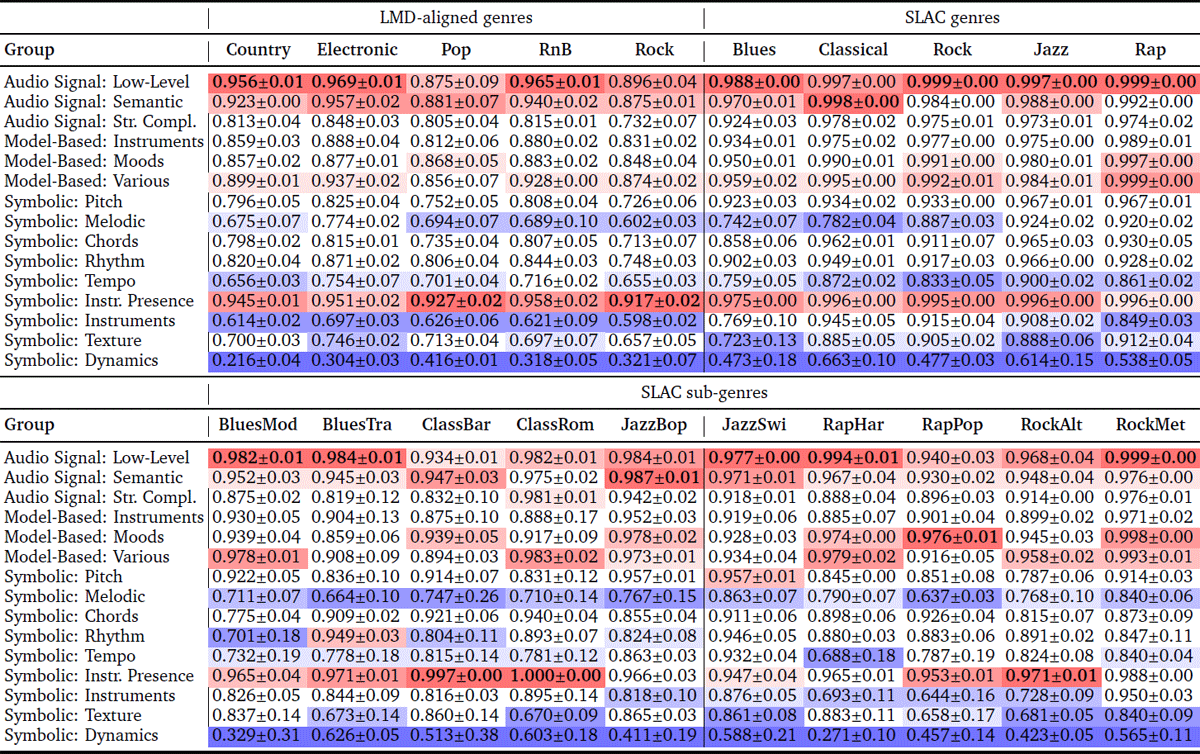
Table 6
Comparison of 15 feature sub-groups from the modalities Audio Signal, Model-Based, and Symbolic with respect to normalized multi-group importance , after h(me ↓, gk ↑) FS optimization. Higher values are better. Mean values and standard deviations across the three folds are reported. The highest mean value for each genre is in bold; cells with higher values are marked in red, and cells with lower values in blue.