
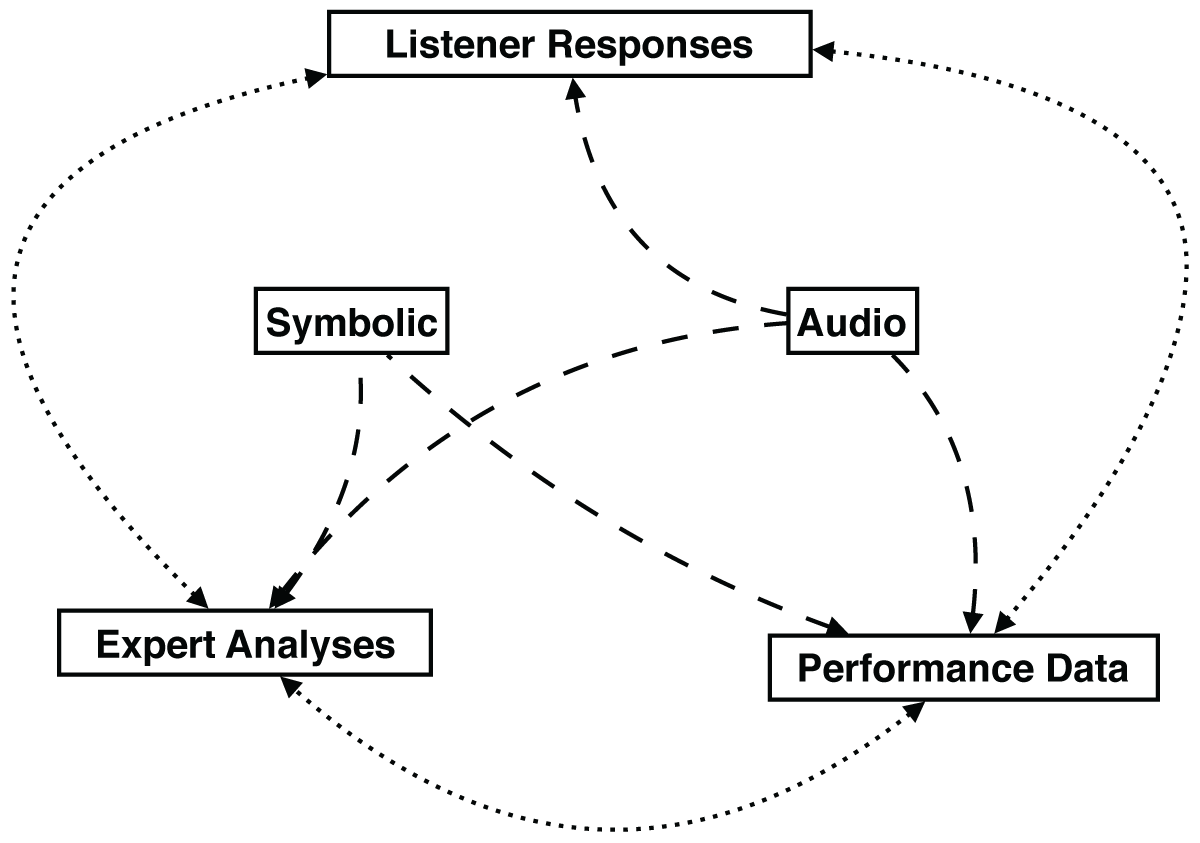
Figure 1
The dashed lines map the possible ways listener responses, expert analyses, and performance data relate to symbolic and audio representations of music. The dotted lines make explicit the potential linkages between symbolic and/or audio data and listener responses, expert analyses, and performance data.

Figure 2
Example encodings from five chord-only datasets: (a) Kostka-Payne (Temperley, 2009), (b) Real World Computing [RWC] Functional Harmony (Kaneko et al., 2010), (c) iRealB Corpus of Jazz Standards (Broze and Shanahan, 2013), (d) Beatles (Harte et al., 2005), and (e) the McGill Billboard Dataset (Burgoyne et al., 2011).
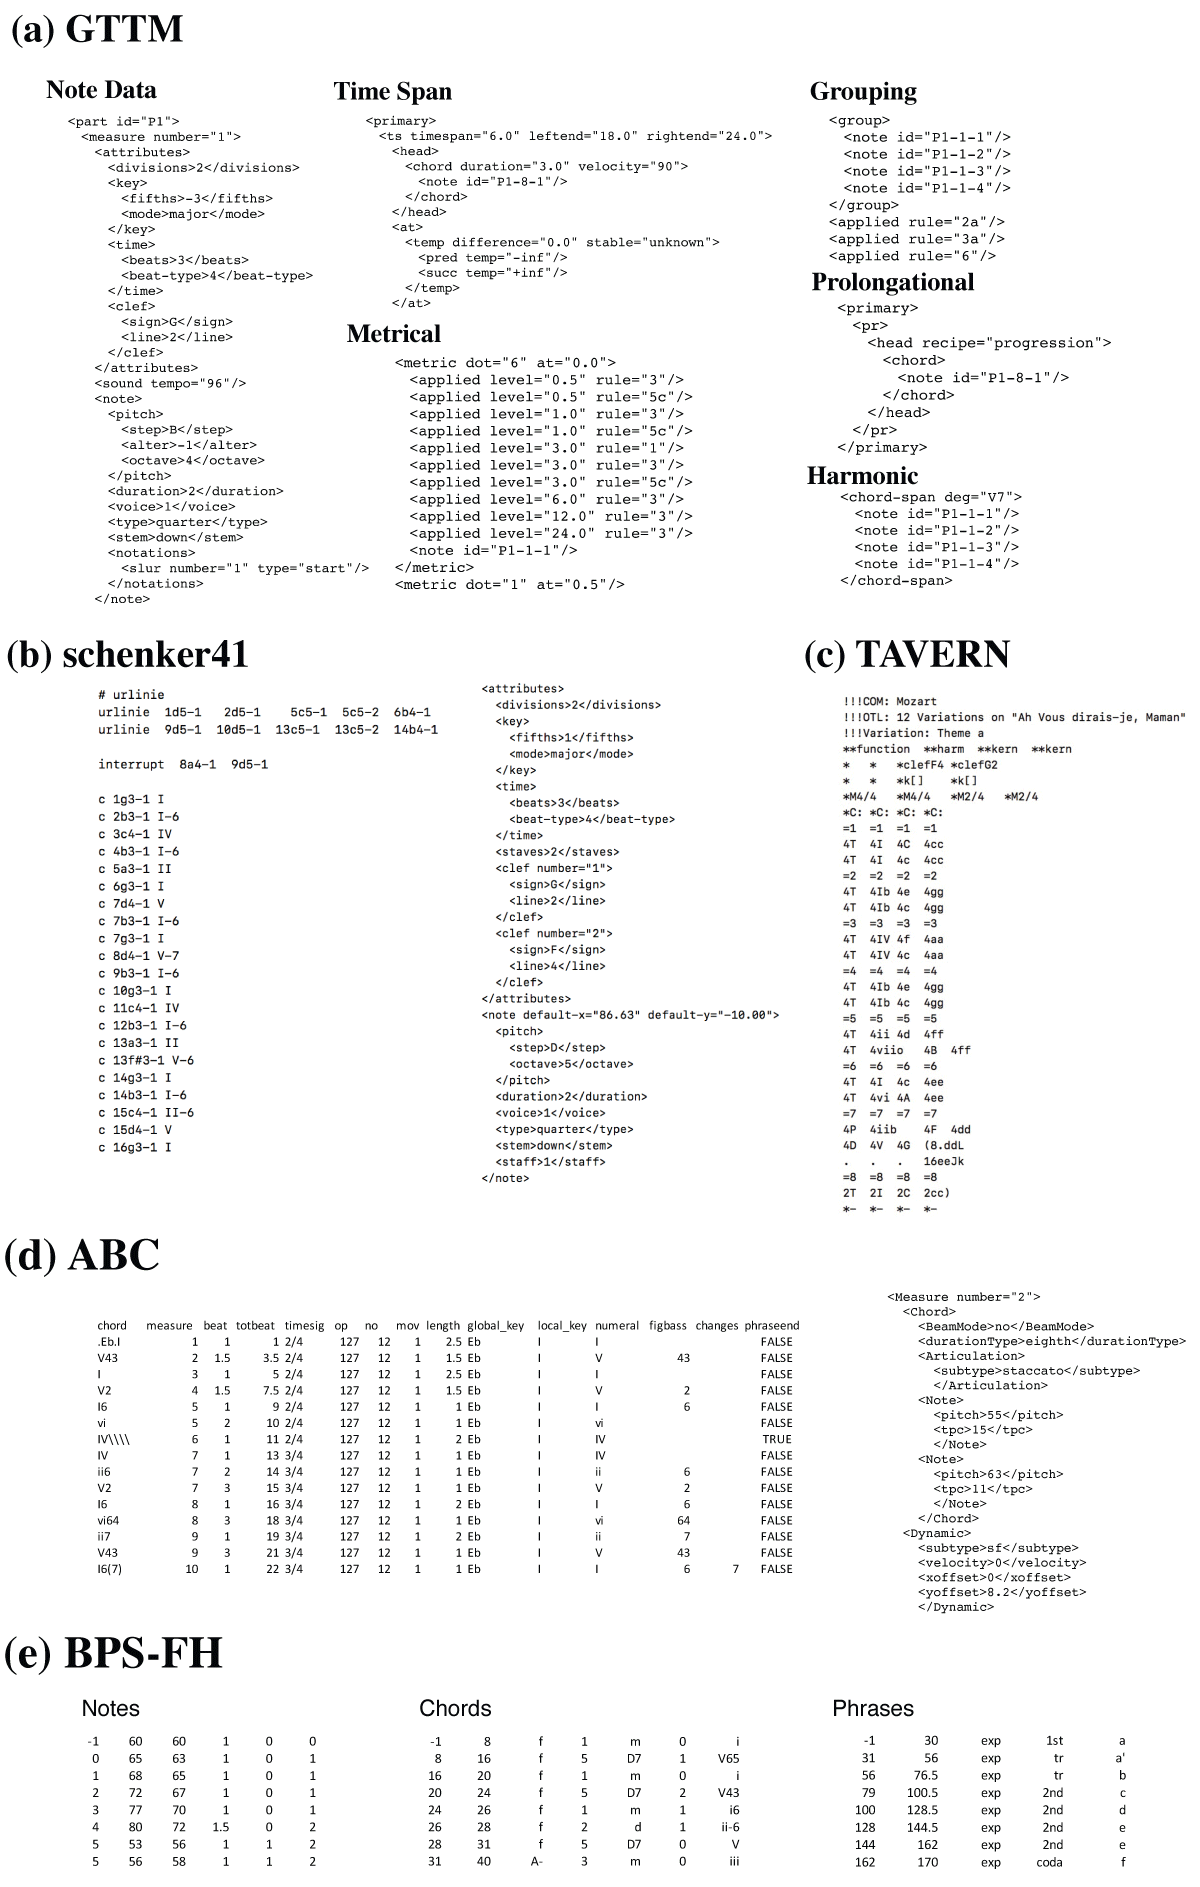
Figure 3
Example encodings from five note-level harmonic analysis datasets: (a) Generative Theory of Tonal Music [GTTM] (Hamanaka et al., 2014), (b) schenker41 (Kirlin, 2014), (c) Theme And Variations Encodings with Roman Numerals [TAVERN] (Devaney et al., 2015), (d) Annotated Beethoven Corpus [ABC] (Neuwirth et al., 2018), and (e) Beethoven Piano Sonatas with Functional Harmony [BPS-FH] (Chen and Su, 2018).
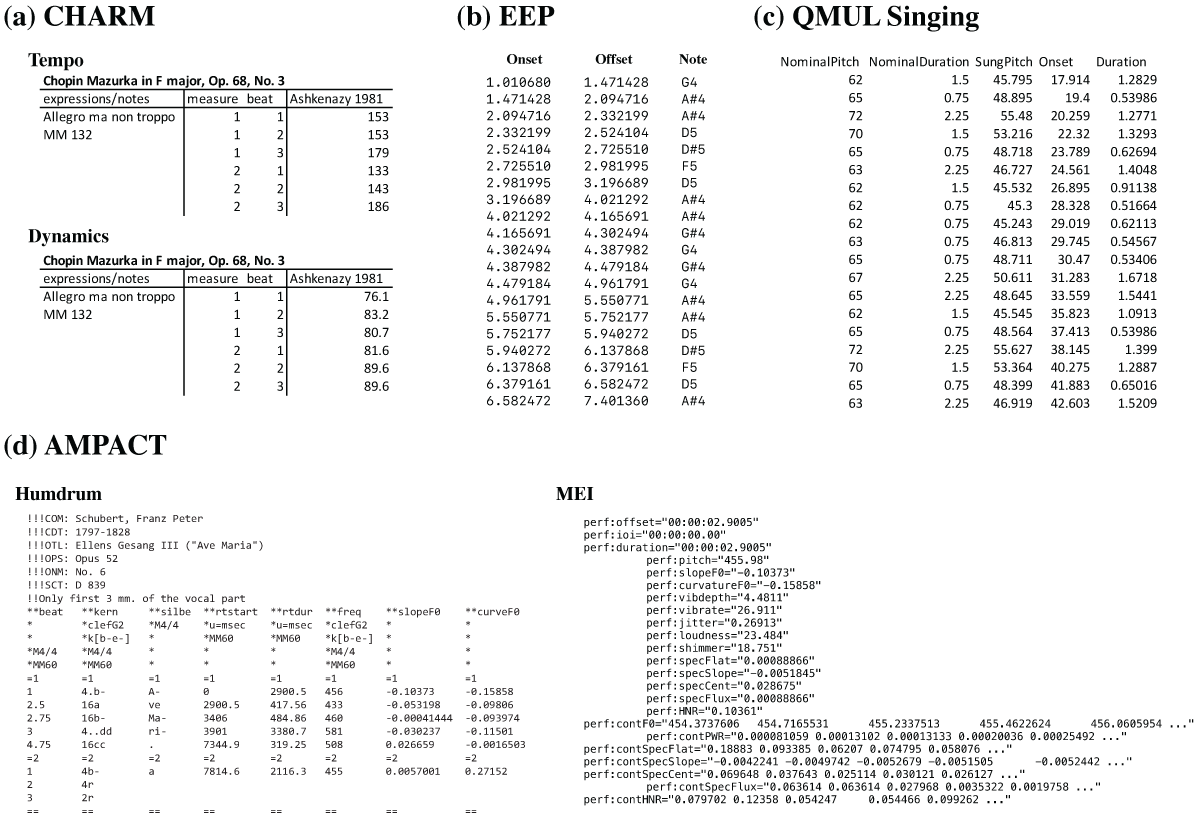
Figure 4
The upper row of the figure shows example encodings of performance at the beat-level from the (a) CHARM Mazurka dataset (Sapp, 2007) and at the note-level from the (b) Ensemble Expressive Performance [EEP] (Marchini et al., 2014) and (c) Queen Mary University of London [QMUL] Singing (Dai et al., 2015) datasets. The lower row shows example encodings from the performance data extensions to Humdrum (left) and MEI (right) in the (d) Automatic Music Performance Analysis and Comparison Toolkit [AMPACT] (Devaney and Gauvin, 2019).
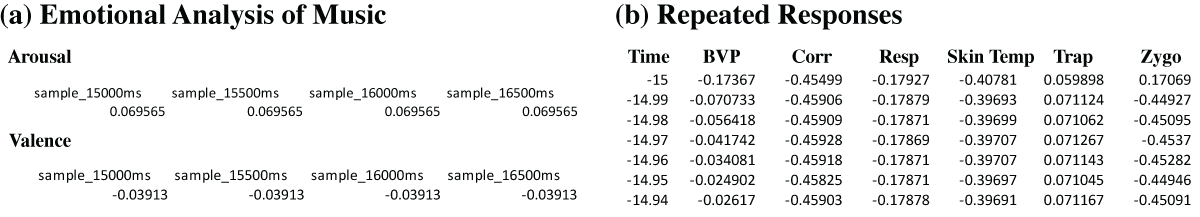
Figure 5
The left side of the figure (a) shows an example encoding of arousal and valence listener response data from Aljanaki et al. (2017) and the right side of the figure (b) shows an example encoding of physiological responses from Upham (2018).