
Table 1
Statistics of the dataset utilized (LE = listening event).
| Item | Value |
|---|---|
| Listening events | 394,944,868 |
| Users | 55,149 |
| Distinct tracks | 3,478,399 |
| Min. LE per user | 1 |
| Q1 LE per user | 1,442 |
| Median LE per user | 5,667 |
| Q3 LE per user | 9,738 |
| Max. LE per user | 399,210 |
| Avg. LE per User | 7,161.41 (±10,326.91) |
| Avg. Users per Country | 1,155.93 (±1,894.96) |
Table 2
Number of users per country for countries with more than 200 users. We use ISO 3166 2-digit country codes to abbreviate country names.
| Abbrv. | Country | Users |
|---|---|---|
| US | United States | 10,251 |
| RU | Russian Federation | 5,021 |
| DE | Germany | 4,576 |
| UK | United Kingdom | 4,533 |
| PL | Poland | 4,403 |
| BR | Brazil | 3,882 |
| FI | Finland | 1,409 |
| NL | Netherlands | 1,375 |
| ES | Spain | 1,242 |
| SE | Sweden | 1,230 |
| UA | Ukraine | 1,140 |
| CA | Canada | 1,077 |
| FR | France | 1,055 |
| AU | Australia | 976 |
| IT | Italy | 973 |
| JP | Japan | 798 |
| NO | Norway | 750 |
| MX | Mexico | 705 |
| CZ | Czechia | 632 |
| BY | Belarus | 558 |
| BE | Belgium | 513 |
| ID | Indonesia | 484 |
| TR | Turkey | 478 |
| CL | Chile | 425 |
| HR | Croatia | 372 |
| PT | Portugal | 291 |
| AR | Argentina | 282 |
| CH | Switzerland | 277 |
| AT | Austria | 276 |
| HU | Hungary | 272 |
| DK | Denmark | 271 |
| RS | Serbia | 253 |
| RO | Romania | 237 |
| BG | Bulgaria | 236 |
| IE | Ireland | 219 |
| LT | Lithuania | 202 |
Table 3
Overview of evaluated models, where features prefixed with U describe a user and features prefixed with T describe a track; the models on two last rows serve as baselines.
| Model | User Features | Track Features |
|---|---|---|
| Music + Culture | U_ID, U_AF, U_WHR, U_HOF | T_ID, T_AF, T_WHR, T_HOF |
| Music | U_ID, U_AF | T_ID, T_AF |
| Culture | U_ID, U_WHR, U_HOF | T_ID, T_HOF, T_WHR |
| Country | U_ID, U_Country_ID | T_ID, T_Country_ID |
| User + Track | U_ID | T_ID |
Table 4
Precision, recall, and F1-score for all proposed models (sorted by performance; standard deviation in parentheses).
| Model | Prec | Rec | F1 |
|---|---|---|---|
| Music + Culture | 0.98 (±0.04) | 0.63 (±0.15) | 0.75 (±0.10) |
| Music | 0.95 (±0.06) | 0.59 (±0.15) | 0.72 (±0.11) |
| Country | 0.83 (±0.11) | 0.52 (±0.12) | 0.63 (±0.10) |
| Culture | 0.31 (±0.15) | 0.18 (±0.08) | 0.24 (±0.09) |
| User + Track | 0.13 (±0.10) | 0.08 (±0.06) | 0.13 (±0.06) |
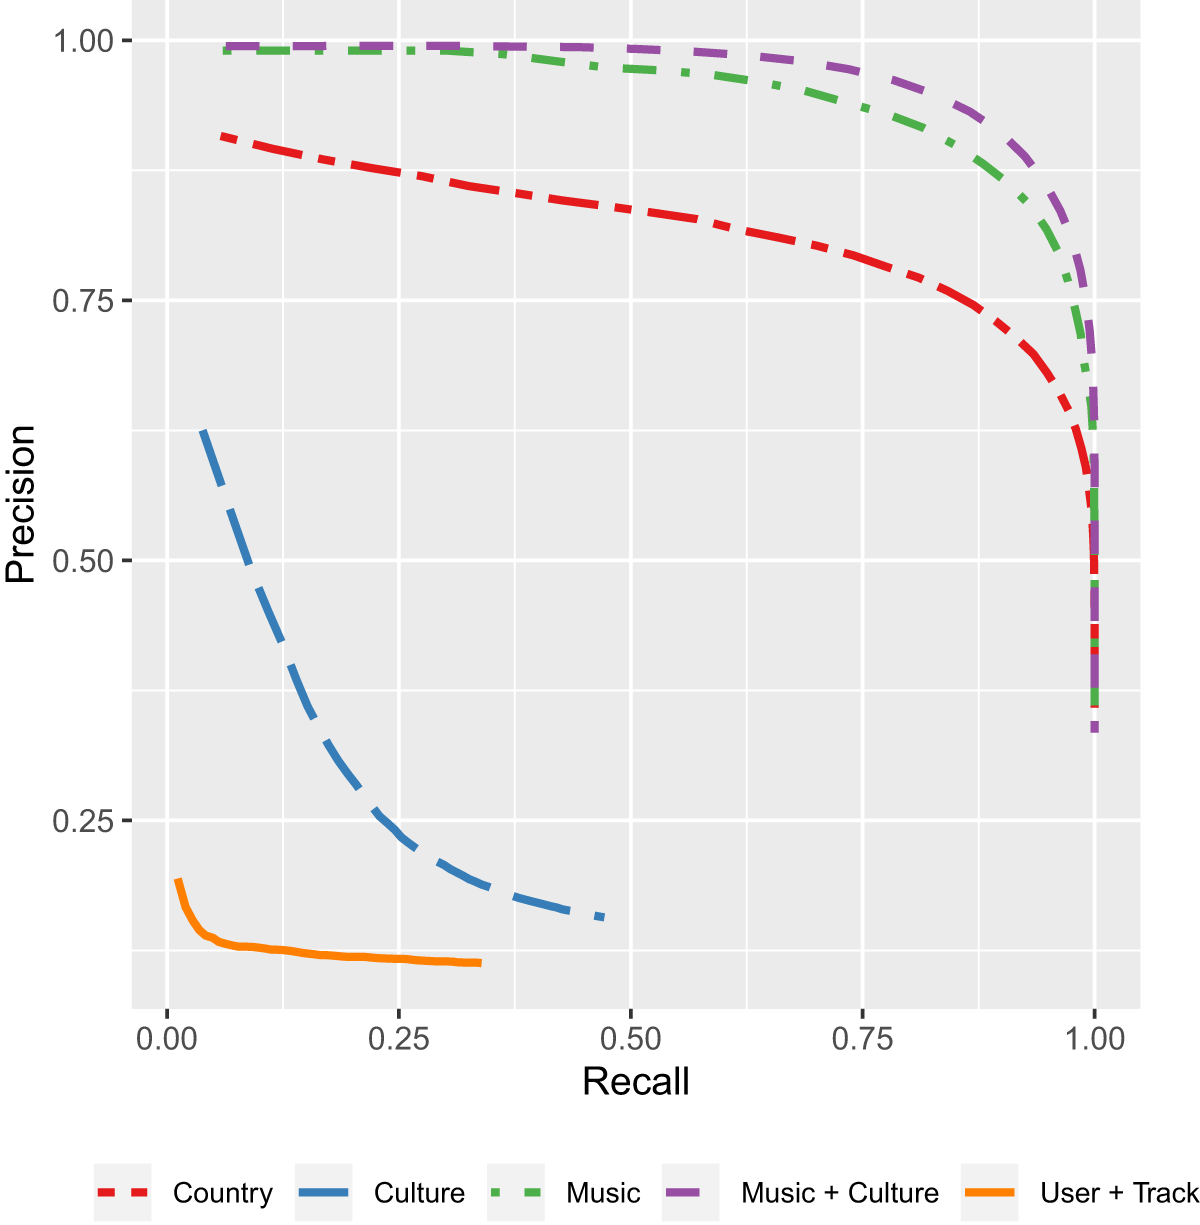
Figure 1
Precision-recall-curves for top-n = 1…50 recommendations for all models.
Table 5
RMSE and MAE of all models.
| Model | RMSE | MAE |
|---|---|---|
| Music + Culture | 0.15 | 0.02 |
| Music | 0.17 | 0.03 |
| Country | 0.36 | 0.13 |
| Culture | 0.88 | 0.77 |
| User + Track | 0.93 | 0.85 |
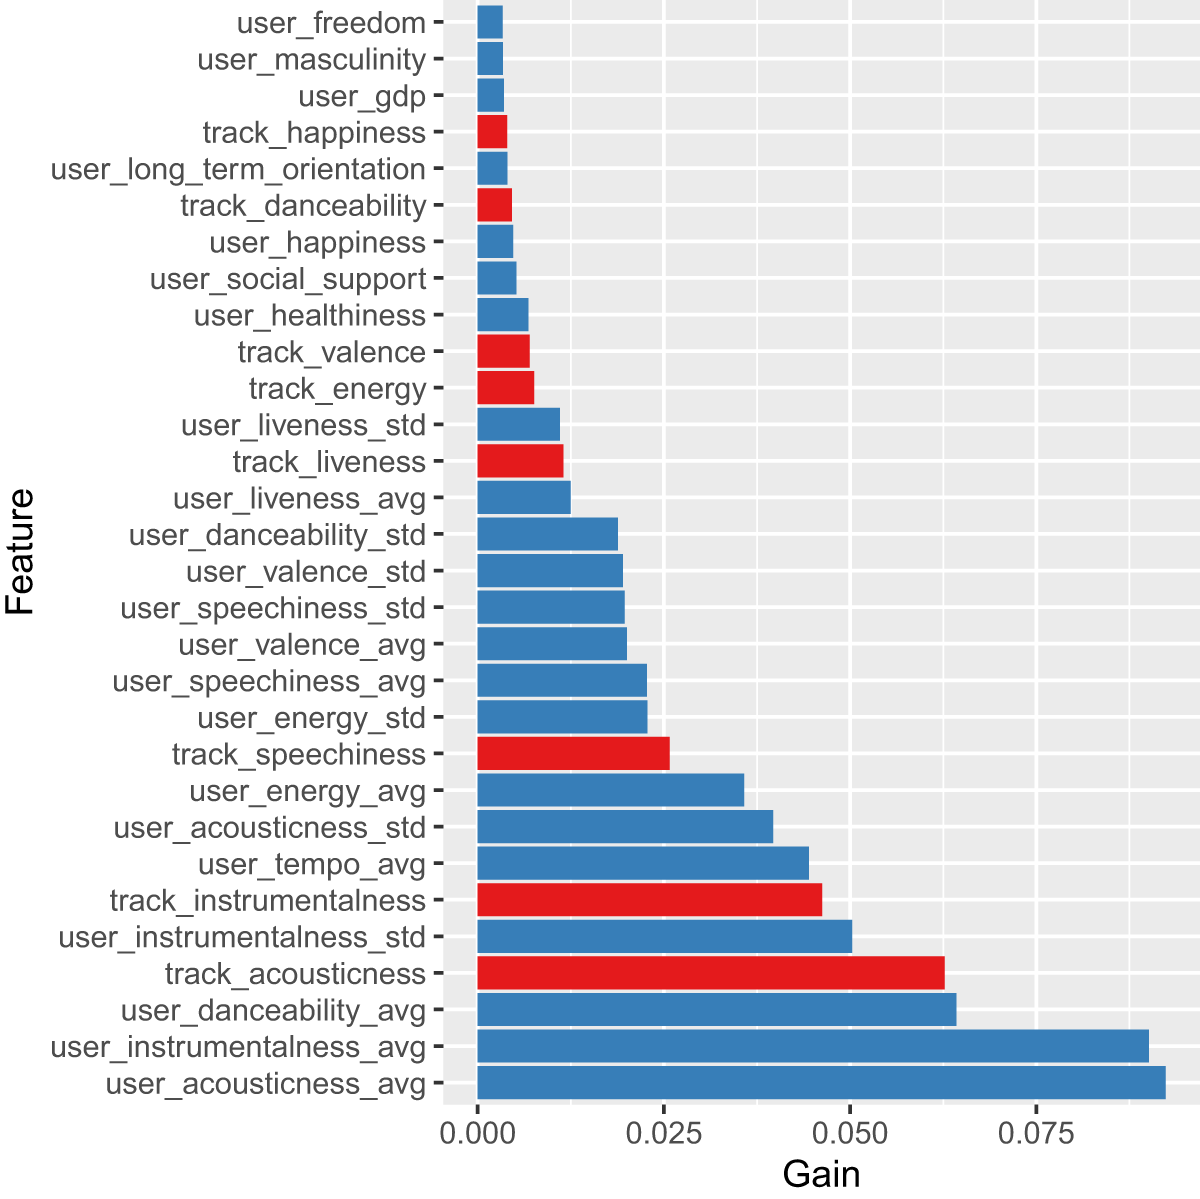
Figure 2
Information gain of the top 30 individual user and track features of the Music + Culture model.
Table 6
Means and standard deviations (in parentheses) of acoustic preferences of each country’s users. The highest value of each acoustic property is printed in bold; the lowest in italic. Countries are sorted alphabetically according to their country code.
| Country | Danceability | Energy | Speechiness | Acousticness | Instrumentalness | Liveness | Valence | Tempo |
|---|---|---|---|---|---|---|---|---|
| AR | 0.512 (0.091) | 0.739 (0.140) | 0.048 (0.017) | 0.113 (0.163) | 0.059 (0.166) | 0.145 (0.034) | 0.482 (0.122) | 123.113 (7.756) |
| AT | 0.476 (0.102) | 0.766 (0.172) | 0.059 (0.025) | 0.106 (0.182) | 0.127 (0.227) | 0.154 (0.042) | 0.405 (0.133) | 124.400 (8.483) |
| AU | 0.491 (0.100) | 0.746 (0.157) | 0.057 (0.028) | 0.112 (0.172) | 0.119 (0.228) | 0.153 (0.043) | 0.435 (0.129) | 123.562 (9.116) |
| BE | 0.507 (0.106) | 0.718 (0.170) | 0.056 (0.029) | 0.143 (0.198) | 0.165 (0.260) | 0.148 (0.045) | 0.428 (0.129) | 122.783 (8.825) |
| BG | 0.491 (0.101) | 0.801 (0.135) | 0.062 (0.029) | 0.063 (0.123) | 0.117 (0.215) | 0.159 (0.044) | 0.418 (0.131) | 124.052 (10.034) |
| BR | 0.509 (0.089) | 0.758 (0.148) | 0.053 (0.024) | 0.114 (0.173) | 0.029 (0.112) | 0.154 (0.054) | 0.478 (0.121) | 124.566 (10.589) |
| CA | 0.495 (0.098) | 0.736 (0.159) | 0.056 (0.028) | 0.126 (0.180) | 0.117 (0.222) | 0.153 (0.048) | 0.441 (0.128) | 123.161 (8.588) |
| CH | 0.518 (0.106) | 0.706 (0.169) | 0.053 (0.025) | 0.161 (0.197) | 0.134 (0.251) | 0.142 (0.037) | 0.442 (0.140) | 122.438 (8.510) |
| CL | 0.495 (0.099) | 0.769 (0.136) | 0.054 (0.022) | 0.091 (0.155) | 0.072 (0.170) | 0.151 (0.041) | 0.455 (0.131) | 124.367 (7.929) |
| CN | 0.502 (0.118) | 0.643 (0.197) | 0.051 (0.041) | 0.232 (0.249) | 0.153 (0.279) | 0.145 (0.074) | 0.393 (0.153) | 121.190 (13.016) |
| CO | 0.532 (0.097) | 0.755 (0.129) | 0.050 (0.017) | 0.099 (0.154) | 0.073 (0.169) | 0.142 (0.036) | 0.486 (0.141) | 123.085 (7.644) |
| CZ | 0.487 (0.097) | 0.769 (0.154) | 0.057 (0.024) | 0.094 (0.166) | 0.139 (0.235) | 0.157 (0.051) | 0.418 (0.137) | 123.901 (8.317) |
| DE | 0.502 (0.110) | 0.776 (0.154) | 0.063 (0.039) | 0.094 (0.166) | 0.114 (0.227) | 0.158 (0.048) | 0.445 (0.138) | 124.570 (9.937) |
| DK | 0.524 (0.099) | 0.701 (0.172) | 0.052 (0.026) | 0.161 (0.203) | 0.107 (0.220) | 0.147 (0.059) | 0.445 (0.125) | 121.128 (8.498) |
| EE | 0.504 (0.095) | 0.755 (0.144) | 0.056 (0.028) | 0.091 (0.151) | 0.147 (0.246) | 0.147 (0.037) | 0.428 (0.124) | 124.531 (10.383) |
| ES | 0.514 (0.101) | 0.733 (0.163) | 0.052 (0.023) | 0.141 (0.196) | 0.085 (0.194) | 0.148 (0.038) | 0.474 (0.136) | 123.432 (8.257) |
| FI | 0.487 (0.103) | 0.806 (0.132) | 0.062 (0.032) | 0.062 (0.131) | 0.122 (0.219) | 0.166 (0.042) | 0.428 (0.136) | 123.707 (8.277) |
| FR | 0.533 (0.113) | 0.704 (0.159) | 0.057 (0.035) | 0.152 (0.193) | 0.152 (0.249) | 0.144 (0.046) | 0.452 (0.145) | 120.900 (9.452) |
| GR | 0.473 (0.091) | 0.709 (0.161) | 0.049 (0.020) | 0.124 (0.193) | 0.198 (0.267) | 0.144 (0.033) | 0.397 (0.127) | 121.519 (8.147) |
| HR | 0.473 (0.101) | 0.752 (0.157) | 0.056 (0.026) | 0.110 (0.165) | 0.158 (0.245) | 0.151 (0.038) | 0.418 (0.132) | 122.991 (8.289) |
| HU | 0.494 (0.116) | 0.800 (0.144) | 0.064 (0.033) | 0.066 (0.140) | 0.189 (0.283) | 0.162 (0.045) | 0.408 (0.146) | 124.793 (10.081) |
| ID | 0.510 (0.089) | 0.716 (0.165) | 0.048 (0.023) | 0.150 (0.195) | 0.040 (0.144) | 0.147 (0.048) | 0.448 (0.126) | 123.762 (12.311) |
| IE | 0.503 (0.092) | 0.696 (0.174) | 0.051 (0.024) | 0.164 (0.211) | 0.120 (0.222) | 0.146 (0.040) | 0.445 (0.125) | 122.503 (8.780) |
| IN | 0.487 (0.104) | 0.704 (0.186) | 0.053 (0.037) | 0.158 (0.234) | 0.143 (0.266) | 0.145 (0.058) | 0.398 (0.134) | 121.598 (11.939) |
| IR | 0.455 (0.101) | 0.599 (0.215) | 0.049 (0.031) | 0.278 (0.265) | 0.181 (0.281) | 0.133 (0.038) | 0.298 (0.137) | 119.224 (12.176) |
| IT | 0.501 (0.090) | 0.705 (0.166) | 0.051 (0.023) | 0.158 (0.199) | 0.085 (0.186) | 0.144 (0.036) | 0.444 (0.130) | 122.752 (8.591) |
| JP | 0.512 (0.102) | 0.729 (0.189) | 0.056 (0.032) | 0.153 (0.220) | 0.156 (0.268) | 0.153 (0.060) | 0.474 (0.159) | 123.181 (13.594) |
| LT | 0.477 (0.105) | 0.750 (0.154) | 0.054 (0.020) | 0.097 (0.165) | 0.182 (0.264) | 0.146 (0.037) | 0.393 (0.124) | 122.687 (8.250) |
| LV | 0.494 (0.099) | 0.730 (0.172) | 0.056 (0.033) | 0.122 (0.192) | 0.158 (0.263) | 0.149 (0.046) | 0.399 (0.125) | 121.961 (12.291) |
| MX | 0.529 (0.091) | 0.757 (0.124) | 0.051 (0.023) | 0.091 (0.145) | 0.079 (0.191) | 0.146 (0.040) | 0.485 (0.130) | 124.044 (8.197) |
| NL | 0.518 (0.100) | 0.705 (0.171) | 0.053 (0.029) | 0.154 (0.202) | 0.115 (0.235) | 0.144 (0.040) | 0.446 (0.130) | 122.553 (9.230) |
| NO | 0.507 (0.101) | 0.710 (0.162) | 0.052 (0.024) | 0.147 (0.193) | 0.117 (0.225) | 0.145 (0.037) | 0.435 (0.130) | 122.500 (8.098) |
| NZ | 0.486 (0.100) | 0.771 (0.144) | 0.059 (0.026) | 0.085 (0.154) | 0.136 (0.252) | 0.158 (0.044) | 0.432 (0.134) | 124.857 (9.177) |
| PL | 0.504 (0.102) | 0.766 (0.145) | 0.065 (0.046) | 0.093 (0.155) | 0.099 (0.208) | 0.154 (0.048) | 0.436 (0.137) | 122.569 (10.738) |
| PT | 0.478 (0.107) | 0.736 (0.178) | 0.056 (0.028) | 0.129 (0.203) | 0.145 (0.241) | 0.150 (0.041) | 0.407 (0.132) | 122.887 (9.709) |
| RO | 0.476 (0.113) | 0.720 (0.166) | 0.053 (0.023) | 0.121 (0.184) | 0.224 (0.285) | 0.142 (0.034) | 0.373 (0.139) | 121.389 (7.864) |
| RS | 0.499 (0.119) | 0.745 (0.154) | 0.059 (0.034) | 0.102 (0.167) | 0.139 (0.240) | 0.151 (0.041) | 0.424 (0.143) | 121.517 (8.257) |
| RU | 0.485 (0.099) | 0.790 (0.146) | 0.061 (0.032) | 0.071 (0.149) | 0.141 (0.247) | 0.161 (0.049) | 0.415 (0.136) | 124.464 (10.373) |
| SE | 0.512 (0.096) | 0.725 (0.159) | 0.053 (0.028) | 0.138 (0.185) | 0.115 (0.227) | 0.147 (0.036) | 0.454 (0.123) | 123.027 (7.834) |
| SK | 0.479 (0.103) | 0.755 (0.172) | 0.064 (0.040) | 0.109 (0.178) | 0.184 (0.263) | 0.156 (0.040) | 0.381 (0.136) | 122.172 (9.100) |
| TR | 0.498 (0.095) | 0.669 (0.184) | 0.049 (0.023) | 0.199 (0.228) | 0.128 (0.238) | 0.137 (0.040) | 0.398 (0.125) | 119.935 (9.252) |
| UK | 0.512 (0.096) | 0.723 (0.163) | 0.054 (0.027) | 0.134 (0.192) | 0.110 (0.227) | 0.148 (0.041) | 0.465 (0.128) | 123.424 (9.642) |
| US | 0.507 (0.100) | 0.721 (0.163) | 0.057 (0.044) | 0.140 (0.194) | 0.108 (0.221) | 0.150 (0.049) | 0.461 (0.130) | 122.624 (9.813) |
| VE | 0.515 (0.101) | 0.777 (0.113) | 0.054 (0.022) | 0.070 (0.120) | 0.082 (0.198) | 0.151 (0.042) | 0.476 (0.152) | 124.961 (10.287) |
Table 7
Spearman rank-order correlations between users’ acoustic properties of listening behavior and cultural features (Hofstede). Correlations >0.1 are highlighted in bold face. Statistically significant correlations at p < 0.001 are marked with an asterisk (*).
| PD | IDV | MAS | UA | LTO | IND | |
| Danceability | –0.035* | 0.044* | 0.023* | –0.052* | –0.024* | 0.072* |
| Energy | 0.056* | –0.102* | –0.014 | 0.116* | 0.076* | –0.115* |
| Speechiness | 0.022* | –0.034* | 0.016* | 0.085* | 0.065* | –0.096* |
| Acousticness | –0.056* | 0.105* | 0.026* | –0.122* | –0.086* | 0.125* |
| Instrumentalness | –0.012 | 0.011 | –0.029* | 0.038* | 0.055* | –0.055* |
| Liveness | 0.021* | –0.042* | –0.014 | 0.059* | 0.035* | –0.065* |
| Valence | –0.042* | 0.059* | 0.047* | –0.076* | –0.063* | 0.114* |
| Tempo | 0.009 | –0.041* | 0.008 | 0.031* | 0.043* | –0.025* |
Table 8
Spearman rank-order correlations between users’ acoustic properties of listening behavior and socio-economic features (WHR). Correlations >0.1 are highlighted in bold face. Statistically significant correlations at p < 0.001 are marked with an asterisk (*).
| Happiness | GDP | Social Sup. | Life Exp. | Freedom | Trust | Generosity | |
| Danceability | 0.035* | 0.036* | –0.010 | 0.049* | 0.037* | 0.051* | 0.052* |
| Energy | –0.036* | –0.067* | 0.056* | –0.056* | –0.026* | –0.033* | –0.101* |
| Speechiness | –0.018* | –0.007 | 0.059* | –0.017* | 0.011 | –0.004 | –0.067* |
| Acousticness | 0.055* | 0.079* | –0.046* | 0.070* | 0.039* | 0.048* | 0.118* |
| Instrumentalness | –0.031* | 0.030* | 0.042* | 0.040* | 0.006 | 0.001 | –0.044* |
| Liveness | 0.005 | –0.019* | 0.056* | –0.030* | 0.001 | –0.008 | –0.048* |
| Valence | 0.071* | 0.047* | 0.008 | 0.051* | 0.044* | 0.064* | 0.084* |
| Tempo | 0.004 | –0.025* | 0.046* | –0.015* | 0.001 | 0.003 | –0.016* |