
1 Introduction
Music demixing is the task of separating an audio signal (a mixture) into individual components. Traditionally, music demixing challenges and benchmarks consider the separation of audio into four stems: drums, bass, vocals, and other (all remaining instruments).
Music source separation has applications in entertainment, production, music education, remixing, and audio restoration. For example, vocal suppression can improve karaoke experiences by allowing users to sing along with instrumental versions generated from original recordings, rather than requiring separately produced karaoke tracks. Source separation also supports professional music production workflows by enabling remixing, stem extraction, and restoration of individual musical components from mixed recordings. More broadly, related source‑separation and enhancement techniques are used in speech and assistive‑audio applications, such as improving voice clarity in noisy environments.
Modern audio source‑separation systems use a range of deep learning architectures. Many follow an encoder–decoder design inspired by the U‑Net architecture (Ronneberger et al., 2015), in which an encoder extracts hierarchical representations and a decoder reconstructs the separated source signal or a source estimate. These models may operate either directly in the waveform domain (Défossez et al., 2019; Stoller et al., 2018) or in the time–frequency domain (Défossez, 2021), where they commonly estimate spectrogram masks or target spectrograms. Popular source‑separation models based on U‑Net‑like architectures include Spleeter (Hennequin et al., 2020), Demucs (Défossez, 2021; Rouard et al., 2023), MDX‑Net (Kim et al., 2021), and Ultimate Vocal Remover (UVR) (Anjok07 and other contributors, 2023). More recently, transformer‑based architectures have advanced music source separation, achieving state‑of‑the‑art results. Band‑Split RoPE Transformer (BS‑Roformer), proposed Lu et al. (2023), is a frequency‑domain model that splits input spectrograms into subbands and applies hierarchical transformers with rotary position embeddings (RoPE) (Su et al., 2024) to model both intraband and interband dependencies. Another transformer‑based architecture, MelBand Roformer (Wang et al., 2023), uses a mel‑scale subband decomposition and applies a hierarchical transformer with rotary position embeddings.
Various benchmarks and challenges have been developed to evaluate audio separation approaches. In recent challenges (Fabbro et al., 2024; Mitsufuji et al., 2022), participants were asked to separate a song into four stems: vocals, bass, drums, and other (all remaining instruments and accompaniment). Popular datasets include MUSDB18 (Rafii et al., 2017) and MUSDB18‑HQ (Rafii et al., 2019), used in the SiSEC MUS challenge (Stöter et al., 2018) and in AICrowd Music Demixing Challenge 2021 (Mitsufuji et al., 2022), Divide and Remaster (Petermann et al., 2022), used in the Sound Demixing Challenge 2023 (SDX23, 2023), MedleyVox (Jeon et al., 2023), and AudioSet (Gemmeke et al., 2017). These existing benchmarks have provided common test sets for comparing music source‑separation systems and have enabled reproducible evaluation across models. However, current evaluation resources still leave several important gaps.
Evaluation in the field remains fragmented: results are often reported across different datasets, metrics, and model versions, making direct comparison difficult. A centralized evaluation platform is therefore needed to allow models to be tested reproducibly in one place, using common datasets, standardized metric implementations, and public leaderboards that can be continuously updated as new systems are submitted. In addition, existing benchmarks primarily focus on the traditional four‑stem separation task (vocals, bass, drums, and others), leaving a significant gap in the evaluation of instrument‑specific and vocal‑specific separation tasks, such as guitar, piano, bowed strings, wind instruments, lead/back vocal, and male/female vocal separation. Instrument‑specific and vocal‑specific datasets are important for assessing models’ ability to separate those individual sources beyond the standard four‑stem setting, and they have practical applications in music production, remixing, education, and practice scenarios, where users may want to isolate or suppress a specific instrument or vocal part. Finally, repeated use of a small number of standard datasets can also make it difficult to assess whether models generalize beyond familiar benchmark material.
In this paper, we address these limitations by introducing MVSep Quality Checker, a publicly accessible evaluation platform for reproducible evaluation across diverse datasets, metrics, and source‑separation tasks. It allows researchers to easily evaluate and compare their algorithms against state‑of‑the‑art approaches. The platform provides open leaderboards, public submissions, standardized metric implementations, and a collection of new and existing benchmarks covering multiple source‑separation tasks. These include instrument‑specific, stem‑specific, vocal‑specific, multi‑song, and super‑resolution benchmarks. MVSep also provides access to a wide range of pre‑trained models. The MVSep platform supports public submissions, enabling transparent and reproducible comparisons across the research community. All benchmark mixtures are available for download, and the leaderboards are accessible at https://mvsep.com/quality_checker/.
We further present a comparison of current popular models using these benchmarks across a range of metrics. In addition to widely used evaluation measures, we introduce two new metrics specifically designed for music separation assessment: Bleedless and Fullness. The code for all metric implementations is available at https://github.com/ZFTurbo/Music-Source-Separation-Training/blob/main/utils/metrics.py.
2 Evaluation Metrics
Various metrics are used to evaluate sound source‑separation tasks, each capturing a different aspect of separation quality, such as interference (energy from non‑target sources leaking into the estimate), artifacts, distortion, and perceptual quality. No single metric covers all of these axes well, which is why our platform reports several complementary metrics. We summarize each metric below, together with a rationale for its inclusion and the aspect of separation quality it is best suited to assess.
The signal‑to‑distortion ratio (SDR), first proposed by Vincent et al. (2006), is a common metric for assessing the quality of audio separation algorithms. SDR measures how well the desired audio sources have been separated from the mixture while minimizing the distortion caused by residual interference. It is calculated as the ratio of the energy of the reference signal to the energy of the error (difference between reference and estimate). Here, we adopt the formulation used in the MDX and SDX challenges (Fabbro et al., 2024; Mitsufuji et al., 2022), defined as follows:
where denotes the waveform of the ground truth and the waveform of the estimate for one of the sources, with being the discrete time index and the Euclidean norm over the two stereo channels. We use a small constant to avoid division by zero and to keep the metric finite when the target stem is digitally silent. The higher the SDR score, the better the output of the system.
The average SDR across all stems is used for each record:
where is the total number of stems in a given record, and is the SDR value for the ‑th stem. Finally, the overall score is the average of the scores for all records in the test set.
The SDR metric (Vincent et al., 2006) is widely used to compare different sound demixing models in challenges (Fabbro et al., 2024; Mitsufuji et al., 2022), and we use it as the primary metric on our evaluation platform. Despite its widespread use, SDR has several notable limitations. SDR gives significantly more weight to low frequencies than to high frequencies. It does not necessarily correlate well with human perception of separation quality. SDR can be sensitive to scaling differences between the reference and estimated signals.
Because of these limitations, SDR is often supplemented with additional metrics that capture complementary aspects of separation quality. Below, we describe several such metrics used in the MVSep platform.
Scale‑invariant signal‑to‑distortion ratio (SI‑SDR) (Roux et al., 2019) is a variant of the SDR metric that is invariant to the scaling of the estimate relative to the reference. It is calculated by scaling the estimate to match the reference signal and then computing the SDR. SI‑SDR is therefore best suited to assess distortion independently of gain mismatches.
L1Freq metric (Gusó et al., 2022) compares the magnitude spectrograms of the reference and estimated audio signals using the short‑time Fourier transform (STFT) and calculates the L1 loss between them. The result is scaled to the range of [0, 100]. L1Freq is best suited to measure spectral distortion and is more sensitive to errors distributed across the frequency axis than time‑domain SDR, including errors at high frequencies that SDR tends to underweight.
Logarithmic weighted mean squared error (LogWMSE) is a metric that evaluates the quality of the estimated signal compared to the reference signal in the context of audio source separation. The result is given on a logarithmic scale, which helps in evaluating signals with large amplitude differences. It is designed to address several shortcomings of common audio metrics, most importantly the lack of support for digital silence targets. The code implementation is available at https://github.com/nomonosound/log-wmse-audio-quality.
AuraSTFT metric (Steinmetz and Reiss, 2020) evaluates the spectral difference between the reference and estimated audio signals using STFT loss. The AuraSTFT metric computes the STFT loss in both logarithmic and linear magnitudes and is commonly used to assess the quality of audio separation tasks. The result is a value in the range of [0, 100]. By combining linear‑ and log‑magnitude terms, AuraSTFT is best suited to capture spectral artifacts and distortion across a wide dynamic range. The code implementation is available at https://github.com/csteinmetz1/auraloss.
AuraMRSTFT metric (Steinmetz and Reiss, 2020) is similar to the AuraSTFT metric but evaluates the spectral difference between the reference and estimated audio signals using multiresolution STFT loss instead. It uses multiresolution STFT analysis, which allows for better representation of both low‑ and high‑frequency components in audio signals. The result is a value in the range of [0, 100]. The implementation is available at https://github.com/csteinmetz1/auraloss. Taken together, these metrics cover complementary aspects of separation quality.
2.1 Bleedless and fullness metrics
We propose a new pair of metrics that are gaining popularity within the music separation community: Bleedless and Fullness. These metrics use magnitude spectrogram differences between estimated and reference signals, mapped to a mel frequency scale and decibel (dB) domain, to align with human auditory perception. In this framework, positive values indicate unwanted additional signals (e.g., bleed, artifacts), while negative values indicate missing content (e.g., lost harmonics, missing instruments). The Bleedless metric penalizes average positive differences, while the Fullness metric penalizes average negative differences. In other words, the Bleedless metric quantifies how much unwanted additional energy (e.g., bleed from other source or additive artifacts) appears in the estimated target, while the Fullness metric evaluates how completely the target source has been preserved. Both metrics are normalized to the range [0, 100], with higher values indicating better performance. The metrics code implementation can be found at https://github.com/ZFTurbo/Music-Source-Separation-Training/blob/main/utils/metrics.py.
Formally, let and denote the reference and estimated waveforms. We compute their magnitude STFTs with a periodic Hann window, map them onto a mel scale using a mel filter bank , and convert to the decibel domain:
where the logarithmic magnitudes are clipped to an 80 dB dynamic range. Let be the per‑bin difference over all mel‑frequency/time bins , and define the sets of positive and negative bins and with mean deviations
The two metrics are then defined as
so that (no added energy) yields , and (no missing energy) yields .
Figure 1 illustrates these concepts through color coding. The blue areas show what is missing from the predicted stem compared to the original, resulting in a lower Fullness score. More blue indicates more missing content. The red areas show unwanted content appearing in the predicted stem that is not present in the original. This represents bleed from the other stems, resulting in a lower Bleedless score. More red indicates more interference from the other instruments.
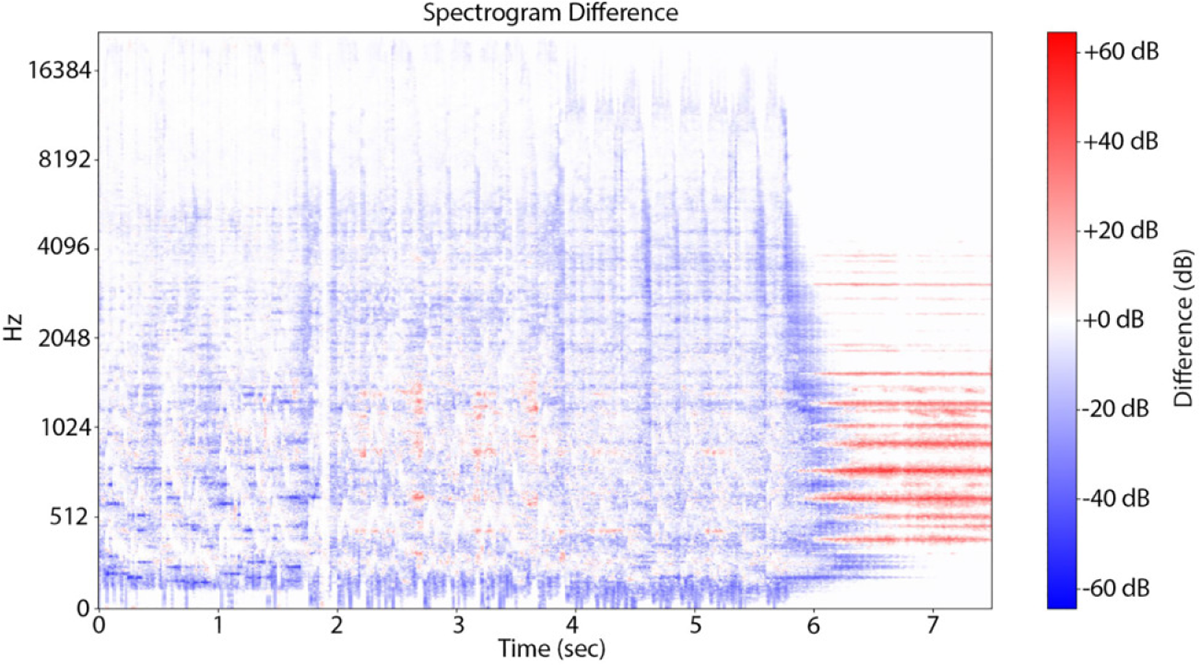
Figure 1
Illustration of Bleedless and Fullness metrics. Blue represents what disappeared from the predicted stem compared to the original: the more blue there is, the worse the Fullness metric. Red represents what appeared as extra compared to the original stem signal (bleed from the other stems): the more red there is, the lower the Bleedless value.
Fullness and Bleedless often exhibit a trade‑off during training: as one increases, the other decreases, and metrics can fluctuate significantly. One can obtain models that emphasize fuller extraction of an instrument but introduce additional noise, as well as models that produce cleaner extractions at the cost of losing some instrument content. The code implementation for all metrics discussed above, including Fullness and Bleedless, is available at https://github.com/ZFTurbo/Music-Source-Separation-Training/blob/main/utils/metrics.py.
3 Overview of Popular Models for Sound Source Separation
In this section, we provide a brief overview of sound source‑separation models present on the leaderboards of our evaluation platform. Details for each model architecture can be found in the corresponding referenced papers and/or code repositories.
BS‑Roformer (Lu et al., 2023) is based on a band‑split RoPE (Su et al., 2024) transformer, a frequency‑ domain model for music source separation that divides input spectrograms into subbands and applies hierarchical transformers with rotary position embeddings (Su et al., 2024) to model both intraband and interband dependencies. An example of code implementation is available at https://github.com/lucidrains/BS-RoFormer.
MelBand Roformer (Wang et al., 2023) is similar to BS‑Roformer; it replaces heuristic band splitting with a mel‑scale subband decomposition and applies a hierarchical transformer with rotary position embeddings.
SCNet (Tong et al., 2024) is a frequency‑domain music source‑separation model that uses a sparsity‑based encoder and adaptive subband compression to improve performance and efficiency. The official repository is available at https://github.com/starrytong/SCNet.
The ZFTurbo algorithm is an ensemble of models that achieved top placements in the Sound Demixing Challenge 2023. The details are in Fabbro et al. (2024).
The MDX23C algorithm was also proposed at the Sound Demixing Challenge 2023 (Fabbro et al., 2024) by the team kuielab from Korea University. The details are in Fabbro et al. (2024); the source code is at https://github.com/kuielab/sdx23/.
VitLarge23 by MVSep is a U‑Net based on segmentation models from https://github.com/qubvel-org/segmentation_models.pytorch with a MaxVit 512 encoder backbone from Huggingface.
Demucs is based on a U‑Net convolutional architecture inspired by Wave‑U‑Net (Stoller et al., 2018), with the innermost layers replaced by a cross‑domain transformer encoder. The model is able to separate drums, bass, and vocals from the rest of the accompaniment. Since the initial publication, different versions of the Demucs models have evolved with v4 being the latest. The v4 version features hybrid transformer Demucs (Défossez, 2021; Rouard et al., 2023), a hybrid spectrogram/waveform separation model with the innermost layers replaced by a cross‑domain transformer encoder. The transformer uses self‑attention (Vaswani et al., 2017) within each domain and cross‑attention across domains.
The MDX‑Net model (Kim et al., 2021) is a two‑stream neural network for music demixing. The model has a time–frequency branch and a time‑domain branch and blends results from the two streams to generate the final estimation. The model achieved top placements in the MDX21 competition. MDX‑Net consists of six networks, all trained separately; see details in Kim et al. (2021). The code repository is available at https://github.com/kuielab/mdx-net.
Ultimate vocal remover (UVR) (Anjok07 and other contributors, 2023) is a library containing a range of pre‑trained models for vocals separation, available at https://github.com/Anjok07/ultimatevocalremovergui. This collection includes pre‑trained MDX‑Net and retrained Demucs models, as well as its own architectures for vocal separation.
4 The Multisong Dataset for Music Separation, Multisong MVSep
The Multisong MVSep dataset comprises one‑minute excerpts from publicly available compositions in a variety of genres. Each track has a sample rate of kHz. The dataset is available for download at https://mvsep.com/quality_checker/, with an uncompressed size of approximately GB.
The Multisong MVSep dataset is built from music sourced from Epidemic Sound, https://www.epidemicsound.com/, a catalog spanning a wide range of genres and production styles. One‑minute excerpts were selected manually by a professional musician and co‑author, Bas Curtiz, with two guiding principles: no perceptible leakage between vocal and instrumental stems, and preference for the most active sections of each track. The source tracks were also selected by him with stylistic diversity prioritized, spanning more than genres, so that strong performance on this benchmark dataset reflects genuine generalization. All audio was originally sampled at 48 kHz and was converted to 44.1 kHz / 16‑bit using dBpoweramp. Each mixture was then normalized to the range by dividing all four stems by the peak absolute amplitude of the mixture, , to preserve their relative amplitudes.
Our benchmark offers several advantages compared to existing datasets. The Multisong MVSep dataset encompasses a significantly broader range of musical genres than MUSDB18 (Rafii et al., 2017), including over diverse styles and spanning multiple decades (1960s through the 2020s). The genres represented in the Multisong MVSep dataset include: Acoustic, Folk, Modern Blues, American Roots Rock, Modern Country, Ambient, Beats, Dance, Deep House, Disco, Drum n Bass, Electro, Euro Pop, Future Bass, House, Soft House, Funk, Alternative Hip Hop, Mainstream Hip Hop, Old School Hip Hop, Trap, Acid Jazz, Big Band, Modern Jazz, Smooth Jazz, Bossa Nova, Modern Latin, Salsa, 1970s Pop, 1980s Pop, 1990s Pop, 2000s Pop, 2010s Pop, 2020s Pop, Afrobeats, Indie Pop, K‑pop, Synth Pop, RnB, Soul, 1960s Rock, Alternative, Hard Rock, Punk, Modern Hymns, Praise & Worship, and Indian music. This genre diversity helps evaluate whether models generalize well across varied musical contexts. We note that there exists a small possibility that some melodies in the Multisong MVSep test set may have been included in training data for some models, potentially creating minor data leakage. The dataset also contains audio files with four separated stems that make up the mixtures: vocals, bass, drums, and other accompaniment. Our evaluation platform maintains the reference stems (ground truth separated sources) as closed‑source and server‑side only. Users can download the mixed audio for educational/evaluation purposes, but the separated stems remain inaccessible, ensuring fair and unbiased evaluation of all submitted models.
Tables 1 and 2 show performance metrics for the top selected models evaluated on the Multisong MVSep benchmark. It can be seen that frequency‑domain models dominate, with SCNet achieving superior results for bass, drums, and other stems, while Roformers perform better for vocal separation. Ensembles outperform individual models, as expected. The ensemble is a simple weighted average. Note that Sami‑bytedance‑v.1.1 is a private model with no publicly available details or code.
Table 1
Selected models and their SDR scores for instrumental and vocal separation on the Multisong MVSep dataset.
| Model and Description | SDR Instr. | SDR Vocal |
|---|---|---|
| Sami‑bytedance‑v.1.1, private model | 18.13 | 11.82 |
| Ensemble: SCNet XL + BS‑Roformer + MelBand Roformer | 17.92 | 11.62 |
| BS‑Roformer (by MVSep) | 17.62 | 11.31 |
| MelBand Roformer (by Bas Curtiz) | 17.55 | 11.24 |
| MelBand Roformer (by Kimberley Jensen) | 17.32 | 11.01 |
| BS‑Roformer (by viperx) | Overlap 2 | dim_t 1101 | 17.28 | 10.97 |
| SCNet XL | 17.27 | 10.96 |
| SCNet Large | 17.05 | 10.74 |
| SCNet Small | 16.56 | 10.25 |
| VitLarge23 | 16.09 | 9.78 |
| ZFTurbo algorithm from MDX23 competition | 15.82 | 9.56 |
| MDX‑Net (by Kimberley Jensen). Predict vocals part (FFT: 7680) | 15.70 | 9.36 |
| MDX: UVR‑MDX‑NET_Main_427 (by UVR team). Predict vocals part (FFT: 6144) | 15.61 | 9.32 |
| MDX: UVR‑MDX‑NET Inst HQ 2 (by UVR team). Predict instrumental part (FFT: 6144) | 15.22 | 9.11 |
| Demucs4 HT algorithm trained on 800 songs, fine‑tuned for each stem | 14.73 | 8.42 |
| Demucs3 algorithm trained on 800 songs | 14.54 | 8.24 |
| Demucs4 HT algorithm trained on 800 songs, tuned for average SDR for 4 stems | 14.49 | 8.18 |
| Demucs4 HT, 6 stems (additional piano and guitar) | 14.48 | 8.17 |
| Demucs3 Model B, winning algorithm from MDX21 competition | 14.44 | 8.13 |
| UVR vocal models, 0_HP2‑4BAND‑3090_4band_arch‑500m_1 | 13.59 | 7.28 |
Table 2
Selected models and their SDR metrics for bass, drums, and other separation on the Multisong MVSep dataset.
| Model and Description | SDR Bass | SDR Drums | SDR Other |
|---|---|---|---|
| Ensemble: SCNet XL + MelBand Roformer + BS‑Roformer | 14.14 | 13.57 | 8.10 |
| SCNet XL | 13.81 | 13.42 | 7.22 |
| Sami‑bytedance‑v.1.1, private model | 13.74 | 13.52 | 6.92 |
| SCNet Large | — | 13.01 | — |
| ZFTurbo algorithm from MDX23 competition | 12.50 | 11.70 | 6.63 |
| BS‑Roformer | 12.49 | 12.82 | — |
| MelBand Roformer | — | 12.53 | — |
| Demucs4 HT (fine‑tuned by MVSep) | 12.52 | 12.04 | — |
| Demucs4 HT algorithm trained on 800 songs, fine‑tuned for each stem (shifts = 10, overlap = 0.95) | 12.24 | 11.41 | 5.84 |
| Demucs4 HT algorithm, fine‑tuned for each stem; (shifts = 1, overlap = 0.95) 10 times faster than the previous | 12.24 | 11.40 | 5.84 |
| Demucs4 HT algorithm trained on 800 songs, tuned for average SDR for 4 stems | 11.74 | 10.90 | 5.57 |
| Demucs4 HT, 6 stems (additional piano and guitar) | 11.42 | 10.59 | — |
| Demucs3 algorithm trained on 800 songs | 11.25 | 10.76 | 5.50 |
| Demucs3 Model B, MDX21 competition winner | 10.69 | 10.27 | 5.35 |
To enable a direct comparison between the Multisong MVSep dataset and the widely used MUSDB18 test set, Table 3 reports the SDR scores of several representative models that we trained on MUSDB18‑HQ (100 songs) for an apples‑to‑apples comparison and evaluated on both benchmarks across all four stems.
Table 3
SDR performance (dB) of selected models trained on MUSDB18‑HQ (100 songs) and evaluated on the MUSDB18 test set and the Multisong MVSep benchmark.
| Model and Description | MUSDB18 Test | Multisong MVSep | ||||||||
|---|---|---|---|---|---|---|---|---|---|---|
| Avg | Bass | Drums | Vocals | Other | Avg | Bass | Drums | Vocals | Other | |
| MDX23C1 | 7.15 | 5.77 | 7.93 | 9.23 | 5.68 | 7.02 | 8.40 | 7.73 | 7.36 | 4.57 |
| SCNet Small (by starrytong)2 | 9.03 | 8.89 | 10.44 | 9.90 | 6.89 | 8.87 | 11.07 | 10.79 | 8.27 | 5.34 |
| SCNet Masked Small1 | 8.81 | 8.32 | 10.48 | 10.05 | 6.40 | 8.86 | 11.00 | 10.57 | 8.35 | 5.51 |
| SCNet Large1 | 9.32 | 8.63 | 10.89 | 10.69 | 7.06 | 9.19 | 11.15 | 11.04 | 8.94 | 5.62 |
| SCNet Large (by starrytong)2 | 9.70 | 9.38 | 11.15 | 10.94 | 7.31 | 9.28 | 11.27 | 11.23 | 9.05 | 5.57 |
| SCNet XL1 | 9.80 | 9.23 | 11.51 | 11.05 | 7.41 | 9.72 | 11.87 | 11.49 | 9.32 | 6.19 |
| SCNet XL IHF1 | 10.08 | 9.23 | 11.81 | 11.42 | 7.88 | 9.92 | 11.94 | 11.58 | 9.68 | 6.48 |
| SCNet Masked XL IHF1 | 9.82 | 8.91 | 11.62 | 11.06 | 7.70 | 9.67 | 11.57 | 11.38 | 9.43 | 6.30 |
| BS‑Roformer1 | 9.65 | 8.48 | 11.61 | 11.08 | 7.44 | 9.38 | 11.08 | 11.29 | 9.19 | 5.96 |
Average SDR is consistently lower on Multisong MVSep than on the MUSDB18 test set, indicating that Multisong MVSep is the more difficult benchmark overall. The per‑stem results reveal that this gap is driven primarily by the vocals and other stems; bass is separated more accurately on Multisong MVSep across all models. The two benchmarks, therefore, stress different aspects of separation quality and should be regarded as complementary.
5 Instrument‑Specific Benchmarks on MVSep Evaluation Platform
The MVSep evaluation platform has a comprehensive set of benchmarks, including test sets to assess the models’ separation quality for individual instruments. Here, we describe instrument‑specific datasets and show leaderboards on those benchmarks. The datasets were prepared from multiple sources, outlined for each benchmark below. The sources already had separated stems. First, tracks were selected and, in some cases, mixed specifically for the corresponding instrument‑specific benchmarks. Then, one‑minute excerpts were cut programmatically using a Python script to select the loudest parts of the tracks.
5.1 Guitar MVSep benchmark
The guitar validation dataset consists of tracks, each approximately one minute long, with a sample rate of kHz. The guitar stem includes electric guitar, acoustic guitar, and ukulele. The dataset includes one‑minute excerpts of tracks from the following sources:
The SDR performance of selected models and ensembles on the Guitar MVSep benchmark is shown in Table 4.
Table 4
Selected models and their SDR metrics on the Guitar MVSep dataset.
| Model and Description | SDR |
|---|---|
| Sami‑bytedance‑v.1.1, private model | 8.27 |
| Ensemble: BS‑Roformer + MelBand Roformer | 7.51 |
| Ensemble: MDX23C + MelBand Roformer | 7.18 |
| BS‑Roformer (by viperx) | 7.12 |
| MelBand Roformer (by MVSep) | 7.02 |
| MelBand Roformer (by viperx) | 6.85 |
| MDX23C | 6.34 |
| Demucs4 HT, 6 stems | 5.24 |
5.2 Piano MVSep benchmark
The piano validation dataset consists of tracks, each approximately one minute long, with a sample rate of kHz. The piano stem includes piano, grand piano, and electric piano for comprehensive evaluation. The piano dataset includes track excerpts from the following sources:
Moises dataset (Pereira et al., 2023)
ClubRemixer (https://clubremixer.com)
Random mix of piano tracks from the Maestro dataset (Hawthorne et al., 2019) and test data from MUSDB18 (Rafii et al., 2017), with the other stem excluded since it may contain piano
A limitation of this benchmark is the partial use of randomly mixed data. Recent work (Jeon et al., 2024) shows that separation results on randomly mixed material can differ significantly from those on non‑randomly mixed music, which is beat‑ and tonality‑consistent across stems. Random mixtures may therefore not be fully representative of real‑world piano separation performance. Currently, these random mixtures constitute only a small part of the piano benchmark, and we plan to replace them with more realistic mixtures in future releases.
The performance of selected models for the Piano MVSep benchmark is shown in Table 5.
Table 5
Selected models and their performance metrics on the Piano MVSep dataset.
| Model and Description | SDR | L1Freq | AuraMRSTFT |
|---|---|---|---|
| Sami‑bytedance‑v.1.1, private model | 7.30 | 56.65 | 6.04 |
| Ensemble: SCNet + MelBand Roformer | 6.20 | 52.45 | 6.75 |
| SCNet Large | 5.89 | 51.56 | 6.66 |
| MelBand Roformer (by viperx) | 5.71 | 52.51 | 5.15 |
| MDX23C | 5.59 | 51.90 | 6.81 |
| Demucs4 HT, 6 stems | 2.23 | 41.21 | 3.69 |
5.3 Bowed strings MVSep benchmark
The bowed strings validation dataset consists of tracks, each approximately one minute long, with a sample rate of kHz. The bowed strings stem includes the following instruments: fiddle, violin, viola, cello, and double bass. The dataset includes track excerpts from:
Moises dataset (Pereira et al., 2023)
ClubRemixer (https://clubremixer.com)
The performance of the top selected models on the Bowed Strings MVSep benchmark is shown in Table 6. All metrics correspond to bowed‑strings separation.
5.4 Wind MVSep benchmark
The wind validation dataset consists of tracks, each approximately one minute long, with a sample rate of kHz. The wind stem includes brass and woodwind instruments. Specifically, it includes flute, saxophone, trumpet, trombone, horn, clarinet, oboe, harmonica, bagpipes, bassoon, tuba, kazoo, piccolo, flugelhorn, ocarina, shakuhachi, melodica, reeds, didgeridoo, musette, and gaida. The wind instruments dataset includes track excerpts from the following sources:
Moises dataset (Pereira et al., 2023)
ClubRemixer (https://clubremixer.com)
SynthSOD (García‑Martínez et al., 2025) (https://zenodo.org/records/13759492)
The performance of the top selected models on the Wind MVSep benchmark is shown in Table 7. All metrics correspond to wind‑instrument separation.
Table 7
Selected models and their performance metrics on the Wind MVSep benchmark.
| Model and Description | SDR | L1Freq | AuraMRSTFT |
|---|---|---|---|
| Sami‑bytedance‑v.1.1, private model | 7.54 | 55.28 | 5.77 |
| SCNet Large | 6.76 | 51.95 | 6.31 |
| MelBand Roformer (by MVSep) | 6.73 | 52.95 | 5.32 |
| X‑Minus Wind (MelBand Roformer) | 2.51 | 41.78 | 3.62 |
Note that the Sami‑bytedance‑v.1.1 model submission that showed superior metrics for all individual instrument‑separation tasks in Tables 4–7 is a private model submitted by ByteDance Corp. We have no model card or code for it and do not know whether it is an individual model or an ensemble. Due to superior performance, we chose to include it in our review. The overview of individual models presented on the leaderboards is in Section 3. Ensembles perform better than individual models (see Tables 4 and 5), as expected. Among publicly disclosed individual models, SCNet and Roformer variants consistently rank near the top of the leaderboards for various instrument‑separation tasks.
5.5 DrumSep benchmark
The DrumSep validation dataset consists of short tracks with a sample rate of kHz and encoded in FLAC format. The first part of the dataset includes acoustic drums and contains different drum kits ( tracks per kit) with different playing styles. The second part includes electric drums and consists of drum kits ( track per kit). There are five different stems and one additional summed stem in DrumSep: kick, snare, toms, hi‑hat (hh), cymbals, and an additional hh‑cymbals stem. Here, hh‑cymbals is a mix of hi‑hat and cymbals stems, while the cymbals stem itself is a mix of ‘ride’ and ‘crash’ stems. This benchmark is useful for evaluating four‑stem models that typically separate kick, snare, toms, and a combined hi‑hat and cymbals stem.
The DrumSep dataset was created by a professional musician and co‑author, Jeremy Bonnot, using two different workflows. The acoustic drums part was produced using Toontrack Superior Drummer, a hyper‑realistic virtual instrument library featuring multiple drum kits and lots of controls. Using virtual instruments makes it possible to create bleed‑free drum element stems, which is impossible when recording a real acoustic drum kit played live. For the electronic drums portion, royalty‑free one‑shot samples from various famous drum machines and some more sophisticated samples were arranged to produce credible drumbeats. The tracks were then mixed and mastered by him to sound closer to modern commercial music. The DrumSep mixtures are released under the CC BY‑NC‑ND 4.0 license.
Table 8 shows the performance of individual models on the DrumSep benchmark. SCNet (Tong et al., 2024) models show the best performance on this benchmark, producing slightly better SDR metrics than transformer‑based Roformers.
Table 8
Selected models and their SDR metrics for drum components separation.
| Model and Description | SDR | |||||
|---|---|---|---|---|---|---|
| Kick | Snare | Toms | hh | Cymbals | hh‑Cymbals | |
| SCNet XL, 5 stems (by MVSep) | 17.89 | 12.56 | 14.14 | 3.63 | 6.15 | 7.38 |
| SCNet XL, 6 stems (by MVSep) | 17.74 | 12.43 | 14.24 | 3.39 | 5.91 | 7.19 |
| SCNet XL, 4 stems (by MVSep) | 17.61 | 12.37 | 13.40 | — | — | 7.48 |
| MelBand Roformer, 6 stems (by MVSep) | 17.46 | 12.64 | 13.69 | 5.05 | 7.06 | 7.91 |
| MelBand Roformer, 4 stems (by MVSep) | 16.85 | 12.49 | 13.55 | — | — | 8.47 |
| MDX23C, 5 stems (high fullness version) | 16.50 | 11.40 | 12.07 | 3.93 | 6.27 | — |
| MDX23C, 6 stems (by aufr33 and jarredou) | 14.54 | 9.79 | 10.63 | 3.19 | 6.08 | 6.76 |
| Demucs4 H, 4 stems (by inagoy) | 10.52 | 6.05 | 4.68 | — | — | 5.03 |
6 Vocal‑Specific Benchmarks on the MVSep Evaluation Platform
6.1 Lead/Back vocals
The Lead/Back Vocals MVSep dataset consists of tracks, each exactly seconds long and with a sample rate of kHz. There are four different stems: lead (lead vocals), back (back vocals), instrum (instrumental only, without vocals), and back‑instrum (back vocals and instrumental together). The Lead/Back Vocals dataset comprises tracks from:
Moises dataset (Pereira et al., 2023)
The closest existing resource is MedleyVox (Jeon et al., 2023), whose main vs. rest category evaluates the separation of a main vocal from the remaining vocals and is therefore comparable in spirit to our task. Our benchmark differs from it in the following aspects. First, MedleyVox explicitly assumes that vocals have already been cleanly separated from the accompaniment, and the released data contain vocal stems only. The accompaniment can in principle be reconstructed by obtaining MedleyDB v1 and v2 separately. Our dataset distributes the instrum stems directly, allowing models to be evaluated end‑to‑end on realistic full mixtures. Second, our tracks are drawn from four independent catalogs, broadening the range of genres, production styles, and mixing conventions represented. The two datasets are therefore complementary.
6.2 Male/Female vocals
The Male/Female separation dataset consists of tracks, each approximately one minute long with a sample rate of kHz. Each track contains multiple vocals taken from songs without instrumental accompaniment. The Male/Female dataset comprises tracks from the following sources:
Moises dataset (Pereira et al., 2023)
Seven tracks constructed from the MUSDB18 (Rafii et al., 2017) test set, where pairs of songs with male and female lead vocals were selected manually and combined
For the MUSDB18‑derived tracks, the vocal stems of each pair of songs were mixed by simple summation, using the segments with the highest mean amplitude, and the resulting mixture was peak‑normalized to .
The current leaderboards for the vocal benchmarks are available at https://mvsep.com/quality_checker/other_leaderboards. The task is to separate male from female vocals.
7 Bleedless and Fullness Benchmark
To illustrate the practical value of the proposed Bleedless and Fullness metrics, Table 9 reports them alongside SDR for a representative set of recent vocals/instrumental separation models evaluated on the Multisong MVSep dataset. For open‑source models, we provided code references. Private models have no reference. The selection spans the three architecture types that currently dominate source‑separation leaderboards: MelBand Roformer, BS‑Roformer, and SCNet, and includes variants explicitly tuned to favor either the vocal or instrumental stem. While SDR provides a single global quality score, Fullness and Bleedless decompose performance into two perceptually meaningful axes: how much of the target source is preserved, and how much energy from other sources leaks in. The results show that models with similar SDR can exhibit very different Fullness/Bleedless trade‑offs, and that explicitly tuned variants shift these axes in the expected directions in ways that scalar SDR alone does not convey.
Table 9
Vocals and instrumental separation performance on the Multisong MVSep dataset, reporting Fullness, Bleedless, and SDR metrics. The Tune column indicates whether the model was tuned to favor the instrumental or vocal stem; ‘—’ denotes balanced models or unknown tuning.
| Model Name | Arch. | Tune | Vocals | Instrumental | ||||
|---|---|---|---|---|---|---|---|---|
| Fullness | Bleedless | SDR | Fullness | Bleedless | SDR | |||
| Kimberley Jensen1 | MelBand | — | 16.66 | 36.51 | 11.01 | 27.71 | 46.72 | 17.32 |
| Bas Curtiz edition | MelBand | — | 16.30 | 38.94 | 11.18 | 27.49 | 47.00 | 17.49 |
| MVSep (ver. 2024.10) | MelBand | — | 16.92 | 37.78 | 11.28 | 27.71 | 47.29 | 17.59 |
| Unwa v1e2 | MelBand | instr. | 14.67 | 26.83 | 10.06 | 38.85 | 35.68 | 16.37 |
| Unwa big beta v5e3 | MelBand | voc. | 20.78 | 32.02 | 10.59 | 25.65 | 45.90 | 16.90 |
| Becruily instrum4 | MelBand | instr. | 15.76 | 30.15 | 10.16 | 33.93 | 40.55 | 16.47 |
| Becruily vocals5 | MelBand | voc. | 20.72 | 31.25 | 10.55 | 28.28 | 40.85 | 16.86 |
| Gabox v10 flowers6 | MelBand | instr. | 15.85 | 25.36 | 10.66 | 37.69 | 36.34 | 16.97 |
| Becruily deux7 | MelBand | — | 22.81 | 29.78 | 11.35 | 33.41 | 42.11 | 17.51 |
| Unwa high instrum fullness8 | BS‑Roformer | instr. | 15.85 | 24.29 | 10.94 | 34.72 | 40.43 | 17.25 |
| Unwa HyperACE v2 instr9 | BS‑Roformer | instr. | 14.81 | 33.02 | 11.09 | 37.95 | 37.97 | 17.40 |
| Unwa HyperACE v2 vocals9 | BS‑Roformer | voc. | 19.07 | 34.12 | 11.39 | 27.31 | 45.48 | 17.70 |
| MVSep (ver. 2025.07) | BS‑Roformer | — | 17.23 | 38.24 | 11.89 | 27.82 | 49.12 | 18.20 |
| MVSep SCNet XL | SCNet | — | 17.96 | 26.95 | 10.96 | 28.74 | 39.42 | 17.27 |
| MVSep SCNet XL (high fullness) | SCNet | — | 23.50 | 25.30 | 10.40 | 34.04 | 35.15 | 16.60 |
| MVSep SCNet XL IHF | SCNet | — | 17.98 | 28.31 | 11.11 | 28.87 | 40.37 | 17.41 |
| Becruily SCNet XL IHF | SCNet | instr. | 22.70 | 25.48 | 10.89 | 32.31 | 38.15 | 17.20 |
Model sources:
1https://github.com/KimberleyJensen/Mel-Band-Roformer-Vocal-Model
2https://huggingface.co/pcunwa/Mel-Band-Roformer-Inst
3https://huggingface.co/pcunwa/Mel-Band-Roformer-big
4https://huggingface.co/becruily/mel-band-roformer-instrumental
5https://huggingface.co/becruily/mel-band-roformer-vocals
6https://huggingface.co/GaboxR67/MelBandRoformers/tree/main/melbandroformers/instrumental
7https://huggingface.co/becruily/mel-band-roformer-deux
We conducted preliminary blind listening tests based on pairwise preference to check alignment with human perception. The results and methodology are reported in Section 8.
8 Bleedless and Fullness: Preliminary Listening Test
To check whether new Bleedless and Fullness metrics capture perceptually meaningful dimensions, we ran a preliminary listening test using arena‑style blind pairwise preference. Voters were presented with two separated stems, vocals versus instrumental, produced by two different models from the same mixture, and asked which of the two had the better separation quality; ties were allowed. Each pair was judged on four questions: which separation is better overall, which has a fuller stem, which has less bleed from non‑target stem, and which has fewer artifacts. Pairwise comparison was chosen for preliminary checks as it is robust to inter‑listener scale bias, does not require trained listeners or anchor calibration, and remains sensitive when the two systems are close in quality.
8.1 Methodology
The listening stimuli were 15‑second fragments from tracks in the Multisong MVSep dataset, chosen to contain both vocal and instrumental stems. We collected 485 votes across 60 pairwise comparisons (vocals: 238 votes across 30 pairs; instrumental: 247 votes across 30 pairs). Model pairs were selected to span a wide range of Bleedless/Fullness trade‑offs.
We summarized the votes as a collective preference: each vote was counted as for win, for a loss, and for a tie. We computed the difference in the objective metrics for each model pair, e.g., Fullness = Fullness(model1) Fullness(model2). Alignment between an objective metric and the listener votes is then quantified by the Spearman rank correlation between the metric difference and the collective preference. Confidence intervals (95% CI) were obtained from a ‑sample bootstrap over pairs.
8.2 Preliminary listening test results
The Spearman correlation between objective metric differences and collective listener preference is shown in Table 10. Bold indicates correlations significant at .
Table 10
Spearman correlation between objective metric differences and collective listener preference, by stem ( pairs per stem).
| Listening Question | Metric | Vocals: [95% CI] | Instrumental: [95% CI] |
|---|---|---|---|
| Which separation is better overall? | SDR | [, ] | [, ] |
| L1Freq | [, ] | [, ] | |
| Bleedless | [, ] | [, ] | |
| Fullness | [, ] | [, ] | |
| Which has fuller stem? | Bleedless | [, ] | [, ] |
| Fullness | [, ] | [, ] | |
| Which has less bleed from the other stem? | Bleedless | [, ] | [, ] |
| Fullness | [, ] | [, ] | |
| Which has fewer artifacts? | SDR | [, ] | [, ] |
| L1Freq | [, ] | [, ] | |
| Bleedless | [, ] | [, ] | |
| Fullness | [, +0.33] | +0.03 [, +0.49] |
On vocals, SDR and L1Freq correlate well with overall preference ( and ), but on the instrumental stem they show no correlation ( and ). Fullness and Bleedless, by contrast, perform similarly on both stems. The Fullness metric shows a strong correlation with the perceived fullness of the stem ( for vocals, for instrumental), even with the limited number of votes from untrained listeners. Fullness is also near zero for artifacts and negative for bleed, making it discriminative of the dimension it is supposed to measure. The Bleedless metric also shows a significant correlation with the perceived bleed from the other stem ( for vocals, for instrumental); however, the preliminary confidence intervals are wide. It is worth noting that the votes were not equally distributed across voters and models; we had voters in total, with producing most of the votes. Therefore, the samples cannot be considered fully independent, and the CIs should be interpreted with caution. Bleedless also correlates with overall preference () and fewer artifacts () as strongly as with bleed itself, but only on vocals; on the instrumental stem, it shows a different pattern and correlates only with the bleed question.
In future work, we aim to conduct more extensive listening tests with trained listeners and covering more songs and possibly different stems. Many votes were ties, which is expected for a preliminary test with untrained listeners, and this diluted the results. We believe that wider listening tests with more trained listeners and covering more songs will provide more reliable results and allow us to draw more confident conclusions about the perceptual relevance of these metrics.
9 Super Resolution Checker for Music
The Super Resolution Checker for Music on the MVSep platform consists of tracks, each one minute long, with a sample rate of kHz, stored in WAV format. It contains music melodies with high frequencies cut off at (, , , , , , , , , , , , , ) Hz. Some tracks contain only vocals. The goal of this benchmark is to restore the original track with all high frequencies that were cut off. We measure the AuraMRSTFT metric for the restored audio tracks compared to the originals. The current leaderboard for the Super Resolution Checker can be seen at https://mvsep.com/quality_checker/leaderboard/super_res_music.
10 Reproducibility
To reproduce training results for our own MVSep fine‑tuned models, the training code, hyperparameters, optimizer, and other details are available in the following GitHub repository (Solovyev et al., 2026): https://github.com/ZFTurbo/Music-Source-Separation-Training. The code and models in this repository are released under the MIT License. To reproduce inference results on the MVSep evaluation platform, use the following steps:
Download benchmark datasets at https://mvsep.com/quality_checker/.
Clone the repository https://github.com/ZFTurbo/Music-Source-Separation-Training.
Run inference on the data as instructed in the repository README.
Save the separated tracks.
Upload the separated tracks to https://mvsep.com/quality_checker/ and see the results on the public leaderboards.
11 Limitations and Future Work
As we do not have control over publicly submitted models, we cannot guarantee an apples‑to‑apples comparison, as the models are usually trained on different datasets, nor can we provide exact details about every submitted model. Submissions are private, and we have no access to model cards or training protocols. However, for our own MVSep fine‑tuned models, the training code, hyperparameters, optimizer, and other details are in a GitHub repository (Solovyev et al., 2026): https://github.com/ZFTurbo/Music-Source-Separation-Training.
In Section 2.1, we introduced two new metrics, Bleedless and Fullness. Although these metrics capture global trends in bleed and missing content, they do not resolve opposing local errors within individual bins, since each STFT bin aggregates energy over its time–frequency neighborhood, analogous to pixels in images averaging spatial details. Future work may integrate multiresolution analysis or masking strategies to mitigate this limitation.
We conducted some preliminary listening tests to check the alignment of these metrics with human perceptual evaluation; see preliminary results in Section 8. Those tests indicate that Fullness and Bleedless correlate with listener judgments for both vocal and instrumental stems; however, the confidence intervals are wide, and the number of pairwise comparisons was limited to for each stem. More songs and trained listeners are needed to further validate the perceptual relevance of these metrics. This requires MOS/MUSHRA‑style listening tests with a sufficient number of listeners to obtain statistically meaningful results. Because this research is currently unfunded, we cannot conduct these evaluations at this stage; however, we plan to perform them once funding is secured. Specifically, we will validate the perceptual relevance of Bleedless and Fullness using a MUSHRA‑style listening test based on ITU‑R BS.1534‑3 (ITU‑R, 2015). Listeners will rate separated stems on two separate continuous – scales: Bleedless, measuring the perceived absence of leakage from non‑target sources, and Fullness, measuring the perceived completeness and natural body of the target source. Each trial will include an open reference, a hidden reference, several model outputs, and task‑specific anchors representing bleed‑heavy and missing‑content degradations. We plan to evaluate – short excerpts from the Multisong MVSep benchmark, compare – models selected to span different Bleedless/Fullness trade‑offs, and recruit around – trained or carefully screened listeners, in line with similar studies (Cano et al., 2016; Gupta et al., 2015; Özer and Müller, 2022; Wierstorf et al., 2017). The resulting subjective scores will be summarized with confidence intervals and correlated with Bleedless, Fullness, SDR, and related objective metrics.
At the platform level, we plan to continue expanding MVSep with additional datasets and new editions of existing benchmarks. Upcoming additions include benchmarks for rare or under‑represented solo instruments, such as violin and cello, as well as dedicated benchmarks for reverberation removal and denoising. We also plan to host open‑source datasets developed by other researchers, thereby providing an opportunity to evaluate models on common industry benchmarks within a single MVSep platform. We already host the popular Divide and Remaster (DnR) v3 dataset (Watcharasupat et al., 2024), a multilingual cinematic audio source‑separation benchmark, and we also aim to include the MUSDB18‑HQ dataset (Rafii et al., 2019).
In parallel, we are developing support for self‑reported model cards in the spirit of Model Cards from Google (Mitchell et al., 2019), which will provide structured metadata about submitted models and make leaderboard entries more interpretable.
Finally, we are exploring server‑side evaluation, in which users would upload model weights and the platform would run inference across different benchmarks, subject to authors’ willingness to share their models’ weights.
12 Conclusions
In this work, we have introduced MVSep Quality Checker, a publicly accessible evaluation platform for reproducible and transparent assessment of music source‑separation systems across multiple datasets, tasks, and metrics. The platform supports a diverse set of existing and newly introduced benchmarks, including multi‑song, stem‑specific, instrument‑specific, vocal‑specific, and super‑resolution evaluation tasks. These benchmarks address important gaps in current music source‑separation evaluation by introducing new instrument‑specific datasets, including DrumSep for drum‑component separation, Wind MVSep for wind instruments, and dedicated benchmarks for bowed strings, piano, and guitar. The platform also includes vocal‑specific benchmarks for male/female vocal separation and lead/back vocal separation.
MVSep provides open leaderboards, public submissions, and standardized metric implementations, allowing users to evaluate models by uploading separated sources and to compare results consistently across tasks. In addition to widely used metrics such as SDR, SI‑SDR, L1Freq, Log‑WMSE, AuraSTFT, and AuraMRSTFT, the platform supports two new metrics, Bleedless and Fullness, which separate two complementary aspects of source‑separation quality: the amount of unwanted bleed from non‑target sources and the completeness of the recovered target source. These metrics help expose trade‑offs that may be hidden by a single scalar SDR score, especially when models have similar SDR values but differ in how clean or complete their separated stems are.
The benchmark results show that, at the time of publication, frequency‑domain models, including Roformer and SCNet large variants, achieve the strongest performance across many tasks and that model ensembles often outperform individual models.
Overall, MVSep Quality Checker contributes a unified and extensible infrastructure for evaluating music source‑separation systems, supporting more reliable, transparent, and continuously updated comparisons across models, datasets, and separation tasks.
Acknowledgments
We acknowledge the authors of all the open‑source libraries cited for providing models and code. We also want to extend our thanks to Kimberley Jensen for vocal models and UVR project, and to the music separation community for their voting annotations for the listening tests. We are grateful to the providers of the audio material used to build our benchmarks: the Moises dataset (Pereira et al., 2023), SynthSOD (García‑Martínez et al., 2025), the Maestro dataset (Hawthorne et al., 2019), MUSDB18 (Rafii et al., 2017), Epidemic Sound (https://www.epidemicsound.com/), https://isolated-tracks.com, ClubRemixer (https://clubremixer.com), https://www.extrememusic.com, and https://www.karaoke-version.com. This research was supported in part by computational resources from HPC facilities at HSE University (Kostenetskiy et al., 2026).
Competing Interests
The authors have no competing interests to declare.