
Table 1
Lyric alignment datasets comparison.
| Dataset | Number of songs | Language | Audio type | Granularity |
|---|---|---|---|---|
| (Iskandar et al., 2006) | No training, 3 test songs | English | Polyphonic | Syllables |
| (Wong et al., 2007) | 14 songs divided into 70 segments of 20s length | Cantonese | Polyphonic | Words |
| (Müller et al., 2007) | 100 songs | English | Polyphonic | Words |
| (Kan et al., 2008) | 20 songs | English | Polyphonic | Sections, Lines |
| (Mesaros and Virtanen, 2010) | Training: 49 fragments ~25 seconds for adapting a phonetic model Testing: 17 songs | English | Training: a capella Testing: vocals after source separation | Lines |
| (Hansen, 2012) | 9 pop music songs | English | Both accompanied and a capella | Words, lines |
| (Mauch et al., 2012) | 20 pop music songs | English | Polyphonic | Words |
| DAMP dataset, (Smith, 2013) | 34k amateur versions of 301 songs | English | A capella | Not time-aligned lyrics, only textual lyrics |
| DAMPB dataset, (Kruspe, 2016) | A subset of DAMP with 20 performances of 301 songs | English | A capella | Words, Phonemes |
| (Dzhambazov, 2017) | 70 fragments of 20 seconds | Chinese Turkish | Polyphonic | Phonemes |
| (Lee and Scott, 2017) | 20 pop music songs | English | Polyphonic | Words |
| (Gupta et al., 2018) | A subset of DAMP with 35662 segments of 10s length | English | A capella | Lines |
| Jamendoaligned, (Ramona et al., 2008) (Stoller et al., 2019) | 20 Creative commons songs | English | Polyphonic | Words |
| DALI v1 (Meseguer-Brocal et al., 2018) | 5358 songs in full duration | Many | Polyphonic | Notes, words lines and paragraphs |
| DALI v2 | 7756 songs in full duration | Many | Polyphonic | Notes, words, phonemes, lines and paragraphs |
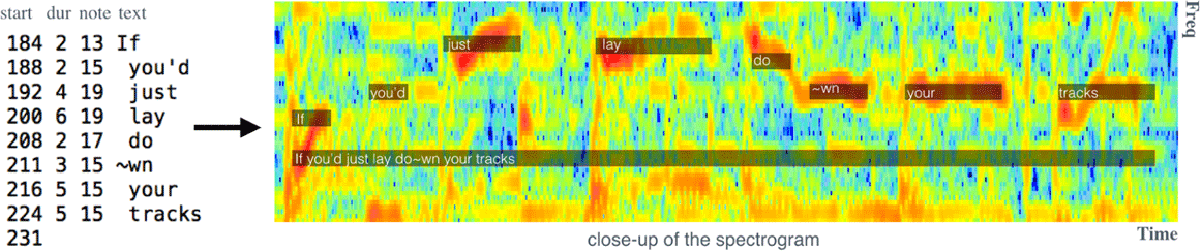
Figure 1
[Left] Our inputs are karaoke-user annotations presented as a tuple of {time (start and duration), musical note, text}. [Right] Our method automatically finds the corresponding full-audio track and globally aligns the vocal melody and the lyrics to it. The close-up of the spectrogram illustrates the alignment for a small excerpt at two levels of granularity: notes and lines.
Table 2
DALI dataset general overview.
| V | Songs | Artists | Genres | Languages | Decades |
| 1.0 | 5358 | 2274 | 61 | 30 | 10 |
| 2.0 | 7756 | 2866 | 63 | 32 | 10 |
Table 3
Statistics for the different DALI datasets. One song can have several genres.
| V | Average songs per artist | Average duration per song | Full duration | Top 3 genres | Top 3 languages | Top 3 decades |
| 1.0 | 2.36 | Audio: 231.95s With vocals: 118.87s | Audio: 344.9hrs With vocals: 176.9hrs | Pop: 2662 Rock: 2079 Alternative: 869 | ENG: 4018 GER: 434 FRA: 213 | 2000s: 2318 1990s: 1020 2010s: 668 |
| 2.0 | 2.71 | Audio: 226.78s With vocals: 114.73s | Audio: 488.1hrs With vocals: 247.2hrs | Pop: 3726 Rock: 2794 Alternative: 1241 | ENG: 5913 GER: 615 FRA: 304 | 2000s: 3248 1990s: 1409 2010s: 1153 |
Table 4
Proposed split with respect to the time correlation values. NCCt is defined at Section 4.3.
| Correlations | Tracks | |
| Test | NCCt >= .94 | 1.0: 167 2.0: 402 |
| Validation | .94 > NCCt >= .925 | 1.0: 423 2.0: 439 |
| Train | .925 > NCCt >= .8 | 1.0: 4768 2.0: 6915 |
Table 5
Overview of terms: definition of each term used in this article. NCCt is defined at Section 4.3.
| Term | Definition |
| Notes | time-aligned symbolic vocal melody annotations. |
| Annotation | basic alignment unit as a tuple of: time (start and duration in frames), musical note (with 0 = C3) and text. |
| A file with annotations | group of annotations that define the alignment of a particular song. |
| Offset_time(o) | the start of the annotations. |
| Frame rate(fr) | the reciprocal of the annotation grid size. |
| Voice annotation sequence (vas(t) ∊{0,1}) | a vector that defines when the singing voice (SV) is active according to the karaoke-users’ annotations. |
| Predictions () | probability sequence indicating whether or not singing voice is active at any frame, provided by our singing voice detection. |
| Labels | label sequence of well-known ground truth datasets checked by the MIR community. |
| Teacher | SV detection (SVD) system used for selecting audio candidates and aligning the annotations to them. |
| Student | new SVD system trained on vas(t) of the subset selected by the Teacher after . |
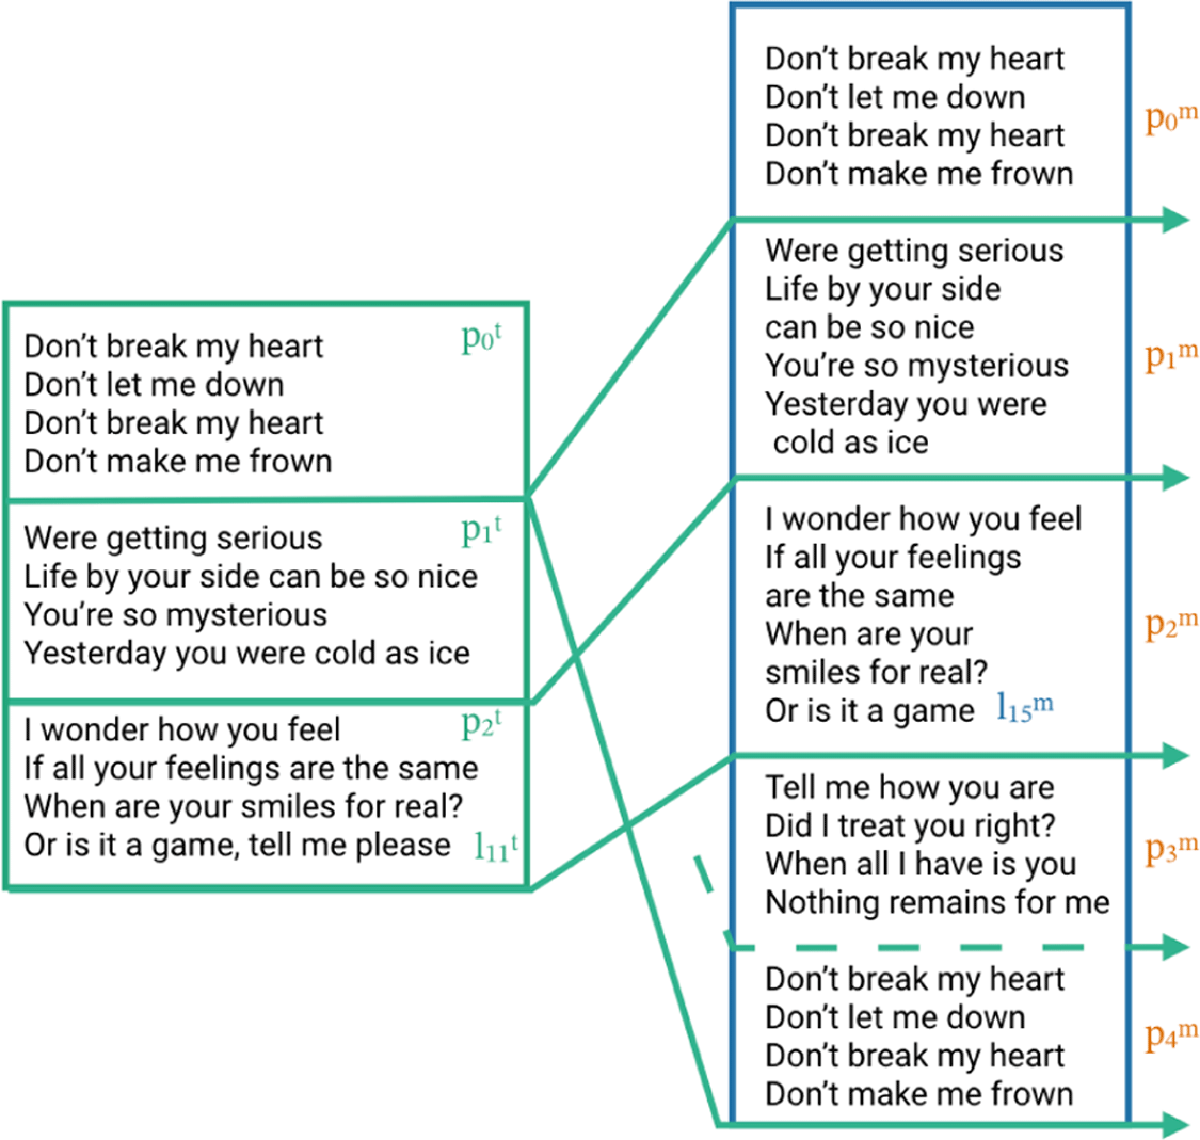
Figure 2
[Left part] Target lyrics lines and paragraphs as provided in WASABI. [Right part] The melody paragraphs pm are created by merging the melody lines lm into an existing target paragraph pt. Note how line in has no direct counterpart in and verse does not appear in any .

Figure 3
Architecture of our Singing Voice Detection (SVD) system using CNNs.
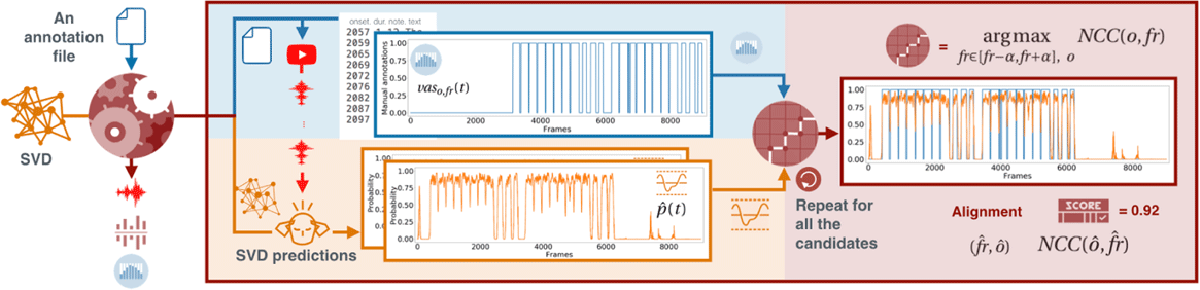
Figure 4
The input is an vaso,fr(t) (blue part – top left area) and a set of audio candidates retrieved from YouTube. The similarity estimation method uses an SVD model to convert each candidate in a (orange part – lower left area). We measure the similarity between the vaso,fr (t) and each using the cross-correlation method argmaxfr,o NCC(o, fr) described in Section 4.3 (red part – right area). The output is the audio file with the highest NCC(ô, f̂r) and the annotations aligned to it, according to the parameters f̂r and ô.
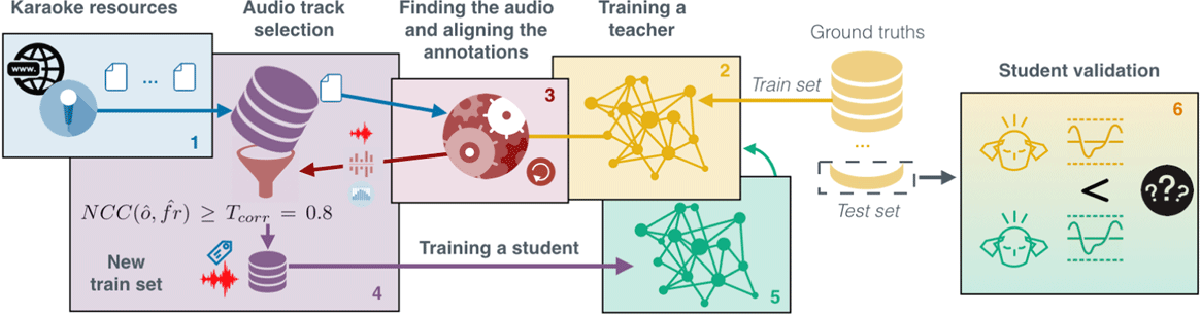
Figure 5
Creating the DALI dataset using the teacher-student paradigm.
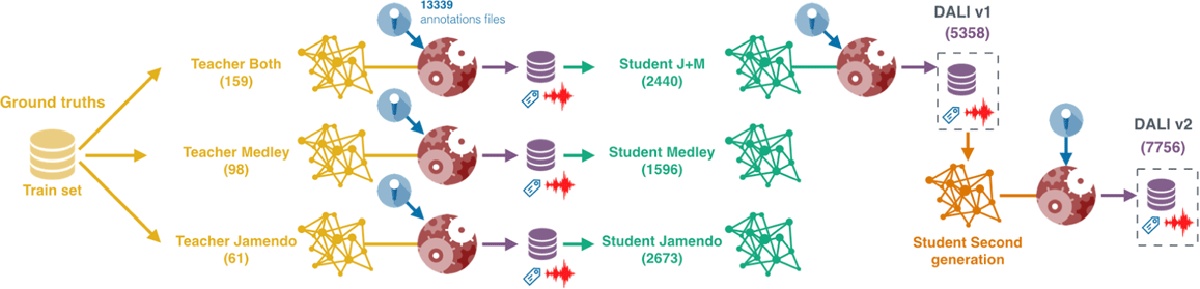
Figure 6
We create three SVD systems (teachers) using the ground truth datasets (Jamendo, MedleyDB and Both). The three systems generate three new datasets (DALI v0) used to train three new SVD systems (the first-generation students). Now, we use the best student, J+M, to define DALI v1 (Meseguer-Brocal et al., 2018). We train a second-generation student using DALI v1 and create DALI v2.
Table 6
Singing voice detection performance, measured as mean accuracy and standard deviation. Number of tracks is shown in parentheses. Nomenclature: T = Teacher, S = Student, J = Jamendo, M = MedleyDB, J+M = Jamendo + MedleyDB, 2G = second generation; in brackets we specify the name of the teacher used for training a student.
| Test sets SVD system | J_Test (16) | M_Test (36) | J_Test+Train (77) | M_Test+Train (98) |
| T_J_Train (61) S [T_J_Train] (2673) | 88.95% ± 5.71 87.08% ± 6.75 | 83.27% ± 16.6 82.05% ± 15.3 | – 87.87% ± 6.34 | 81.83% ± 16.8 84.00% ± 13.9 |
| T_M_Train (98) S [T_M_Train] (1596) | 76.61% ± 12.5 82.73% ± 10.6 | 84.14% ± 17.4 79.89% ± 17.8 | 76.32% ± 11.2 84.12% ± 9.00 | – 82.03% ± 16.4 |
| T_J+M_Train (159) S [T_J+M_Train] (2440) | 83.63% ± 7.13 87.79% ± 8.82 | 83.24% ± 13.9 85.87% ± 13.6 | – 89.09% ± 6.21 | – 86.78% ± 12.3 |
| 2G [S [T_J+M_Train]] (5253) | 93.37% ± 3.61 | 88.64% ± 13.0 | 92.70% ± 3.85 | 88.90% ± 11.7 |
Table 7
Alignment performance for the teachers and students: mean offset deviation in seconds, mean frame rate deviation in frames, and pos is position in the classification.
| mean offset rank | pos | mean offsetd | mean fr rank | pos | mean frd | |
| T_J_Train (61) S [T_J_Train] (2673) | 2.79 ± .48 2.37 ± .19 | 4 3 | 0.082 ± 0.17 0.046 ± 0.05 | 1.18 ± .41 1.06 ± .23 | 4 3 | 0.51 ± 1.24 0.25 ± 0.88 |
| T_M_Train (98) S [T_M_Train] (1596) | 4.85 ± .50 4.29 ± .37 | 7 6 | 0.716 ± 2.74 0.164 ± 0.10 | 1.89 ± .72 1.30 ± .48 | 7 5 | 2.65 ± 2.96 0.88 ± 1.85 |
| T_J+M_Train (159) S [T_J+M_Train] (2440) | 3.42 ± .58 2.23 ± .07 | 5 2 | 0.370 ± 1.55 0.043 ± 0.05 | 1.47 ± .68 1.04 ± .19 | 6 2 | 1.29 ± 2.29 0.25 ± 0.85 |
| 2G [S [T_J+M_Train]] (5253) | 1.82 ± .07 | 1 | 0.036 ± 0.06 | 1.01 ± .10 | 1 | 0.21 ± 0.83 |
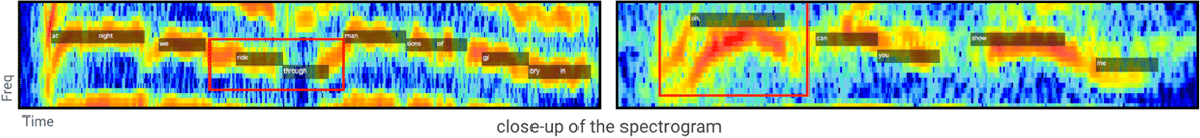
Figure 7
Local errors still present in DALI. [Left] Misalignments in time due to an imperfect annotation. [Right] An individual mis-annotated note. These problems remain for future versions of the dataset.