
Table 1
Mean and standard deviation values of selected Essentia descriptors across sources: Suno, Udio, and MSD.
| Feature | Suno | Udio | MSD |
|---|---|---|---|
| Average Loudness | |||
| Spectral Centroid | |||
| BPM | |||
| Duration (s) | |||
| Pitch Salience | |||
| Dynamic Complexity | |||
| Tuning Diatonic Strength | |||
| Chord Change Rate |
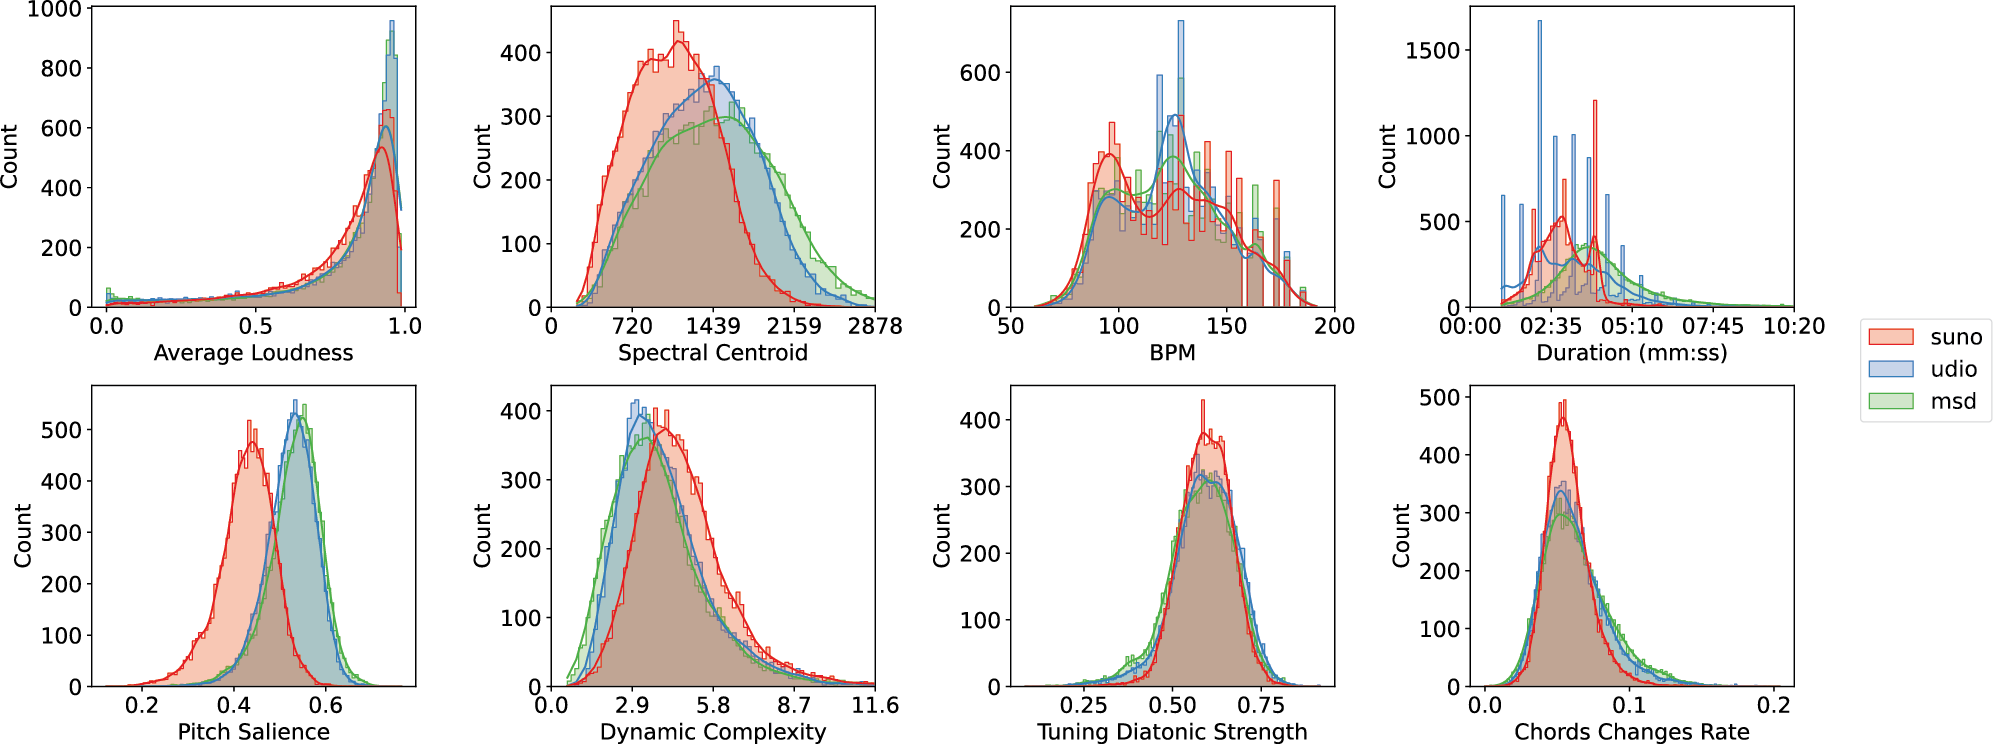
Figure 1
Distributions of selected Essentia descriptors across sources. The mean and standard deviations of these descriptors are provided in Table 1
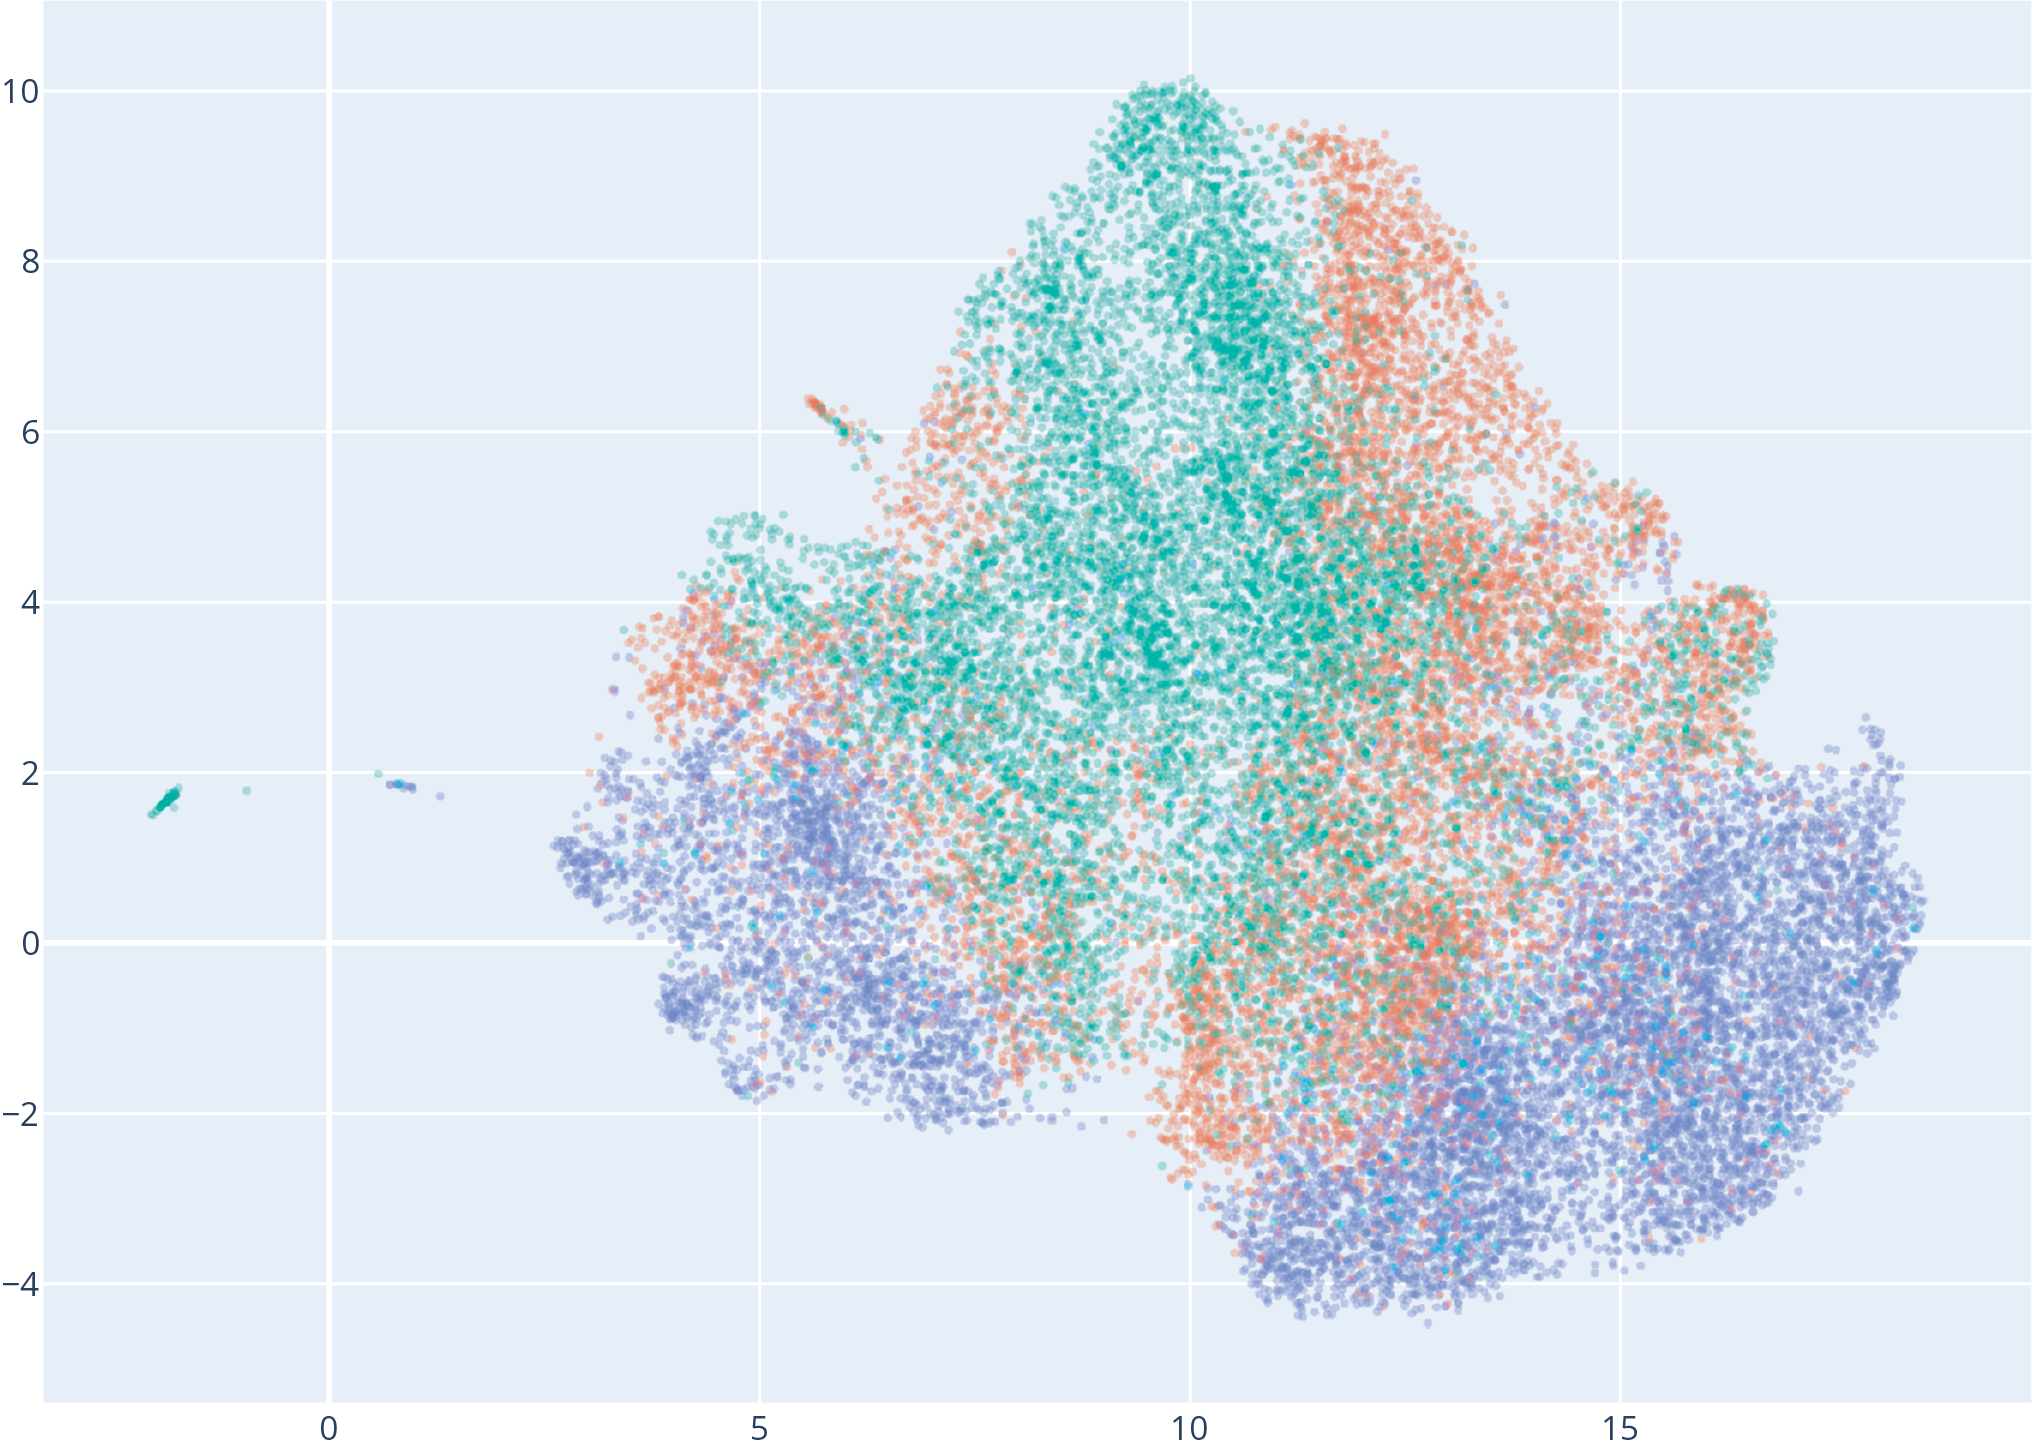
Figure 2
Two‑dimensional UMAP projection of Contrastive Language–Audio Pretraining audio embeddings from our dataset, with color denoting source: Suno (blue), Udio (red), and MSD (green).
Table 2
Parent‑level classification results (AI vs. non‑AI) on the sample set.
| Classifier | Class | Precision | Recall | F1 Score | Support |
|---|---|---|---|---|---|
| SVM | Non‑AI | 0.958 | 0.913 | 0.935 | 150 |
| AI | 0.958 | 0.980 | 0.969 | 300 | |
| RF | Non‑AI | 0.955 | 0.840 | 0.894 | 150 |
| AI | 0.925 | 0.980 | 0.951 | 300 | |
| 5‑NN | Non‑AI | 0.961 | 0.820 | 0.885 | 150 |
| AI | 0.916 | 0.983 | 0.949 | 300 | |
| IRCAM Amplify | Non‑AI | 1.000 | 0.953 | 0.976 | 150 |
| AI | 0.977 | 1.000 | 0.988 | 300 | |
| SpecTTTra | Non‑AI | 0.528 | 0.893 | 0.663 | 150 |
| AI | 0.918 | 0.600 | 0.726 | 300 |
Table 3
Normalized confusion matrices for various classifiers on the sample set, classified at the parent level.
| Predicted True | SVM | RF | 5‑NN | IRCAM Amplify | SpecTTTra | |||||
|---|---|---|---|---|---|---|---|---|---|---|
| Non‑AI | AI | Non‑AI | AI | Non‑AI | AI | Non‑AI | AI | Non‑AI | AI | |
| MSD | 0.913 | 0.087 | 0.840 | 0.160 | 0.820 | 0.180 | 0.953 | 0.047 | 0.893 | 0.107 |
| Suno | 0.007 | 0.993 | 0.000 | 1.000 | 0.000 | 1.000 | 0.000 | 1.000 | 0.047 | 0.953 |
| Udio | 0.033 | 0.967 | 0.040 | 0.960 | 0.033 | 0.967 | 0.000 | 1.000 | 0.753 | 0.247 |
Table 4
Child‑level classification results (MSD, Suno, Udio) on the sample set.
| Classifier | Class | Precision | Recall | F1 Score | Support |
|---|---|---|---|---|---|
| SVM | MSD | 0.951 | 0.907 | 0.928 | 150 |
| Suno | 0.970 | 0.867 | 0.915 | 150 | |
| Udio | 0.815 | 0.940 | 0.873 | 150 | |
| RF | MSD | 0.947 | 0.833 | 0.887 | 150 |
| Suno | 0.943 | 0.767 | 0.846 | 150 | |
| Udio | 0.699 | 0.913 | 0.792 | 150 | |
| 5‑NN | MSD | 0.953 | 0.813 | 0.878 | 150 |
| Suno | 0.714 | 0.980 | 0.826 | 150 | |
| Udio | 0.776 | 0.600 | 0.677 | 150 |
Table 5
Cross‑domain classification results showing performance when training on one AI source plus MSD and testing on another AI source. Results are grouped by classifier type and ordered by F1 score within each group.
| Classifier | Train Test | Precision | Recall | F1 Score |
|---|---|---|---|---|
| SVM | Suno Suno | 0.995 | 0.995 | 0.995 |
| Udio Suno | 0.972 | 0.972 | 0.972 | |
| Udio Udio | 0.971 | 0.971 | 0.971 | |
| Suno Udio | 0.795 | 0.673 | 0.629 | |
| RF | Suno Suno | 0.988 | 0.988 | 0.988 |
| Udio Suno | 0.956 | 0.955 | 0.955 | |
| Udio Udio | 0.949 | 0.948 | 0.948 | |
| Suno Udio | 0.815 | 0.735 | 0.713 | |
| 5‑NN | Suno Suno | 0.985 | 0.985 | 0.985 |
| Udio Suno | 0.943 | 0.940 | 0.940 | |
| Udio Udio | 0.936 | 0.934 | 0.934 | |
| Suno Udio | 0.834 | 0.788 | 0.778 |
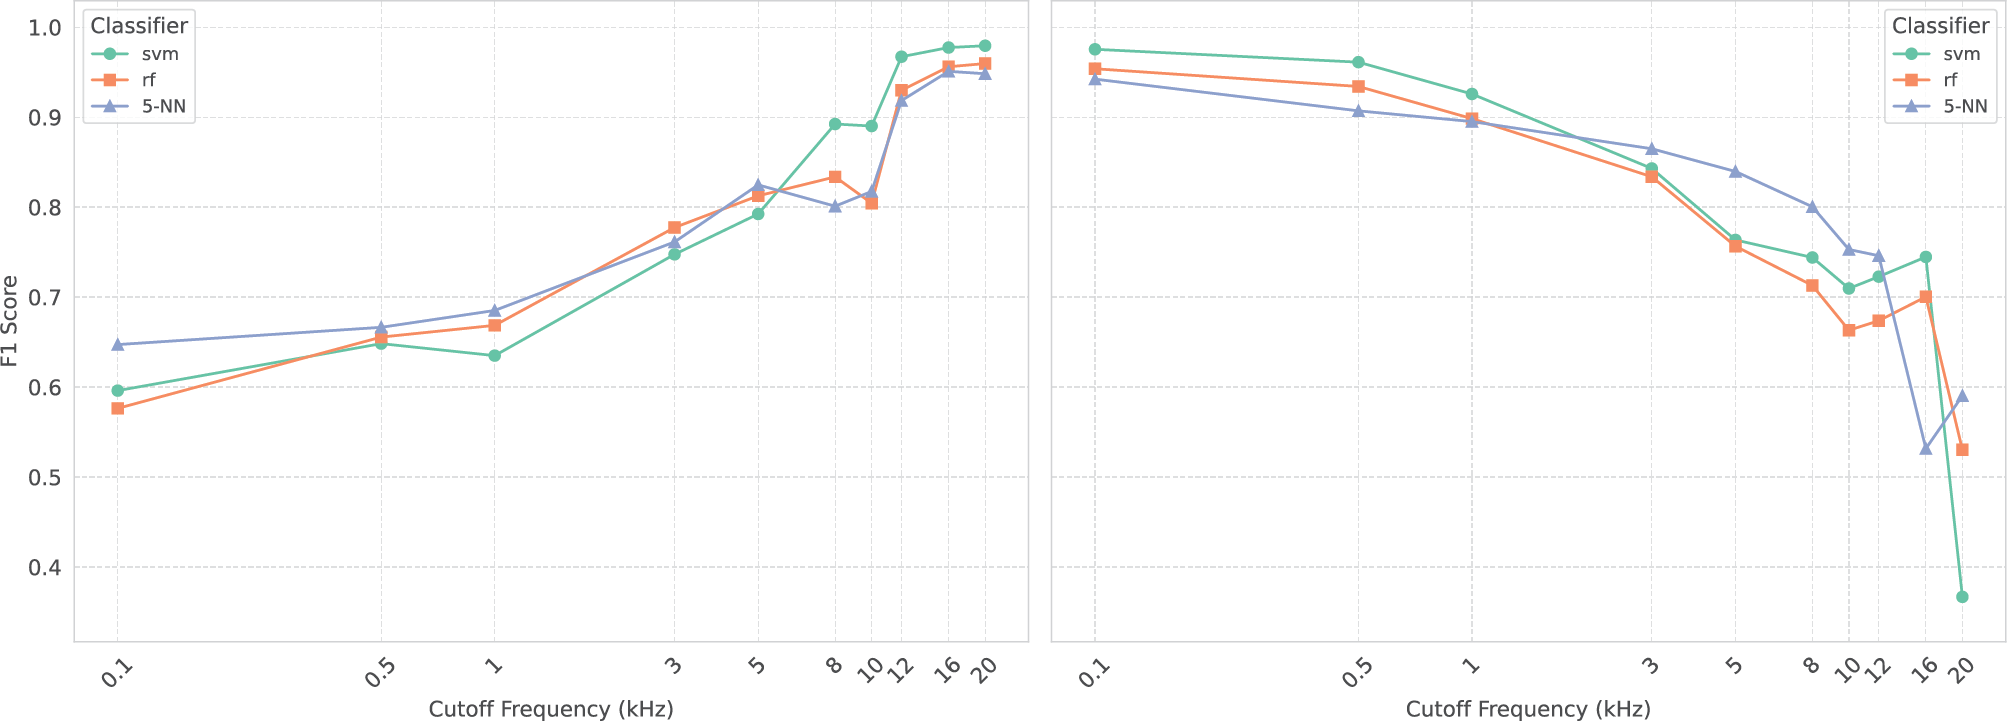
Figure 3
Impact of low‑pass (left) and high‑pass (right) filtering on the test set. This figure shows the F1 scores for three classifiers (support vector machine, random forest, 5‑NN) as a function of cut‑off frequency.
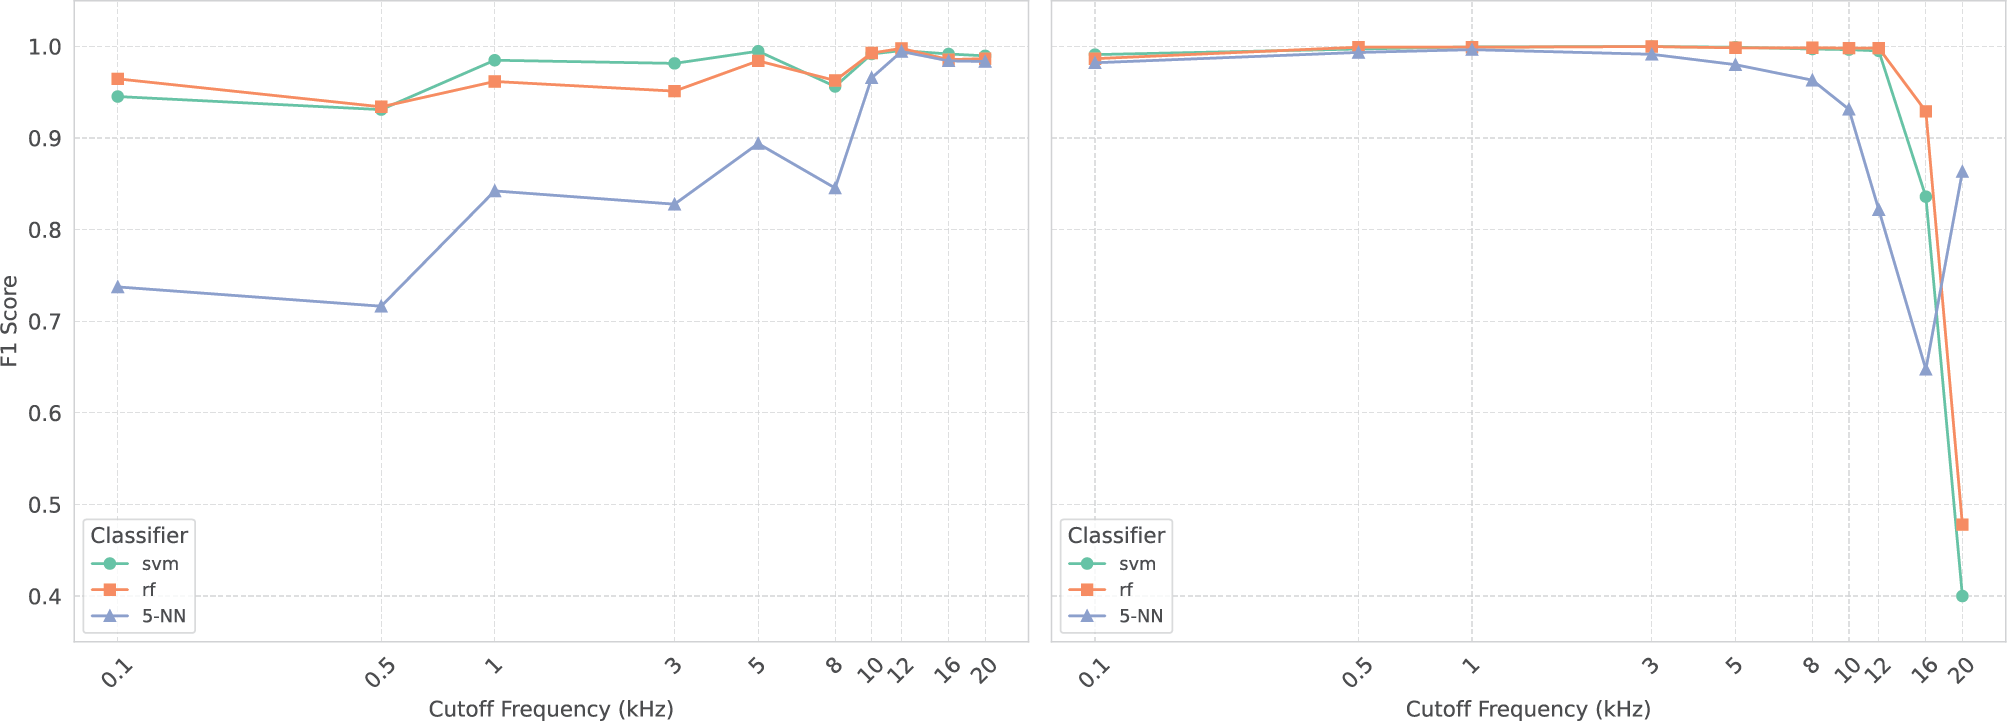
Figure 4
Impact of low‑pass (left) and high‑pass (right) filtering on the Udio test set. This figure shows the F1 scores for three classifiers (support vector machine, random forest, 5‑NN) as a function of cut‑off frequency.
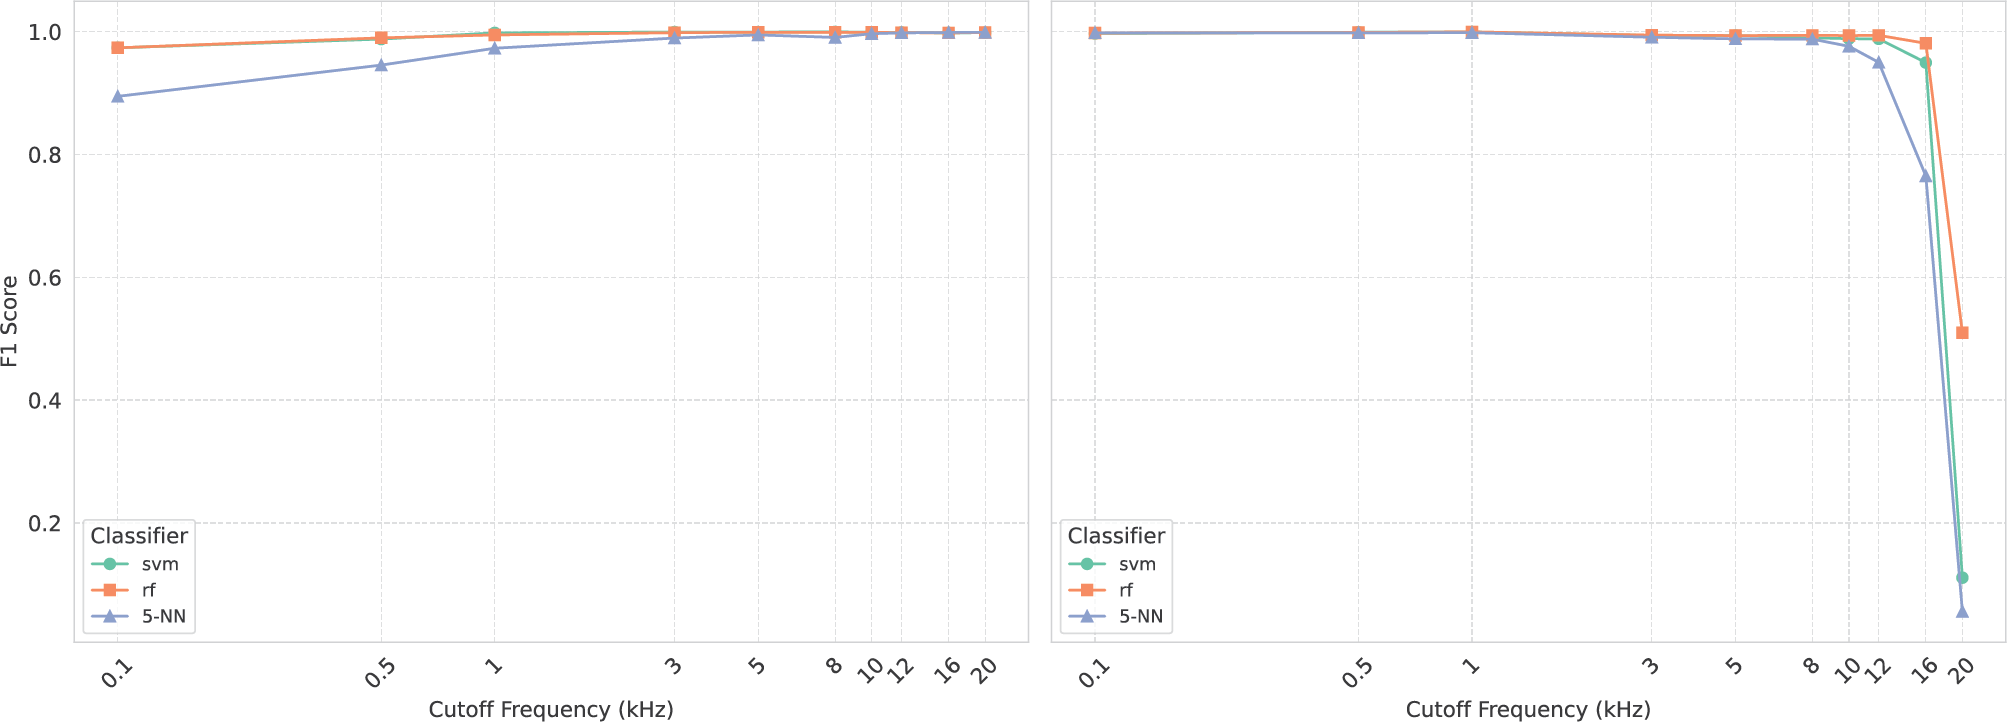
Figure 5
Impact of low‑pass (left) and high‑pass (right) filtering on the Suno test set. This figure shows the F1 scores for three classifiers (support vector machine, random forest, 5‑NN) as a function of cut‑off frequency.
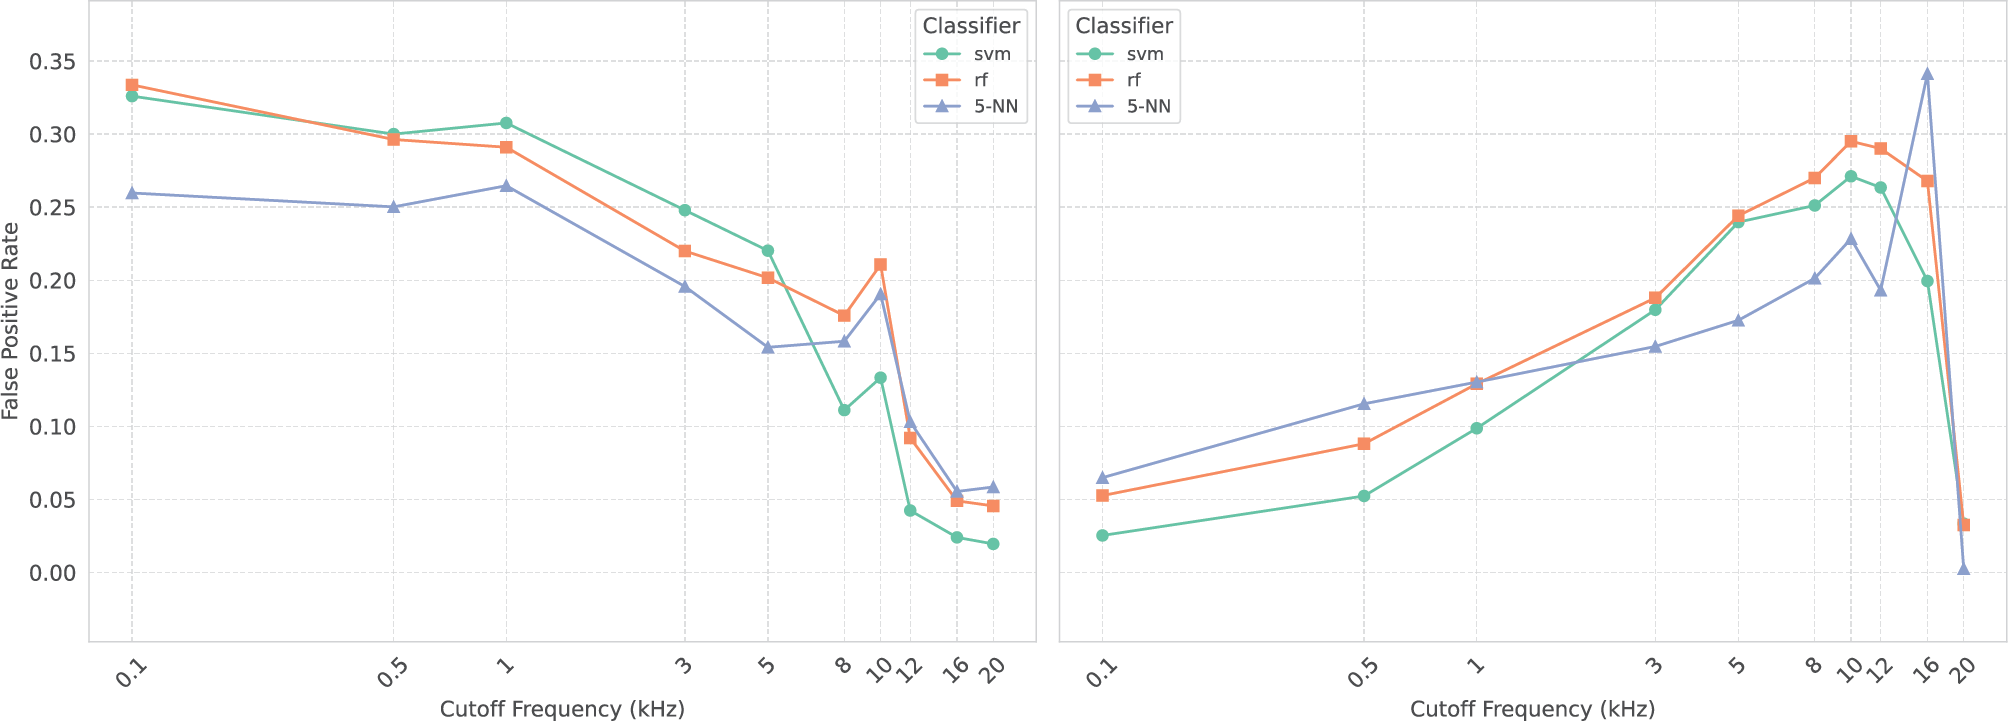
Figure 6
Impact of low‑pass (left) and high‑pass (right) filtering on the Million Song Dataset test set. This figure shows the false‑positive rate for three classifiers (support vector machine, random forest, 5‑NN) as a function of cut‑off frequency.