
Table 1
Overview of recent works on composer classification and the datasets used in these studies. The third column indicates whether the original source data is symbolic, audio, or sheet music images. The fourth column indicates the format of the data after any data format conversions or preprocessing. The fifth column indicates the size of the dataset, where numbers in parentheses indicate unlabeled files for pretraining. For papers that use multiple datasets, we have indicated only the largest.
| Paper | Composers | Original Source Data Type | Preprocessed Data Format | Data Size |
|---|---|---|---|---|
| Wołkowicz and Kešelj (2013) | 5 | symbolic | MIDI | 251 pieces |
| Hontanilla et al. (2013) | 5 | symbolic | MIDI | 274 movements |
| Herlands et al. (2014) | 2 | symbolic | MIDI | 74 movements |
| Hedges et al. (2014) | 9 | symbolic | chords | 5700 lead sheets |
| Herremans et al. (2015) | 3 | symbolic | MIDI | 1045 pieces |
| Saboo et al. (2015) | 2 | symbolic | museData, kern | 366 pieces |
| Brinkman et al. (2016) | 6 | symbolic | no info | no info |
| Velarde et al. (2016) | 2 | symbolic | kern | 107 movements |
| Herremans et al. (2016) | 3 | symbolic | MIDI | 1045 movements |
| Shuvaev et al. (2017) | 31 | audio | audio | 62 hrs |
| Sadeghian et al. (2017) | 3 | symbolic | MIDI | 417 sonatas |
| Takamoto et al. (2018) | 5 | symbolic | MIDI | 75 pieces |
| Hajj et al. (2018) | 9 | symbolic | MIDI | 1197 pieces |
| Velarde et al. (2018) | 5 | symbolic | MIDI, audio (synthesized) | 207 movements |
| Micchi (2018) | 6 | audio | audio | 320 recordings |
| Goienetxea et al. (2018) | 5 | symbolic | kern | 1586 pieces |
| Verma and Thickstun (2019) | 19 | symbolic | kern | 2500 pieces |
| Costa and Salazar (2019) | 3 | symbolic | no info | 10 pieces |
| Kim et al. (2020) | 13 | symbolic | MIDI | 505 pieces |
| Kong et al. (2020) | 100 | audio | MIDI (transcribed) | 10854 pieces |
| Revathi et al. (2020) | 4 | audio | audio | 40 pieces |
| Kempfert and Wong (2020) | 2 | symbolic | kern | 285 movements |
| Chou et al. (2021) | 8 | symbolic | MIDI | 411 pieces |
| Yang and Tsai (2021a) | 9 | sheet music | bootleg score | 787 works (29310 works) |
| Walwadkar et al. (2022) | 9 | sheet music | image, bootleg score | 32k images |
| Deepaisarn et al. (2022) | 5 | symbolic | MIDI | 809 pieces |
| Kher (2022) | 11 | symbolic | MIDI, audio (synthesized) | 110 pieces |
| Foscarin et al. (2022) | 13 | symbolic | MIDI | 667 pieces |
| Li et al. (2023) | 8 | audio | MIDI (transcribed) | 411 pieces |
| Deepaisarn et al. (2023) | 5 | symbolic | MIDI | 809 pieces |
| Simonetta et al. (2023) | 7 | symbolic | MIDI | 211 pieces |
| Zhang et al. (2023) | 9 | symbolic | MIDI, MusicXML | 415 scores |
| PBSCR | 100 | sheet music | bootleg score | 4997 works (29310 works) |
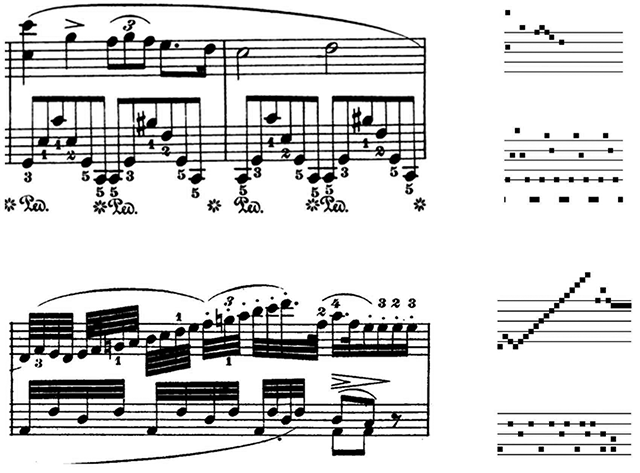
Figure 1
Two examples of a piano sheet music excerpt (left) and corresponding bootleg score representation (right). Staff lines are not encoded in the bootleg score representation itself, but they are overlaid in the examples above as a visual reference.
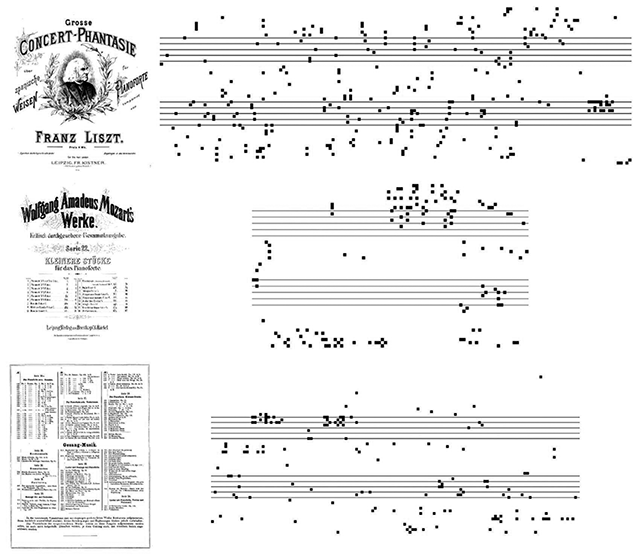
Figure 2
Examples of non-music filler pages and their extracted (gibberish) bootleg scores.
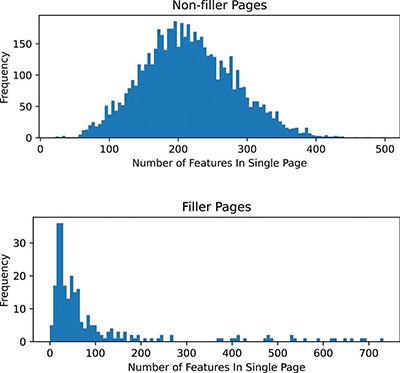
Figure 3
Histogram of the number of bootleg score events in a set of manually labeled music pages (top) and non-music pages (bottom).
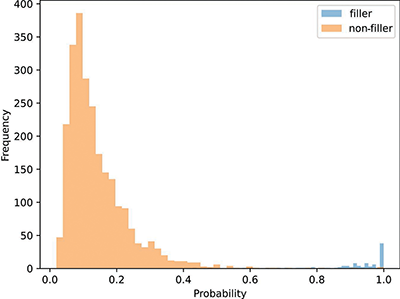
Figure 4
Predicted probability of an ensemble classifier that classifies validation pages as filler (non-music) vs. non-filler. We use a hard threshold of 0.5 to ensure that filler pages are excluded from our dataset with high confidence.
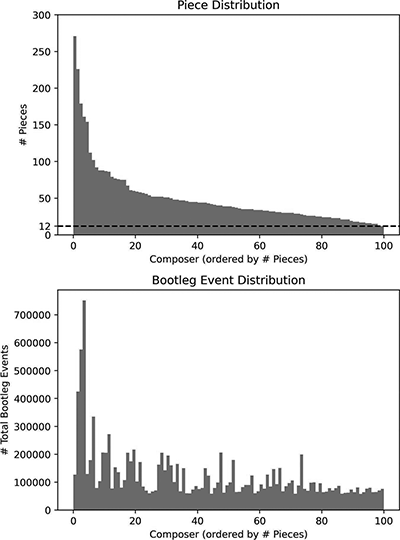
Figure 5
(Top) The total number of pieces/works available on IMSLP for the composers in the 100-class dataset. (Bottom) The total number of bootleg score events for each composer in the 100-class dataset. The list of composers sorted by number of works can be found at https://github.com/HMC-MIR/PBSCR/blob/main/forPaper/composers_sorted_numpieces.txt.
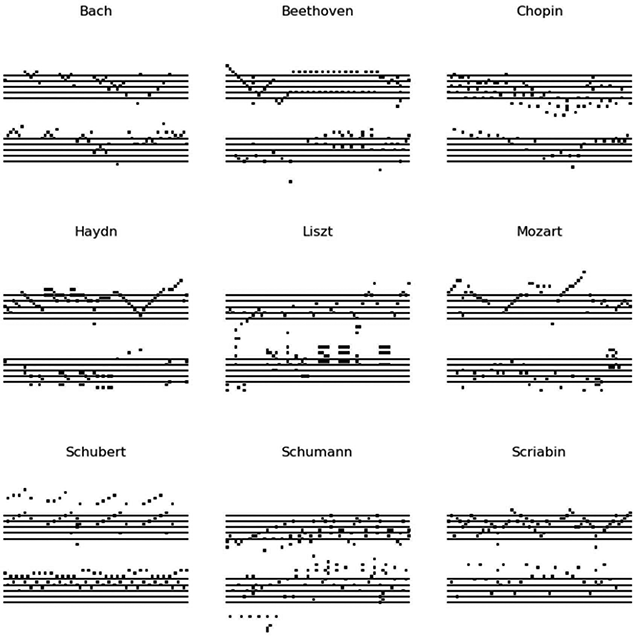
Figure 6
Example bootleg score images from the labeled 9-class PBSCR data. Staff lines have been overlaid for ease of interpretation.
Table 2
Overview of the raw sheet music data from which the 9-class PBSCR data was constructed. Cumulative counts for the 100-class data are also shown at the bottom.
| Composer | # Works | # Pages (all/music) | # Bootleg Features |
|---|---|---|---|
| Bach | 226 | 424,948 | |
| Beethoven | 86 | 272,374 | |
| Chopin | 89 | 205,513 | |
| Haydn | 51 | 50/50 | 12,408 |
| Liszt | 179 | 3405/3170 | 575,367 |
| Mozart | 61 | 702/673 | 174,355 |
| Schubert | 88 | 836/836 | 206,103 |
| Schumann | 40 | 981/919 | 206,379 |
| Scriabin | 76 | 879/825 | 135,851 |
| 9-class | 896 | 10,945/10,305 | 2,213,298 |
| 100-class | 4997 | 70,440/64,129 | 12,108,749 |
Table 3
Baseline results for the 9-class PBSCR task. Results are shown for top-1 accuracy (%) and mean reciprocal rank.
| System | Top 1 | MRR |
|---|---|---|
| CNN | 40.0 | 0.593 |
| GPT-2 (LP-FT) | 49.6 | 0.670 |
| GPT-2 (LP) | 42.5 | 0.613 |
| GPT-2 (no pretrain) | 25.0 | 0.466 |
| RoBERTa (LP-FT) | 44.4 | 0.631 |
| RoBERTa (LP) | 38.0 | 0.581 |
| RoBERTa (no pretrain) | 19.2 | 0.407 |
Table 4
Baseline results for the 100-class PBSCR task. Results are shown for top-1, top-5, and top-10 accuracy (%).
| System | Top 1 | Top 5 | Top 10 |
|---|---|---|---|
| CNN | 7.4 | 21.3 | 32.4 |
| GPT-2 (LP-FT) | 13.9 | 34.8 | 49.0 |
| GPT-2 (LP) | 10.4 | 28.5 | 42.8 |
| GPT-2 (no pretrain) | 3.2 | 11.6 | 20.4 |
| RoBERTa (LP-FT) | 10.6 | 29.0 | 42.0 |
| RoBERTa (LP) | 7.5 | 22.9 | 35.0 |
| RoBERTa (no pretrain) | 2.1 | 8.1 | 15.0 |
Table 5
Baseline results for the -shot 9-class recognition task. Results are expressed as mean and standard deviation across 30 trials. Top-1 accuracies are indicated in percentages (%).
| System | N | Top-1 mean | Top-1 std | MRR mean | MRR std |
|---|---|---|---|---|---|
| GPT-2 | 1 | 15.4 | 2.3 | 0.36 | 0.020 |
| RoBERTa | 1 | 14.5 | 1.8 | 0.35 | 0.017 |
| Random | 1 | 11.2 | 0.3 | 0.32 | 0.003 |
| GPT-2 | 10 | 19.7 | 1.8 | 0.41 | 0.013 |
| RoBERTa | 10 | 19.8 | 1.6 | 0.41 | 0.013 |
| Random | 10 | 11.0 | 0.4 | 0.31 | 0.003 |
| GPT-2 | 100 | 23.8 | 0.8 | 0.45 | 0.006 |
| RoBERTa | 100 | 23.7 | 0.9 | 0.45 | 0.006 |
| Random | 100 | 11.1 | 0.4 | 0.31 | 0.004 |
Table 6
Baseline results for the N-shot 100-class recognition task. Results are expressed as a mean and a standard deviation across 30 trials.
| System | N | Top-1mean | Top-1std | Top-5mean | Top-5std | Top-10mean | Top-10std |
|---|---|---|---|---|---|---|---|
| GPT-2 | 1 | 1.9 | 0.21 | 7.7 | 0.44 | 14.1 | 0.56 |
| RoBERTa | 1 | 1.8 | 0.20 | 7.7 | 0.45 | 14.1 | 0.57 |
| Random | 1 | 1.0 | 0.06 | 5.0 | 0.13 | 10.0 | 0.21 |
| GPT-2 | 10 | 3.0 | 0.25 | 11.2 | 0.38 | 19.1 | 0.50 |
| RoBERTa | 10 | 3.1 | 0.19 | 11.3 | 0.39 | 19.3 | 0.54 |
| Random | 10 | 1.0 | 0.10 | 5.0 | 0.15 | 10.0 | 0.23 |
| GPT-2 | 100 | 3.9 | 917 | 14.2 | 0.30 | 23.5 | 0.41 |
| RoBERTa | 100 | 4.0 | 0.14 | 14.3 | 0.27 | 23.7 | 0.34 |
| Random | 100 | 1.0 | 0.07 | 5.0 | 0.16 | 10.0 | 0.21 |