

Figure 1
Statistics of movies in CDXDB23.
Table 1
Final Leaderboard A (models trained only on DnR; top 5).
| Rank | Participant | Global SDR (dB) | Submissions to Ldb A | |||||
| Mean | Dialogue | Effects | Music | 1st phase | 2nd phase | |||
| Submissions | ||||||||
| 1. | aim-less | –4.345 | 7.981 | 1.217 | 3.837 | 36 | 32 | Code8 |
| 2. | mp3d | –4.237 | 8.484 | 1.622 | 2.607 | – | 42 | Code9 |
| 3. | subatomicseer | –4.144 | 7.178 | 2.820 | 2.433 | 65 | 22 | Code10 |
| 4. | thanatoz | –3.871 | 8.948 | 1.224 | 1.442 | 21 | 22 | |
| 5. | kuielab | –3.537 | 7.687 | 0.449 | 2.474 | 36 | 15 | |
| Baseline | ||||||||
| Scaled Identity | –0.019 | 1.562 | –1.236 | –0.383 | ||||
| Cocktail-Fork (Petermann et al., 2022) | –2.491 | 7.321 | –1.049 | 1.200 | ||||
Table 2
Final Leaderboard B (models trained on any data; top 5).
| Rank | Participant | Global SDR (dB) | Submissions to Ldb A + B | |||||
| Mean | Dialogue | Effects | Music | 1st phase | 2nd phase | |||
| Submissions | ||||||||
| 1. | JusperLee | 8.181 | 14.619 | 3.958 | 5.966 | 42 | 102 | |
| 2. | Audioshake | 8.077 | 14.963 | 4.034 | 5.234 | – | 197 | |
| 3. | ZFTurbo | 7.630 | 14.734 | 3.323 | 4.834 | 25 | 131 | Code11 |
| 4. | aim-less | 4.345 | 17.981 | 1.217 | 3.837 | 36 | 153 | Code8 |
| 5. | mp3d | 4.237 | 18.484 | 1.622 | 2.607 | – | 148 | Code9 |
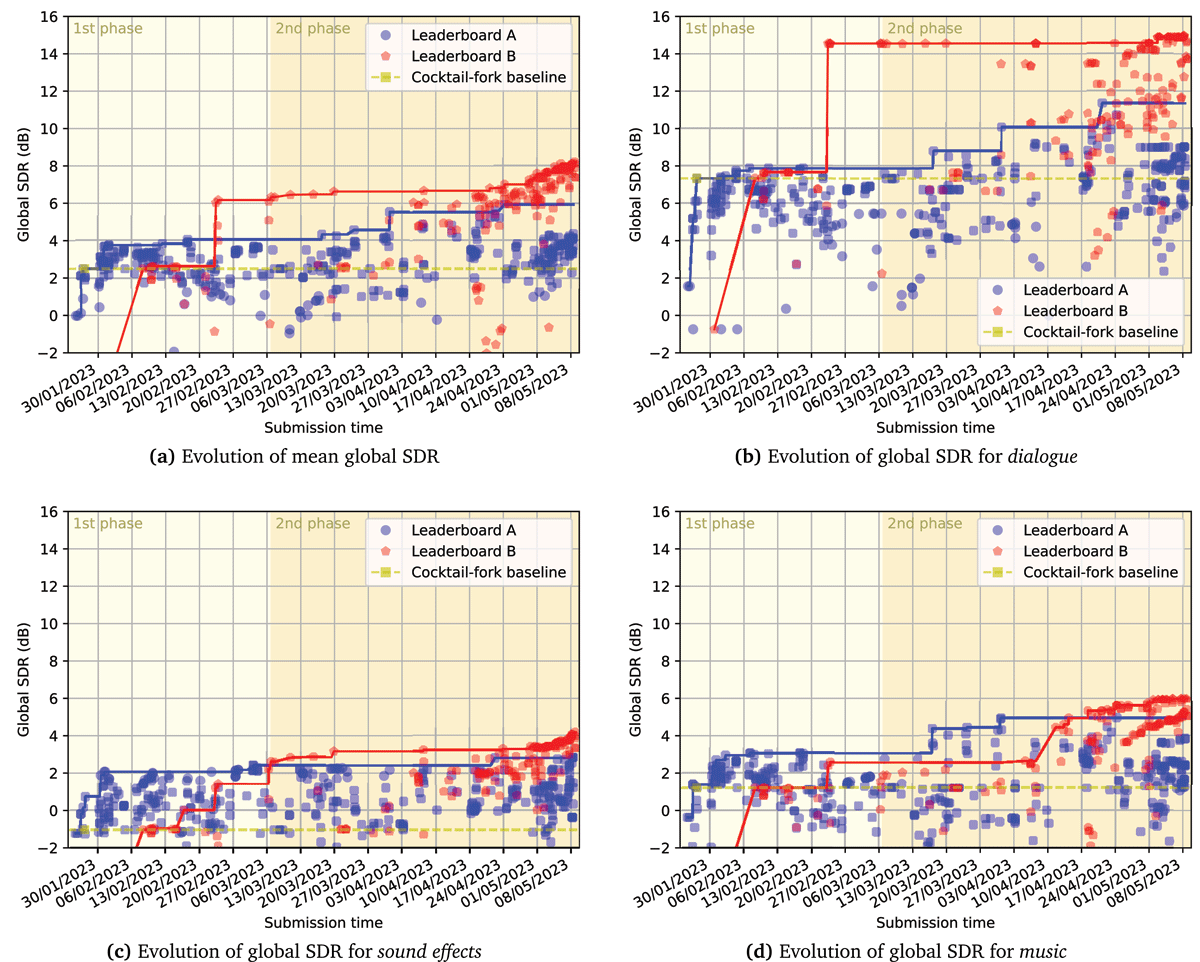
Figure 2
Performance of submissions on full CDXDB23 over time.
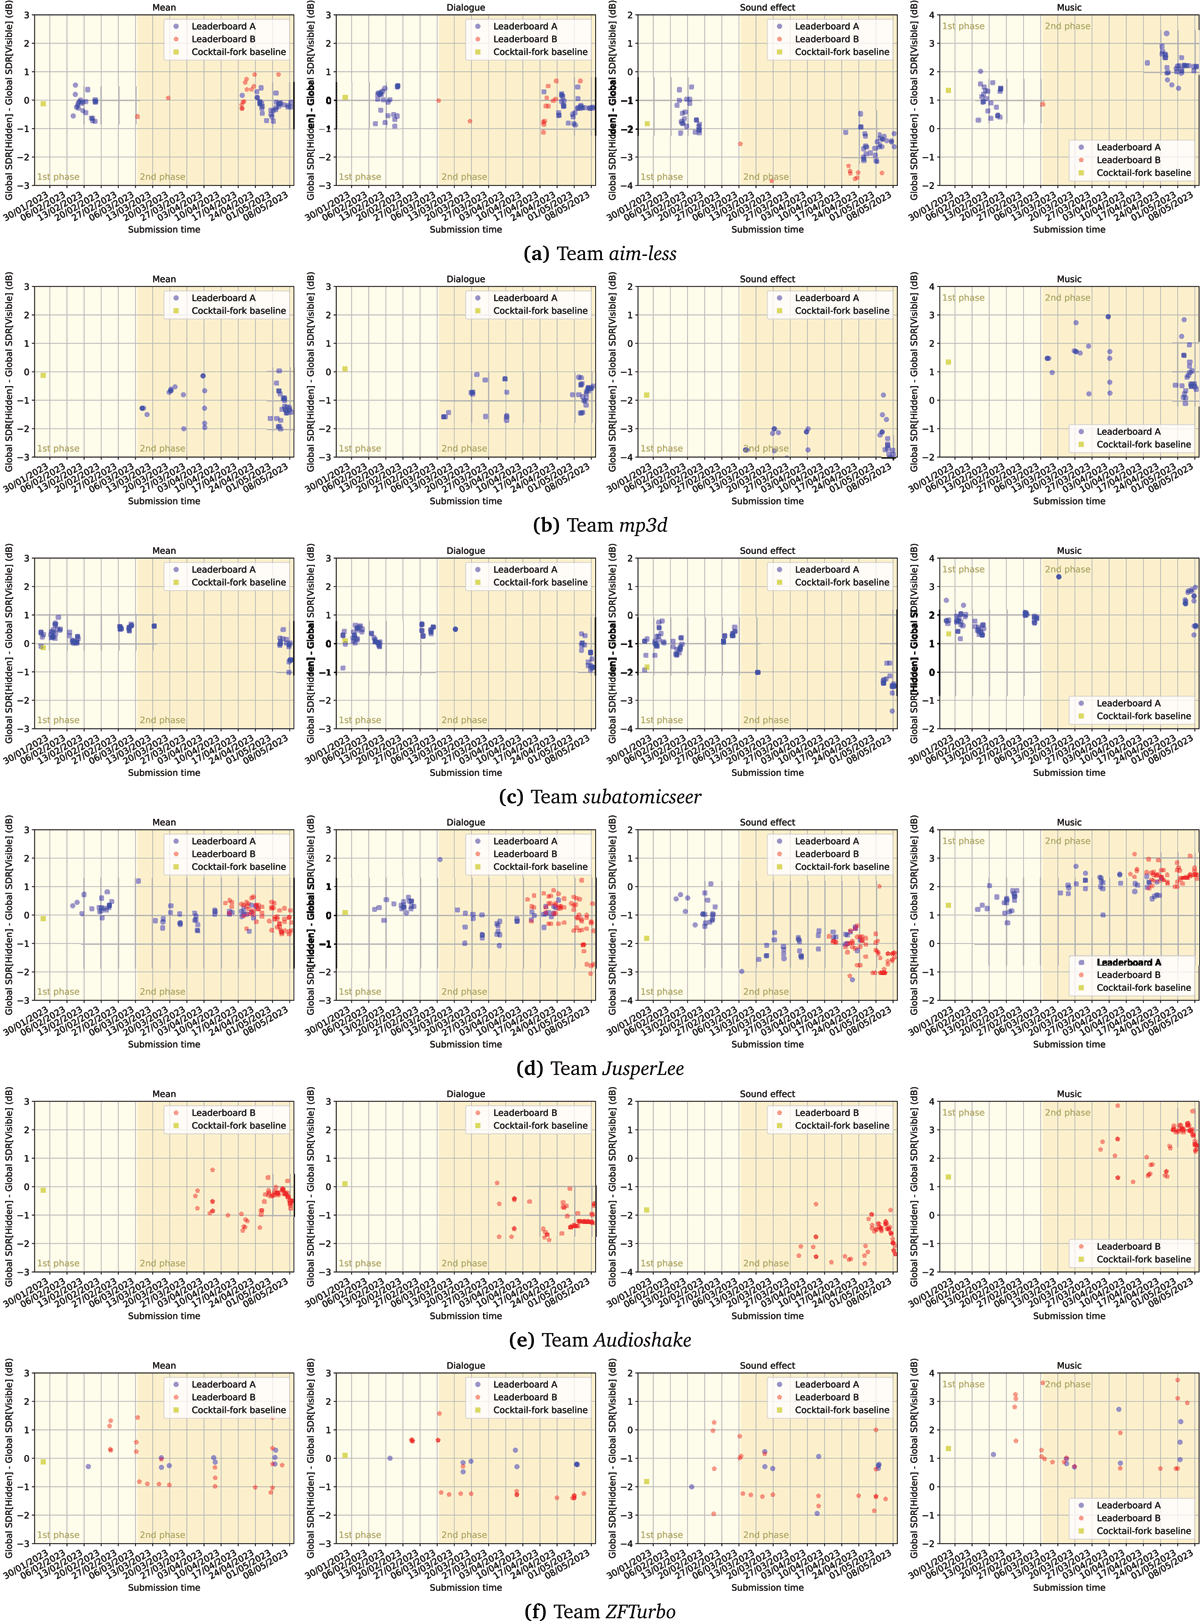
Figure 3
Analysis of overfitting of global SDR. The y-axis shows the difference between global SDR on the hidden test set and global SDR displayed to the participants (trajectories with negative slope indicate overfitting).
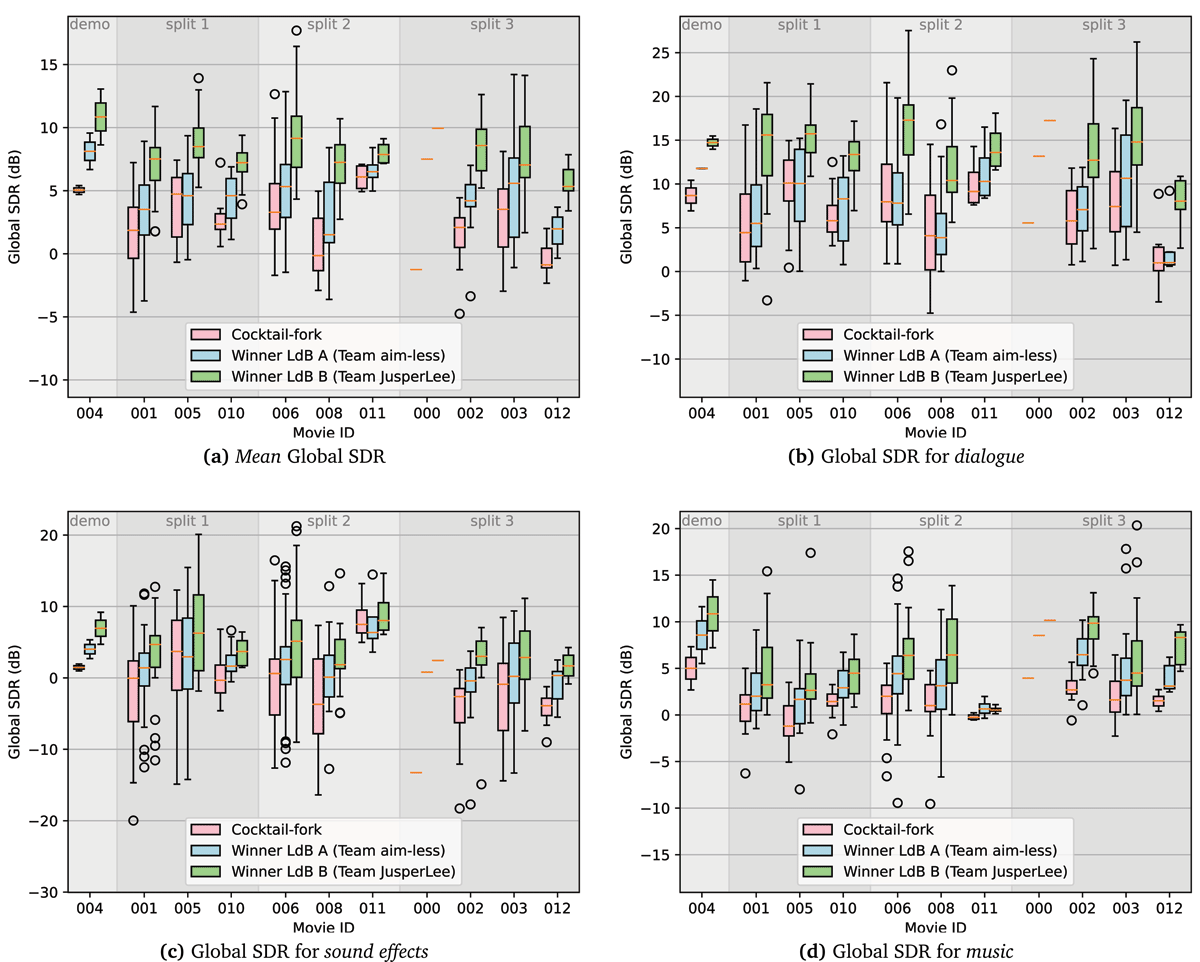
Figure 4
Comparison of the cocktail-fork baseline with winning submissions on both leaderboards for individual movies. For movie “000”, we only have one clip and, hence, the box plot collapses to a horizontal line. Circles represent outliers that are outside the whiskers of the boxplot.
Table 3
Comparison of 2-stem and 3-stem HT demucs models trained on DnR and evaluated on CDXDB23 (Team ZFTurbo).
| Model | Global SDR (dB) | |||
| Mean | Dialogue | Effects | Music | |
| HT demucs trained on 2-stem mix | 7.560 | 14.532 | 3.355 | 4.794 |
| HT demucs trained on 3-stem mix | 6.692 | 14.530 | 3.277 | 2.269 |
| Ensemble of 2- and 3-stem HT demucs | 7.630 | 14.734 | 3.323 | 4.834 |
Table 4
Comparison of single model HT demucs with final ensemble model (Team ZFTurbo).
| Model | Global SDR on val1 (dB) | Global SDR on val2 (dB) | Global SDR on CDXDB23 (dB) | |||||||||
| Mean | Dialogue | Effects | Music | Mean | Dialogue | Effects | Music | Mean | Dialogue | Effects | Music | |
| HT demucs (single) | 6.387 | 13.887 | 2.781 | 2.494 | 9.634 | 14.151 | 7.740 | 7.012 | 2.602 | 16.650 | 0.648 | 0.507 |
| CDX23 best ensemble model | 8.922 | 14.927 | 3.780 | 8.060 | 7.585 | 19.949 | 6.377 | 6.429 | 7.630 | 14.734 | 3.323 | 4.834 |

Figure 5
SDR dependencies on the input volume in LUFS for music, dialogue, and effects. A solid line shows SDR values on RED; crosses mark SDR on CDXDB23. Horizontal dashed and dotted lines show SDR for models without converting the volume of the input signal. The MRX model is blue, MRX-C is orange, MRX-C with a Wiener filter is green, and MRX-C with post-processing scaling is red. In the case of testing MRX-C scaling on the CDXDB23, the SDR values are only available for effects (Team mp3d).
Table 5
SDR values obtained during testing on RED for MRX, MRX-C, MRX-C with Wiener filter, and MRX-C with scaling. SDR values from the table are maximum possible values from all input volumes (Team mp3d).
| Model | Global SDR (dB) | |||
| Mean | Dialogue | Effects | Music | |
| MRX | 4.38 | 8.38 | 1.72 | 3.02 |
| MRX-C | 4.36 | 8.48 | 1.62 | 2.99 |
| MRX-C Wiener | 4.57 | 8.75 | 1.90 | 3.07 |
| MRX-C scaling | 4.24 | 7.92 | 1.95 | 2.85 |
Table 6
Loudness and Dynamic Range Compression (DRC) statistics for DnR and CDXDB23.
| Divide and Remaster (DnR) | CDXDB23 | |||||
| Dialogue | Effects | Music | Dialogue | Effects | Music | |
| Loudness (LUFS) | –24.4 ± 1.3 | –29.7 ± 1.9 | –31.4 ± 1.8 | –28.4 ± 3.1 | –33.9 ± 8.0 | –33.6 ± 7.1 |
| DRC (dB) | –10.7 ± 0.9 | –5.1 ± 2.4 | –12.6 ± 1.4 | –11.4 ± 1.3 | –10.6 ± 3.7 | –11.2 ± 2.3 |
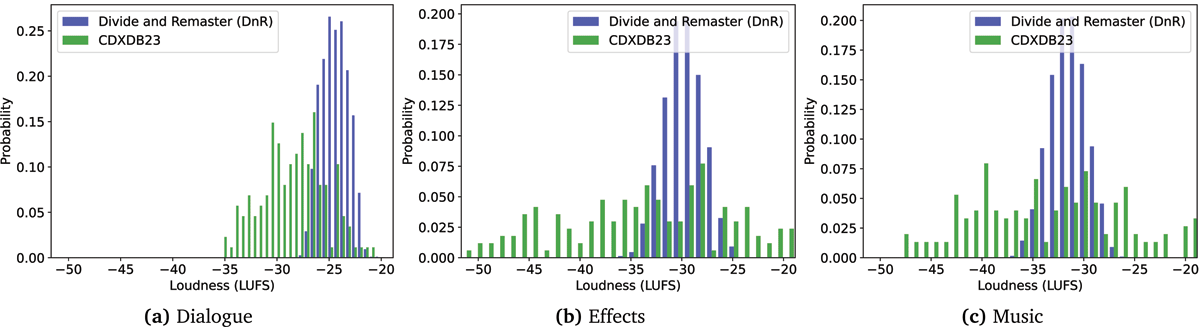
Figure 6
Comparison of loudness between DnR and CDXDB23.

Figure 7
Comparison of average equalization between DnR and CDXDB23. Dashed curves give one standard deviation above/below average.
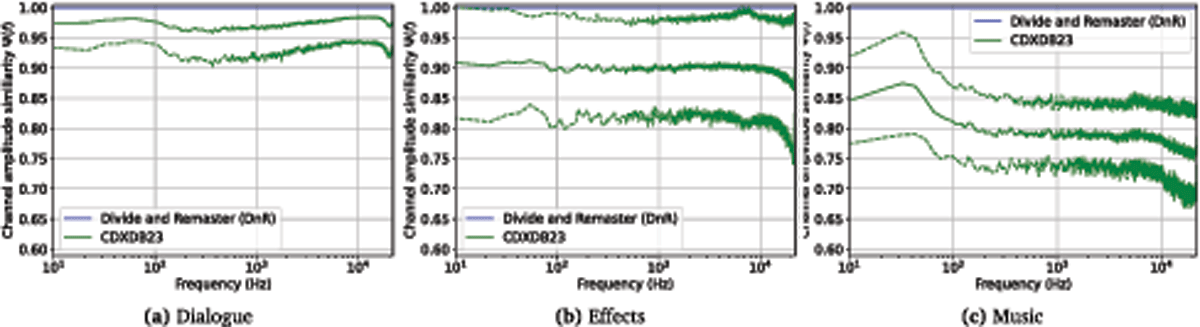
Figure 8
Figure 8: Comparison of average amplitude panning between DnR and CDXDB23. Channel amplitude similarity can take values where refers to panning frequency f to the center whereas denotes a panning to either side. Dashed curves give one standard deviation above/below average. Please note that DnR is monaural and, hence, collapses to a horizontal line at .
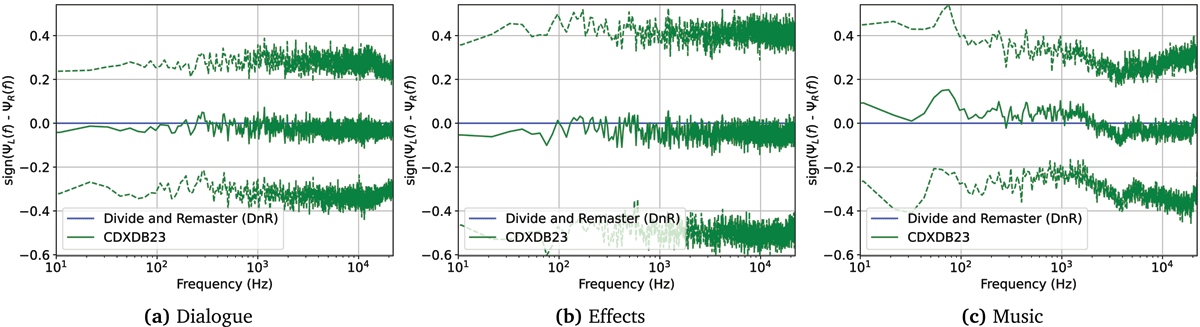
Figure 9
Figure 9: Comparison of average amplitude panning between DnR and CDXDB23. denotes the panning direction where refers to panning to the left and to a panning to the right. Dashed curves give one standard deviation above/below average. Please note that DnR is monaural and, hence, Δ(f) collapses to a horizontal line at .
Table 7
Results on CDXDB23 for training the cocktail-fork model with adjusted DnR versions where we matched either the average loudness or the average equalization from CDXDB23. “Input norm” refers to the loudness normalization to -27 LUFS introduced with version 1.1 of the cocktail-fork model.
| Training Dataset | Global SDR w/o input norm (dB) | Global SDR w/ input norm (dB) | ||||||
| Mean | Dialogue | Effects | Music | Mean | Dialogue | Effects | Music | |
| DnR | –0.104 | 4.108 | –2.018 | –2.401 | 0.325 | 4.662 | –1.979 | –1.707 |
| DnR w/ adapted loudness | 1.287 | 6.535 | –1.506 | –1.168 | 1.539 | 6.727 | –1.278 | –0.832 |
| DnR w/ adapted equalization | 0.176 | 4.621 | –1.470 | –2.623 | 0.544 | 4.922 | –1.212 | –2.078 |