
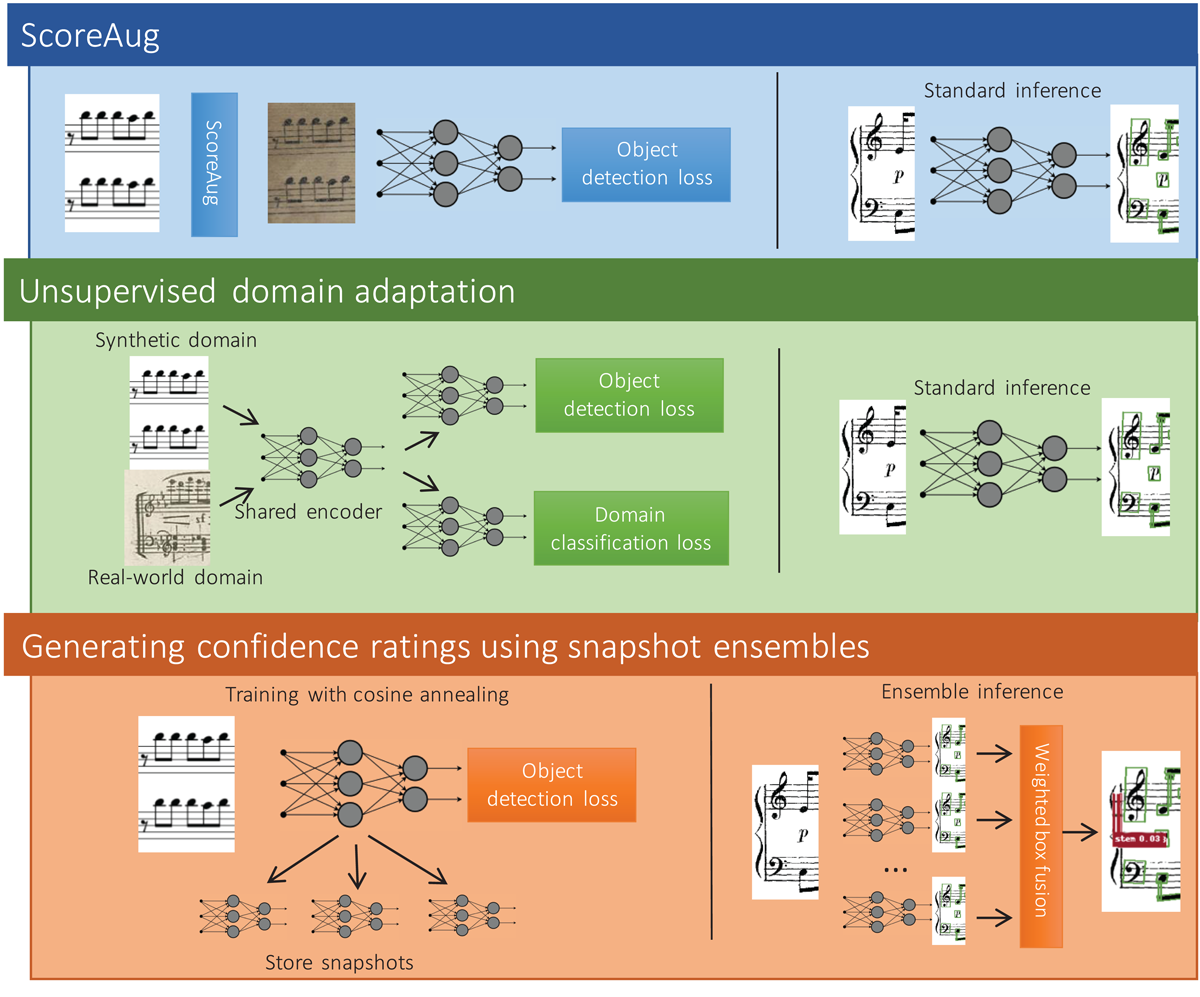
Figure 1
Graphical overview of the methods we contribute. ScoreAug (Section 5.1) in the top row, unsupervised domain adaptation (Section 5.2) in the center and snapshot-ensemble-based confidence ratings (Section 5.3) at the bottom.
Table 1
The AP at 0.5 overlap for our baseline model and two state-of-the-art models (DWD, Faster R-CNN (Tuggener et al., 2021)) on DeepscoresV2.
| DeepscoresV2 dataset | |
| Model | AP (overlap = 0.50) |
| Baseline model | 89.3% |
| DWD | 50.3% |
| Faster R-CNN | 79.9% |
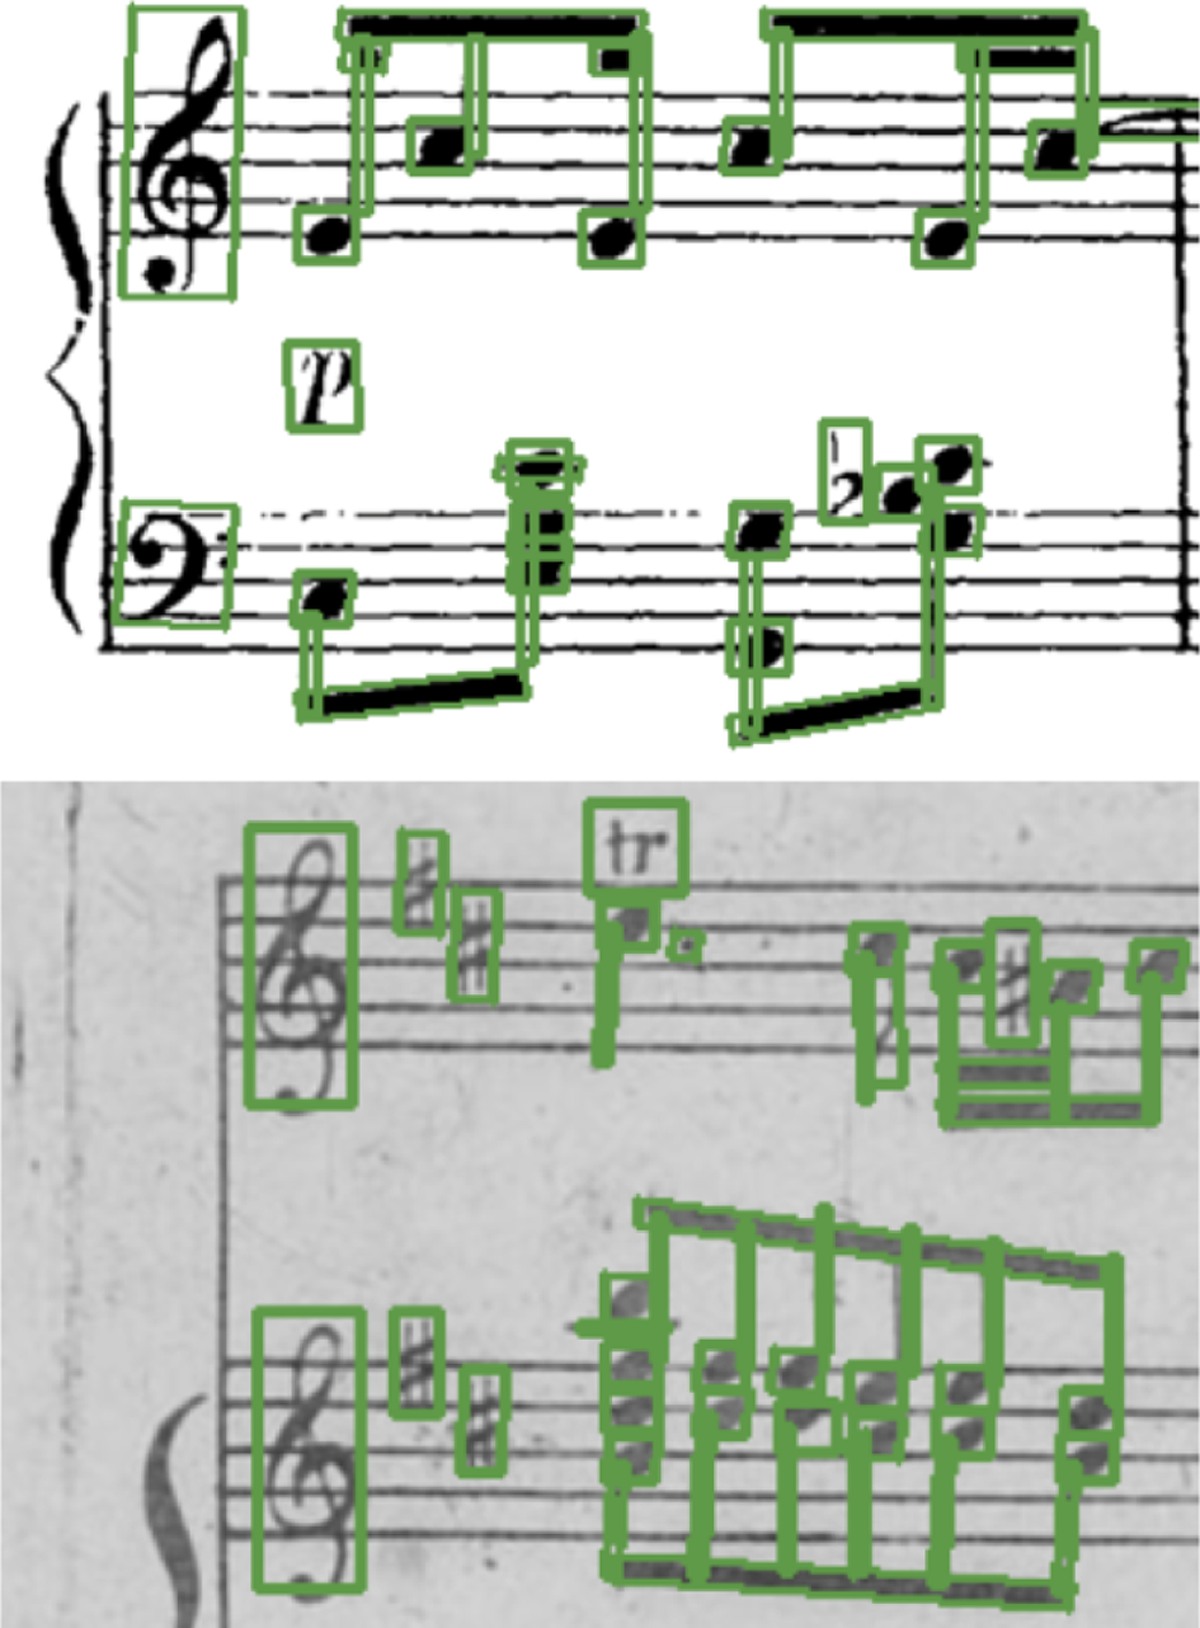
Figure 2
Example snippets from two RealScores pages with ground truth annotations overlayed.
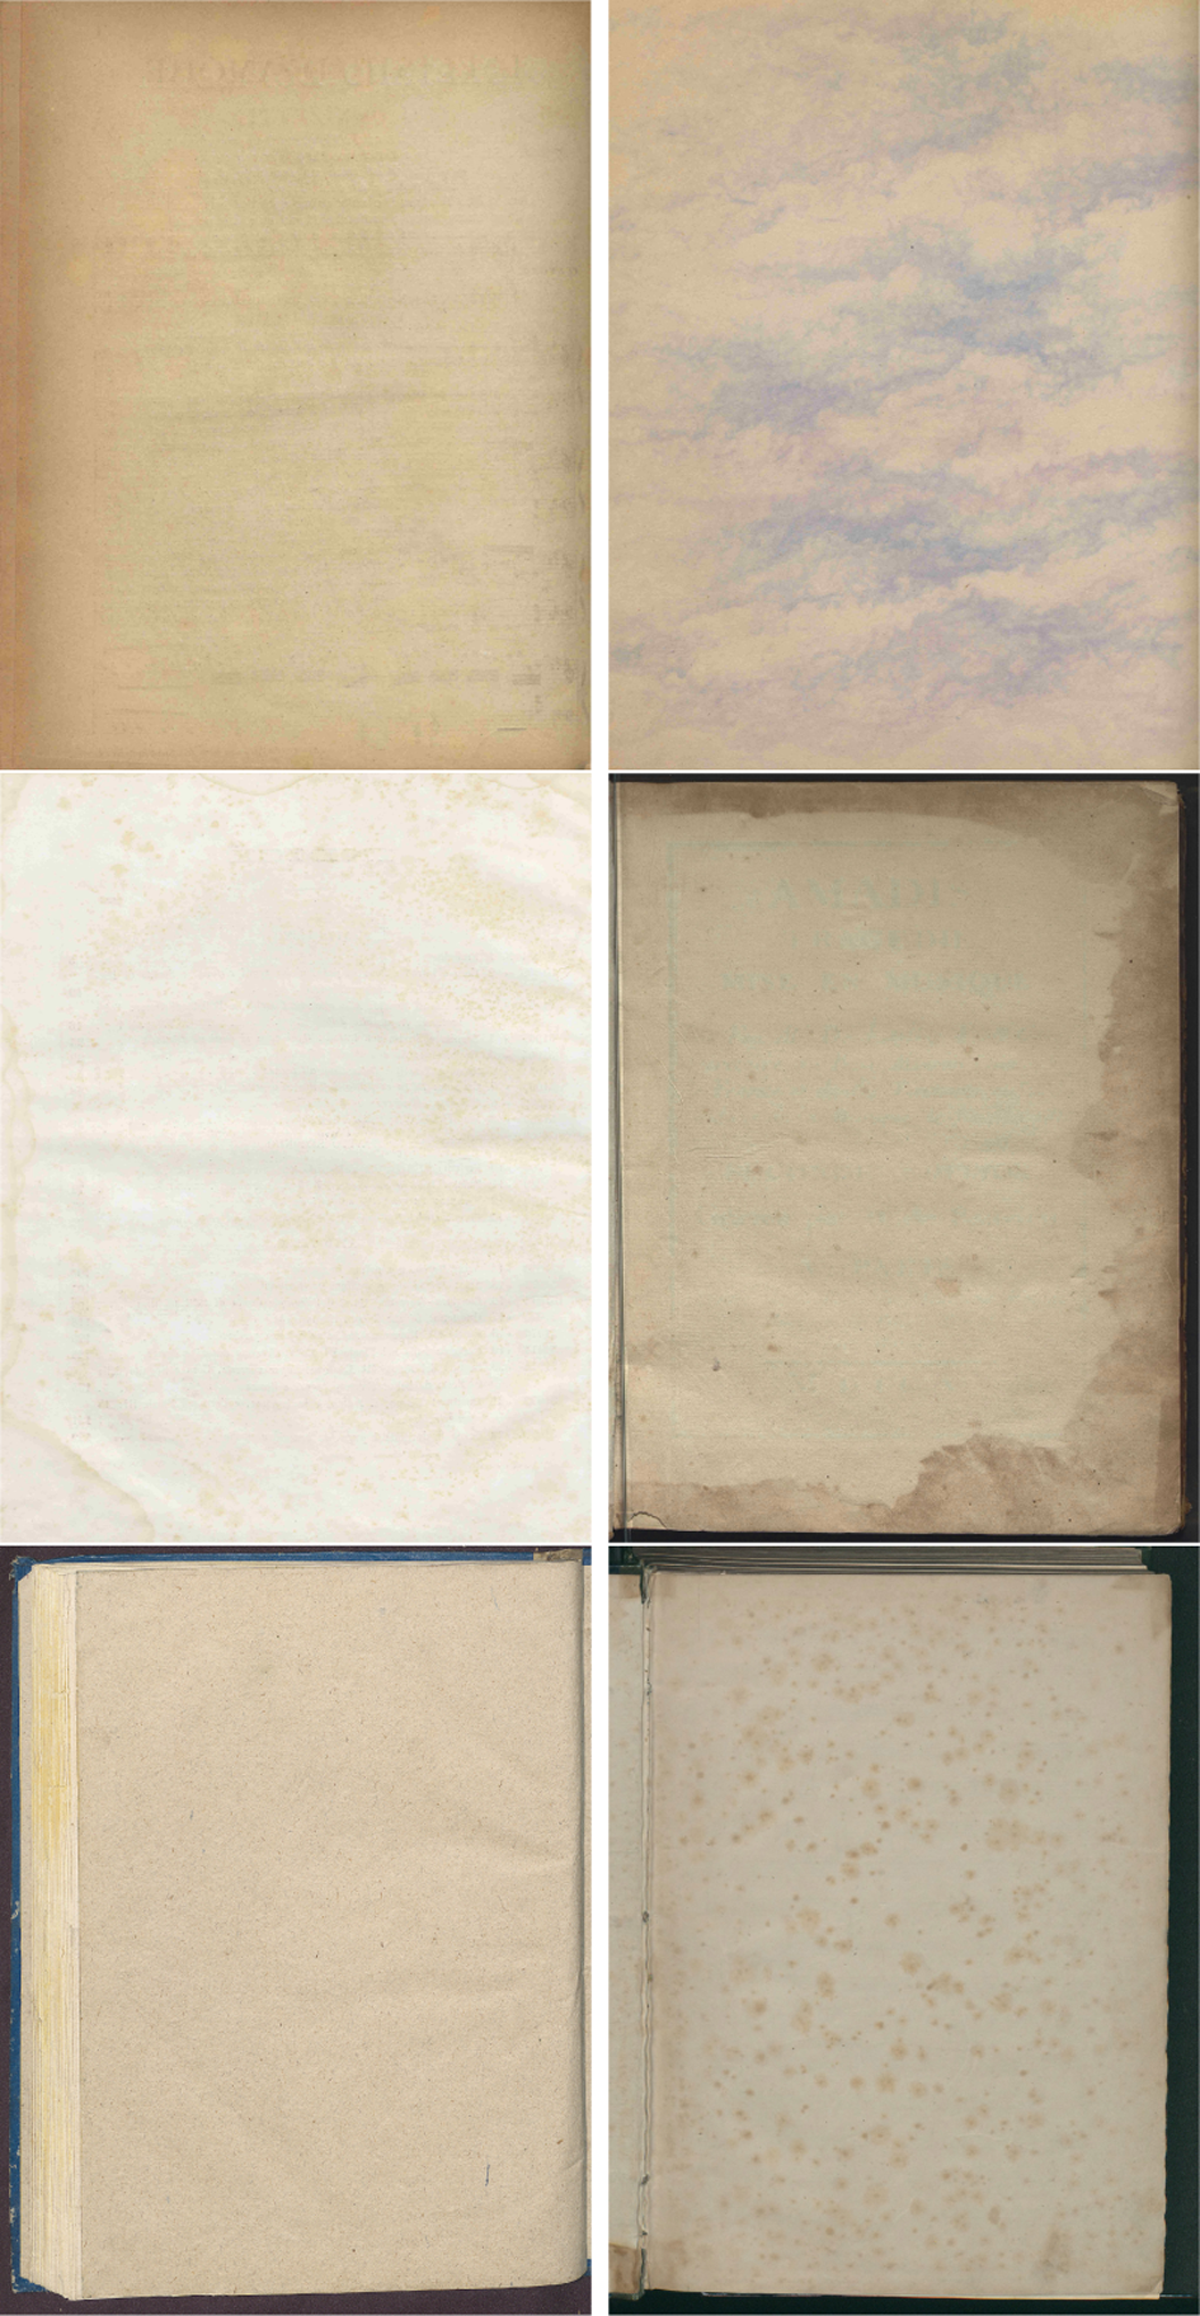
Figure 3
Example blank pages.
Table 2
Probabilities of augmentations as part of ScoreAug that can be applied to either the blanks, synthetic scores, or both at the same time. Note that Paug decides how likely any other augmentations (after the salt and pepper noise) will be applied, in order to not only feed ScoreAugmented samples to the model. Our final model uses Psnp = 0%, Paug = 30%, Pblur = 10%.
| Blanks | Scores | |
| Salt and Pepper Noise | – | Psnp |
| No Additional Augmentations | – | Paug |
| Horizontal Flip | 50% | – |
| Vertical Flip | 50% | – |
| Crop and Resize | 20% | – |
| Randomise Brightness | 50% | – |
| Higher Contrast | – | 20% |
| Small Angle Rotation | 60% | 60% |
| Additional Brightness | – | 40% |
| Gaussian Blur | – | Pblur |
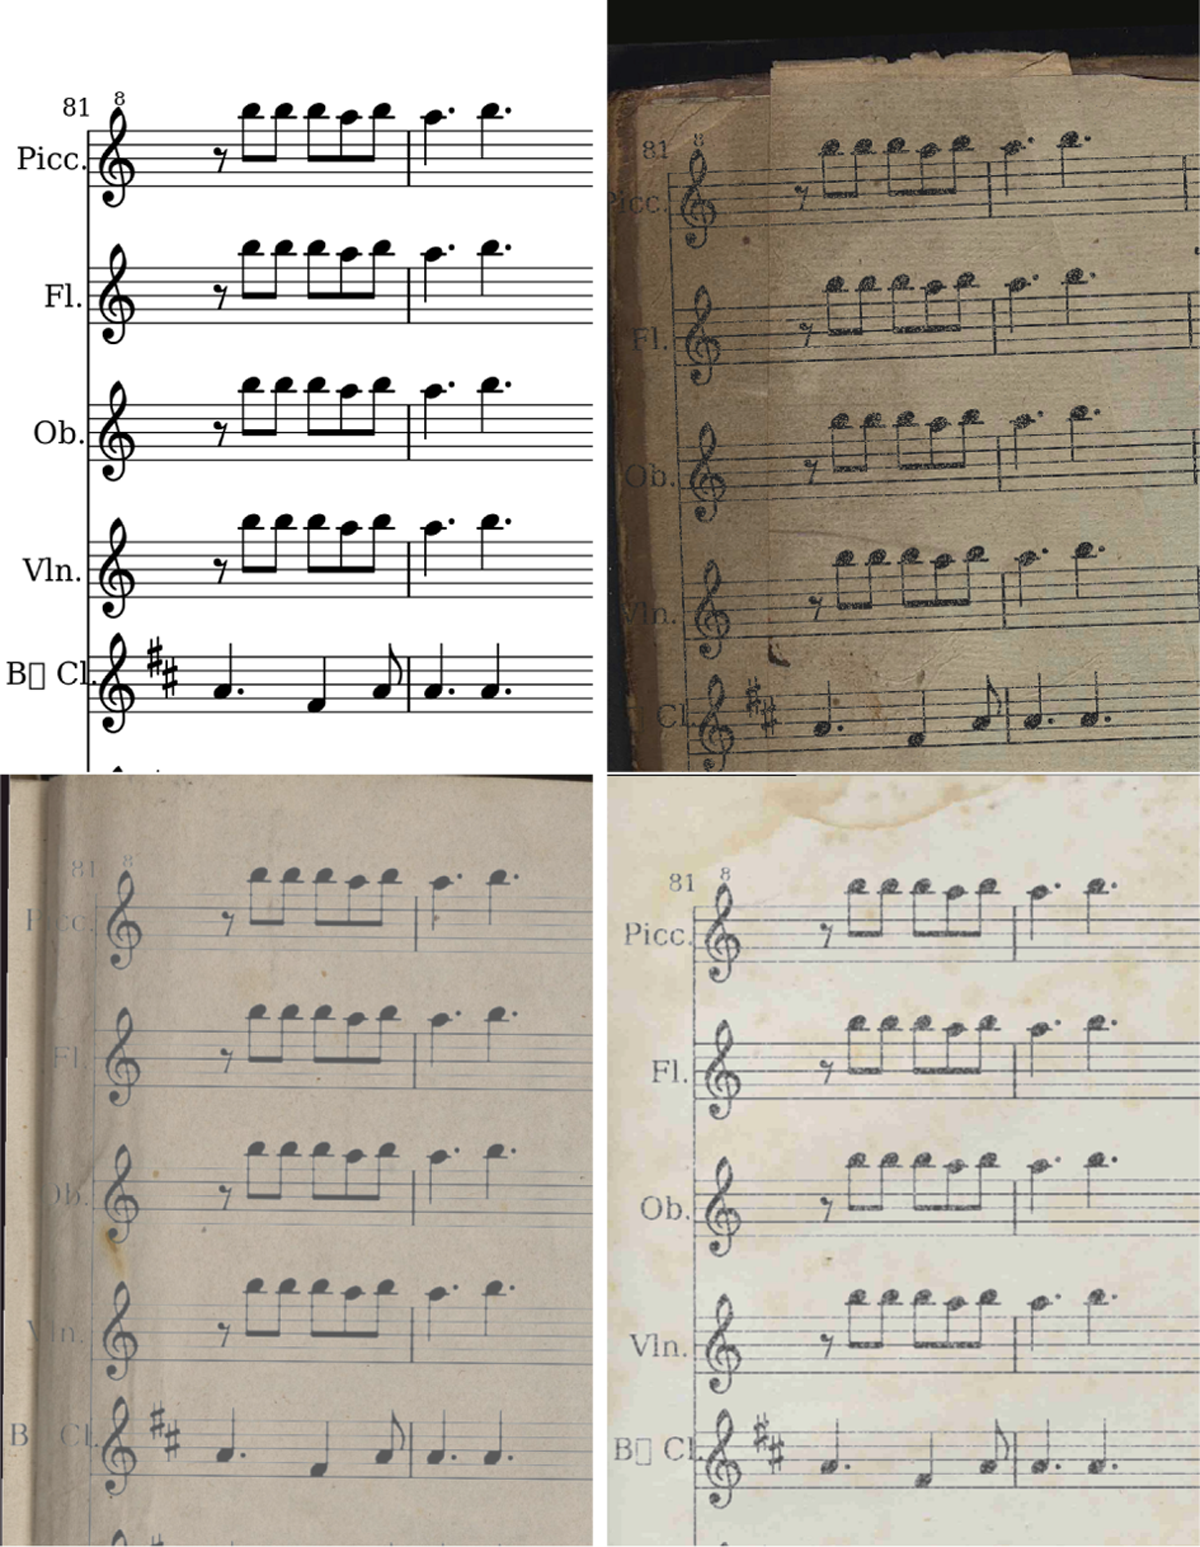
Figure 4
ScoreAug examples (top right, bottom row) derived from the same synthetic sample (top left).
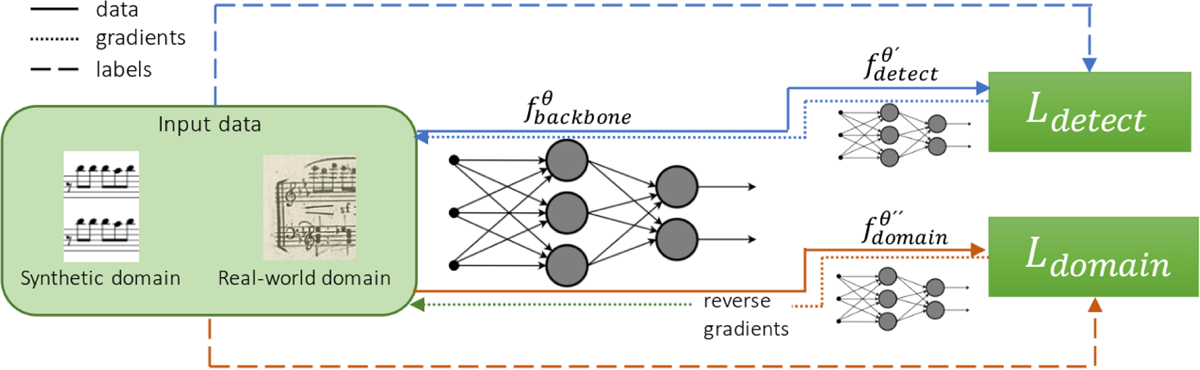
Figure 5
Overview of our UDA system, with data, gradient, and label flow of step (I) shown in orange, of step (II) in green and of step (III) in blue.
Table 3
The AP for the baseline model and models with ScoreAug and Finalise data augmentation on the DeepScoresV2 and the RealScores datasets.
| DeepScoresV2 dataset | |
| Model | AP (overlap = 0.25) |
| Baseline | 87.6% |
| ScoreAug | 86.0% |
| ScoreAug + Finalise | 83.3% |
| RealScores dataset | |
| Model | AP (overlap = 0.25) |
| Baseline | 36.0% |
| ScoreAug | 56.5% |
| ScoreAug + Finalise | 73.7% |
Table 4
The AP for the baseline model and a model with uda on DeepScoresV2 and the RealScores dataset.
| DeepScoresV2 dataset | |
| Model | AP (overlap = 0.25) |
| Baseline | 87.6% |
| uda | 72.4% |
| RealScores dataset | |
| Model | AP (overlap = 0.25) |
| Baseline | 36.0% |
| uda | 48.9% |
Table 5
The AP for the model not utilizing ensembles and ensemble models with different cosine annealing cycle lengths on the DeepScoresV2 and the RealScores dataset.
| DeepScoresV2 dataset | |
| Model | AP (overlap = 0.25) |
| ScoreAug | 82.1% |
| ScoreAug ensemble (10 cycles) | 85.6% |
| ScoreAug ensemble (20 cycles) | 87.3% |
| ScoreAug ensemble (30 cycles) | 83.4% |
| RealScores dataset | |
| Model | AP (overlap = 0.25) |
| ScoreAug | 37.9% |
| ScoreAug ensemble (10 cycles) | 44.6% |
| ScoreAug ensemble (20 cycles) | 46.7% |
| ScoreAug ensemble (30 cycles) | 47.0% |
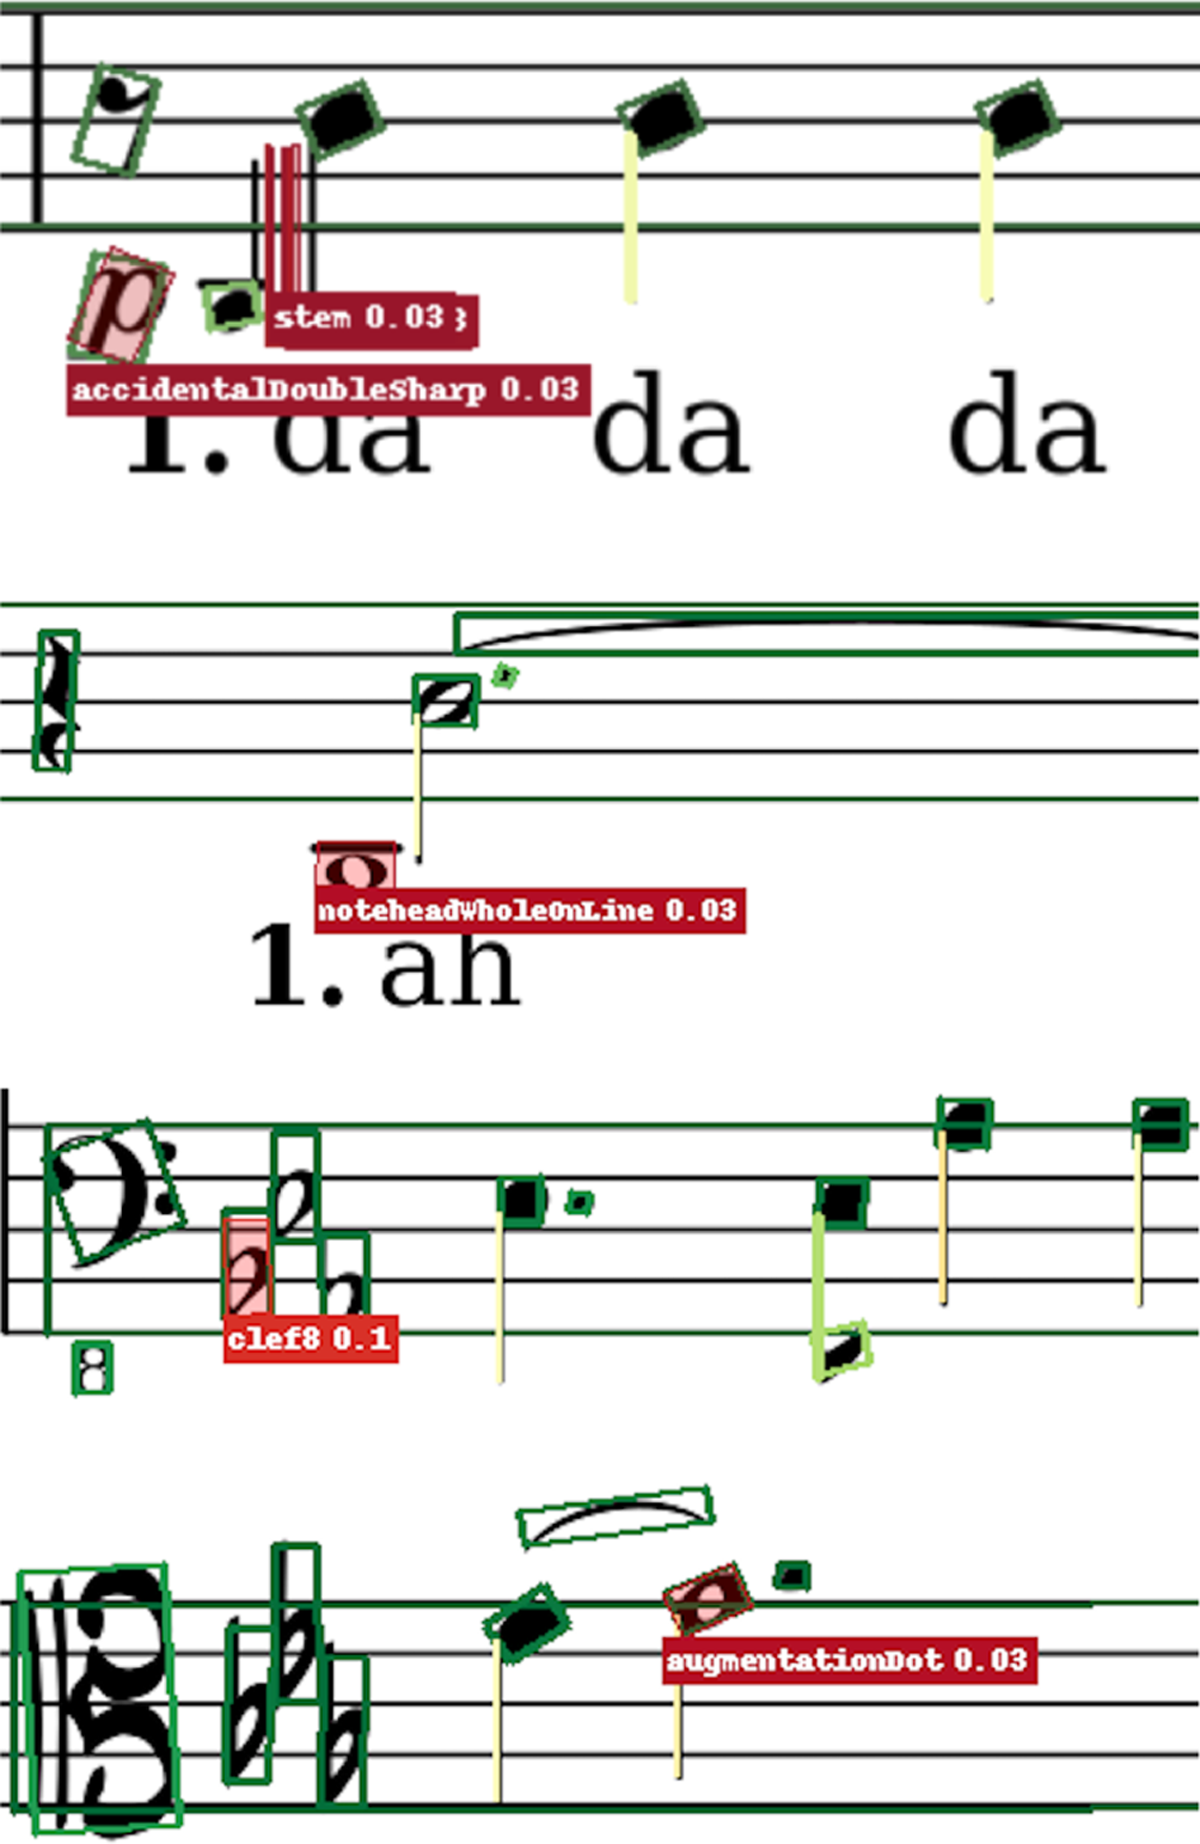
Figure 6
Four cropped visualisation samples of predictions made by an ensemble. The colour of the bounding box indicates the model’s confidence (green means high confidence, and red means low confidence). For symbols with a confidence score below 30%, we plot not only the coloured bounding box but also the assigned label as well as the confidence score.
Table 6
The AP for the ensemble trained with a cosine annealing cycle length of 20. The model is trained once with ScoreAug only and once with ScoreAug in combination with 50 subsequent Finalise cycles.
| DeepScoresV2 dataset | |
| Ensemble (cycle length = 20) | AP (overlap = 0.25) |
| ScoreAug | 87.3% |
| ScoreAug & Finalise | 81.5% |
| RealScores dataset | |
| Ensemble (cycle length = 20) | AP (overlap = 0.25) |
| ScoreAug | 46.7% |
| ScoreAug & Finalise | 63.6% |