
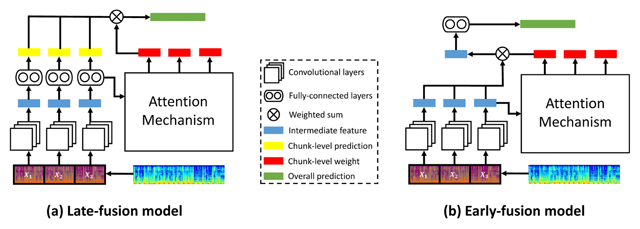
Figure 1
Architecture of two attention-based models using different fusion methods for highlight extraction. We note that model (a) was used by Huang et al. (2017b) and model (b) by Ha et al. (2017).
Table 1
Network architecture of the proposed NAMLF (pos) model. For convolutional layers (conv), the values represent (from left to right in the same row): number of filters, kernel size, strides and activation functions. For fully-connected layers, the values represent: number of hidden units, dropout rate and activation functions. All layers use batch normalization. We also show the size of the input, output and all the intermediate output of the training stage.
| (Assume mini-batch size is 16; each clip has 8 chunks) Input reshape, | ||||
| Feature extraction | ||||
| conv | 64 | 3 × 128 | (2, 128) | ReLU |
| conv | 128 | 4 × 1 | (2, 1) | ReLU |
| conv | 256 | 4 × 1 | (2, 1) | ReLU |
| global max-pool to reshape, | ||||
| Attention mechanism | ||||
| add positional encodings | ||||
| fully-connected | 256 | 0.5 | ReLU | |
| fully-connected | 256 | 0.5 | ReLU | |
| fully-connected | 256 | 0.5 | tanh | |
| fully-connected | 1 | 0.5 | linear | |
| softmax along the second axis reshape, | ||||
| Chunk-level prediction | ||||
| fully-connected | 1024 | 0.5 | ReLU | |
| fully-connected | 190 | 0.5 | softmax | |
| Song-level prediction | ||||
| Output, | ||||
Table 2
Performance of different music highlight extraction methods for chorus detection.
| Method | F-measure | Recall | Precision | |
|---|---|---|---|---|
| Upper bound | 0.9493 | 0.9997 | 0.9173 | |
| Unsupervised | Middle | 0.3558 | 0.4708 | 0.2943 |
| Spectral energy | 0.7562 | 0.8608 | 0.6960 | |
| Spectral centroid | 0.5385 | 0.6285 | 0.4867 | |
| Spectral roll-off | 0.5080 | 0.6059 | 0.4563 | |
| Repetition | 0.4795 | 0.5973 | 0.4110 | |
| Emotion | RNAM-LF | 0.7803 | 0.9006 | 0.7097 |
| NAM-LF (pos) | 0.7994 | 0.9017 | 0.7397 | |
| NAM-EF (pos) | 0.7686 | 0.8727 | 0.7073 | |
| NAM-LF | 0.7739 | 0.8760 | 0.7120 | |
| Genre | RNAM-LF | 0.6314 | 0.7488 | 0.5663 |
| NAM-LF (pos) | 0.5891 | 0.6993 | 0.5273 | |
| NAM-EF (pos) | 0.4688 | 0.5649 | 0.4167 | |
| NAM-LF | 0.5685 | 0.6725 | 0.5127 |
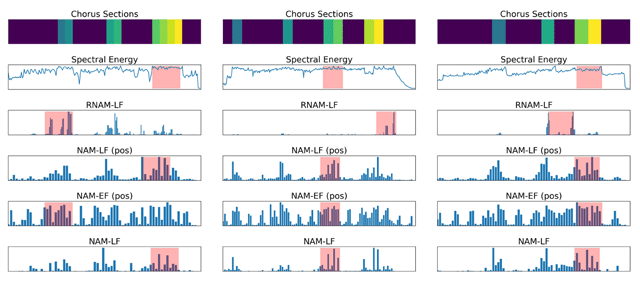
Figure 2
Top row: the ground truth chorus sections, where different colors indicate different chorus sections (e.g., chorus A and chorus B) of a song. Second row: the energy curve. Last four rows: the attention curves estimated by four different emotion-based models, for three songs in RWC-Pop. From left to right: ‘Disc1/006.mp3’, ‘Disc2/003.mp3’ and ‘Disc3/008.mp3’. In RNAM-LF, we have an attention score for each 1-second audio chunk, following our previous work (Huang et al., 2017b); for the other three attention-based methods, we have an attention score for each 3-second audio chunk. The red regions mark the resulting 30-second highlights. More examples can be found on the github page.
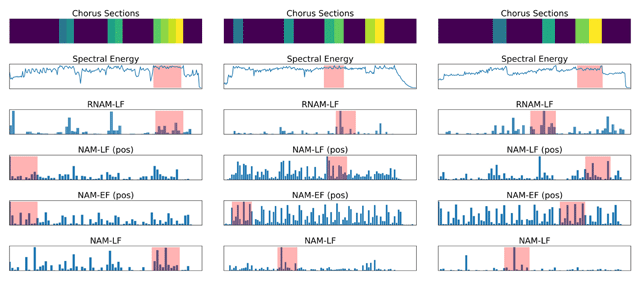
Figure 3
Last four rows: Attention curves and the resulting 30-second highlights of different attention-based methods, all genre based, for the same three songs used in Figure 2 (see Figure 2 caption for details).
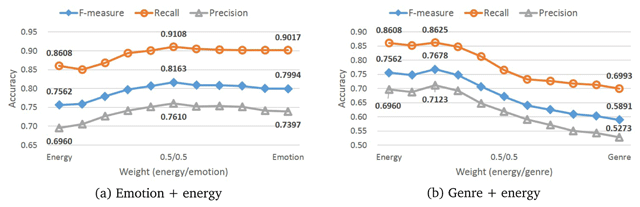
Figure 4
Results of chorus detection by fusing the energy curve with the attention curve estimated by either (a) emotion-based NAM-LF (pos) or (b) genre-based NAM-LF (pos).